![]()
MIRA
INFORM REPORT
|
Report Date : |
07.05.2011 |
IDENTIFICATION DETAILS
|
Name : |
L.N.R. ASSOCIATES COMPANY LIMITED |
|
|
|
|
Registered Office : |
711/34 Trok
Watchannai, |
|
|
|
|
Country : |
|
|
|
|
|
Financials (as on) : |
31.12.2009 |
|
|
|
|
Date of Incorporation : |
31.07.1979 |
|
|
|
|
Com. Reg. No.: |
0105522014139 |
|
|
|
|
Legal Form : |
Private
Limited Company |
|
|
|
|
Line of Business : |
Importer & Distributor of Agrochemical Products |
RATING & COMMENTS
|
MIRA’s Rating : |
B |
|
RATING |
STATUS |
PROPOSED CREDIT LINE |
|
|
26-40 |
B |
Capability to overcome financial difficulties seems comparatively
below average. |
Small |
|
Status : |
Moderate |
|
Payment Behaviour : |
Unknown |
|
Litigation : |
Clear |
NOTES :
Any query related to this report can be made
on e-mail: infodept@mirainform.com
while quoting report number, name and date.
ECGC Country Risk Classification List – December 31, 2010
|
Country Name |
Previous Rating (30.09.2010) |
Current Rating (31.12.2010) |
|
|
B1 |
B1 |
|
Risk Category |
ECGC
Classification |
|
Insignificant |
A1 |
|
Low |
A2 |
|
Moderate |
B1 |
|
High |
B2 |
|
Very High |
C1 |
|
Restricted |
C2 |
|
Off-credit |
D |
Company name
L.N.R.
ASSOCIATES COMPANY LIMITED
SUMMARY
BUSINESS
ADDRESS : 711/34 TROK WATCHANNAI,
BANGKLO, BANGKORLAEM,
TELEPHONE : [66] 2291-5631-2
FAX :
[66] 2291-1049
E-MAIL
ADDRESS : lnrgroups@lnrgroups.com
REGISTRATION
ADDRESS : SAME
AS BUSINESS ADDRESS
ESTABLISHED
: 1979
REGISTRATION
NO. : 0105522014139 [Former:
1419/2522]
CAPITAL REGISTERED : BHT. 50,000,000
CAPITAL PAID-UP : BHT.
50,000,000
FISCAL YEAR CLOSING DATE : DECEMBER 31
LEGAL
STATUS : PRIVATE LIMITED
COMPANY
EXECUTIVE : MR. CHAKKRISH SIRICHEWAKUL, THAI
MANAGING DIRECTOR
& FACTORY MANAGER
NO.
OF STAFF : 70
LINES
OF BUSINESS : AGROCHEMICAL PRODUCTS
IMPORTER &
DISTRIBUTOR
CORPORATE PROFILE
OPERATING
TREND : STABLE
PRESENT
SITUATION : OPERATING NORMALLY
REPUTATION : GOOD
WITH
MANAGEMENT
STANDARD : MANAGEMENT WITH
LOW PERFORMANCE
HISTORY
The
subject was established
on July 31,
1979 as a private
limited company under the
name style L.N.R. ASSOCIATES COMPANY LIMITED by Thai groups, with the
business objective manufacture
wide range of agrochemical and
related products for
domestic and international
markets.
Recently,
the subject’s business
lines became to
import and distribute
agrochemical and related
products for domestic
market. It currently
employs approximately 70
staff.
The subject’s registered address
is 711/34 Trok
Watchannai, Charoenkrung Rd.,
Bangklo, Bangkorlaem, Bangkok
10120, and this
is the subject’s
current operation address.
THE BOARD
OF DIRECTORS
|
Name |
|
Nationality |
Age |
|
|
|
|
|
|
Mr. Chakkrish Sirichewakul |
|
Thai |
66 |
|
Ms. Laksamee Yiangyongphan |
|
Thai |
55 |
AUTHORIZED PERSON
One of the
above directors can
sign on behalf
of the subject
with company’s affixed.
MANAGEMENT
Mr. Chakkrish Sirichewakul is
the Managing Director
and Factory Manager.
He is Thai
nationality with the
age of 66
years old.
BUSINESS OPERATIONS
The subject is engaged in importing and distributing wide
range of agro-chemicals including
insecticide, herbicide, pesticide,
acaricide, fertilizer and
related chemicals for
agriculture business.
PURCHASE
Most of the products
are imported from
Taiwan, Republic of China,
Spain and India,
the remaining is
purchased from local
suppliers and agents.
MAJOR SUPPLIER
Jiangsu
Shuangling Chemical Group
Co., Ltd. :
Lianco
SA. :
Wu
Jin Pesticide Factory
Ltd. : Republic
of
Phesol
Industrial Co., Ltd. :
SALES
100% of the
products is sold
locally by wholesale
to dealers and
end-users.
SUBSIDIARY AND
AFFILIATED COMPANY
The subject is
not found to
have any subsidiary
nor affiliated company
here in Thailand.
LITIGATION
Bankruptcy and Receivership
There are no
litigation on bankruptcy
and receivership cases
filed against the
subject found at
Legal Execution Department
for the past
five years.
Others
There are no
legal suits filed
against the subject
for the past
two years.
CREDIT
Sales are by
cash or on
the credits term
of 30-60 days.
Local bills are
paid by cash
or on the
credits term of
30-60 days.
Imports are by L/C at
sight or T/T.
BANKING
Kasikornbank Public Co.,
Ltd.
[Sukhumvit International
Trade Centre : 591
Sukhumvit 33 Rd.,
Klongtoey,
EMPLOYMENT
The
subject employs approximately 70
staff.
LOCATION DETAILS
The premise is
owned for administrative office
at the heading
address. Premise is
located in commercial/residential area.
Branch:
135 Moo 5, T.
Tungkraphanghom, A. Kampaengsaen, Nakhonpathom
73140. Tel. [66]
34 204-861-2, Fax [66] 34
204-791.
Warehouse
is located at
47/19 Moo 3, Soi
Boonsap, Samaedam Rd.,
Samaedam, Bangkhunthien, Bangkok
10150.
REMARK
CREDIT
OF US$ 125,000
AGAINST DA TERMS
SHOULD BE ON
SECURED BASIS.
COMMENT
The
subject is engaged
in distributing the
quality chemical especially
for insecticides and
pesticides. It has
achieved high customers
satisfaction, delivered products
that have great
appeal in the
market. It also attributed
the improvement to the successful
sales of the
products in the
year 2010. Market
outlook is promising.
FINANCIAL INFORMATION
The
capital was registered
at Bht. 1,000,000
divided into 10,000 shares
of Bht. 100
each.
The
capital was increased
later as following:
Bht. 10,000,000
on March 2,
2000
Bht. 30,000,000
on December 6,
2001
Bht. 50,000,000
on August 3,
2006
The
latest registered capital
was increased to
Bht. 50,000,000 divided into 500,000 shares of
Bht. 100 each
with fully paid.
THE SHAREHOLDERS
LISTED WERE
[as
at April 30,
2010]
|
NAME |
HOLDING |
% |
|
|
|
|
|
Mr. Chakkrish Sirichewakul Nationality: Thai Address : 491/130
Trok Watchannai, Bangklo,
Bangkorlaem, |
190,000 |
38.00 |
|
Mr. Yiangkeeheng Saeyiang Nationality: Thai Address : 491/130
Trok Watchannai, Bangklo,
Bangkorlaem, |
105,000 |
21.00 |
|
Mrs. Ladawal Sirichewakul Nationality: Thai Address : 711/34 Trok
Watchannai, Bangklo,
Bangkorlaem, |
66,000 |
13.20 |
|
Mr. Bhuritat Yiangyongphan Nationality: Thai Address : 195
Taksin 19 Rd.,
Bukkalo, Thonburi, |
44,000 |
8.80 |
|
Ms. Laksamee Yiangyongphan Nationality: Thai Address : 195
Taksin 19 Rd.,
Bukkalo, Thonburi, |
40,000 |
8.00 |
|
Mr. Bodee Sirichewakul Nationality: Thai Address :
491/130 Trok Watchannai,
Bangklo, |
21,500 |
4.30 |
|
Mr. Santi Sirichewakul Nationality: Thai Address : 491/130
Trok Watchannai, Bangklo,
Bangkorlaem, |
21,500 |
4.30 |
|
Mr. Nophadol Sirichewakul Nationality: Thai Address : |
6,000 |
1.20 |
|
Mr. Vichit Sirichewakul Nationality: Thai Address : |
6,000 |
1.20 |
Total Shareholders : 9
NAME OF AUDITOR
& CERTIFIED PUBLIC
ACCOUNTANT NO.
Ms. Rungvilai
Viwatpatanapong No. 5790
BALANCE SHEET [BAHT]
The
latest financial figures
published for December
31, 2009 &
2008 were:
ASSETS
|
Current Assets |
2009 |
2008 |
|
|
|
|
|
Cash and Cash Equivalents
|
1,117,512.21 |
28,953,992.75 |
|
Trade Accts. Receivable-Other |
108,999,072.17 |
60,003,568.00 |
|
Receivable-Related Company |
9,927,452.00 |
5,760,900.00 |
|
Inventories |
82,171,532.72 |
128,563,919.75 |
|
Other Current Assets
|
3,771,594.11 |
3,522,922.76 |
|
Total Current Assets
|
205,987,163.21 |
226,805,303.26 |
|
|
|
|
|
Fixed Assets |
8,476,178.52 |
8,619,528.37 |
|
Other Assets |
30,941,110.46 |
30,941,110.46 |
|
Total Assets |
245,404,452.19 |
266,365,942.09 |
LIABILITIES &
SHAREHOLDERS' EQUITY [BAHT]
|
Current
Liabilities |
2009 |
2008 |
|
|
|
|
|
Bank Overdraft |
12,641,763.17 |
6,716,215.07 |
|
Loan from Bank |
10,000,000.00 |
40,000,000.00 |
|
Trade Accts. & Notes
Payable |
107,804,778.86 |
133,359,504.59 |
|
Other Current Liabilities |
2,629,175.68 |
1,139,772.70 |
|
Total Current Liabilities |
133,075,717.71 |
181,215,492.36 |
|
Installment Payable Due
in 1 year |
1,274,564.00 |
1,732,330.00 |
|
Long Term Loan
from Directors |
59,100,000.00 |
23,500,000.00 |
|
Total Liabilities |
193,450,281.71 |
206,447,822.36 |
|
|
|
|
|
Shareholders' Equity |
|
|
|
|
|
|
|
Share capital : Baht 100
par value authorized, issued
and fully paid share capital
500,000 shares |
50,000,000.00 |
50,000,000.00 |
|
Capital Paid |
50,000,000.00 |
50,000,000.00 |
|
Retained Earning -
Unappropriated |
1,954,170.48 |
9,918,119.73 |
|
Total Shareholders' Equity |
51,954,170.48 |
59,918,119.73 |
|
Total Liabilities & Shareholders' Equity |
245,404,452.19 |
266,365,942.09 |
PROFIT &
LOSS ACCOUNT
|
Revenue |
2009 |
2008 |
|
|
|
|
|
Sales |
339,631,365.00 |
452,007,717.00 |
|
Less : Refundable Goods |
[6,407,000.00] |
- |
|
Export Income |
2,921,735.05 |
- |
|
Other Income |
938,926.51 |
1,037,568.96 |
|
Total Revenues |
337,085,026.56 |
453,045,285.96 |
|
Expenses |
|
|
|
|
|
|
|
Cost of Goods
Sold |
323,254,264.86 |
423,467,365.05 |
|
Selling Expenses |
1,297,363.59 |
1,382,906.51 |
|
Administrative Expenses |
15,305,959.64 |
24,564,949.74 |
|
Total Expenses |
339,857,588.09 |
449,415,221.30 |
|
Profit Before Financial
Cost & Income
Tax |
[2,772,561.53] |
3,630,064.66 |
|
Financial Cost |
[5,191,387.72] |
[14,946,349.55] |
|
Income Tax |
- |
- |
|
Net
Profit / [Loss] |
[7,963,949.25] |
[11,316,284.89] |
FINANCIAL ANALYSIS
|
ITEM |
UNIT |
2009 |
2008 |
|
|
|
|
|
|
LIQUIDITY
RATIO |
|
|
|
|
CURRENT RATIO |
TIMES |
1.55 |
1.25 |
|
QUICK RATIO |
TIMES |
0.90 |
0.52 |
|
|
|
|
|
|
ACTIVITY
RATIO |
|
|
|
|
FIXED ASSETS TURNOVER |
TIMES |
40.41 |
52.44 |
|
TOTAL ASSETS TURNOVER |
TIMES |
1.40 |
1.70 |
|
INVENTORY CONVERSION PERIOD |
DAYS |
92.78 |
110.81 |
|
INVENTORY TURNOVER |
TIMES |
3.93 |
3.29 |
|
RECEIVABLES CONVERSION PERIOD |
DAYS |
116.14 |
48.45 |
|
RECEIVABLES TURNOVER |
TIMES |
3.14 |
7.53 |
|
PAYABLES CONVERSION PERIOD |
DAYS |
121.73 |
114.95 |
|
CASH CONVERSION CYCLE |
DAYS |
87.20 |
44.32 |
|
|
|
|
|
|
PROFITABILITY
RATIO |
|
|
|
|
COST OF GOODS SOLD |
% |
94.37 |
93.69 |
|
SELLING & ADMINISTRATION |
% |
4.85 |
5.74 |
|
INTEREST |
% |
1.52 |
3.31 |
|
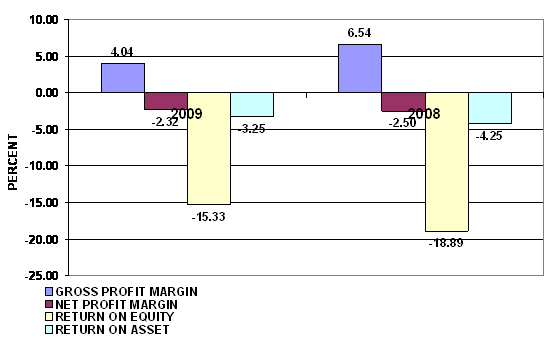
GROSS PROFIT MARGIN |
% |
4.04 |
6.54 |
|
NET PROFIT MARGIN BEFORE EX. ITEM |
% |
(0.81) |
0.80 |
|
NET PROFIT MARGIN |
% |
(2.32) |
(2.50) |
|
RETURN ON EQUITY |
% |
(15.33) |
(18.89) |
|
RETURN ON ASSET |
% |
(3.25) |
(4.25) |
|
EARNING PER SHARE |
BAHT |
(15.93) |
(22.63) |
|
|
|
|
|
|
LEVERAGE
RATIO |
|
|
|
|
DEBT RATIO |
TIMES |
0.79 |
0.78 |
|
DEBT TO EQUITY RATIO |
TIMES |
3.72 |
3.45 |
|
TIME INTEREST EARNED |
TIMES |
(0.53) |
0.24 |
|
|
|
|
|
|
ANNUAL
GROWTH |
|
|
|
|
SALES GROWTH |
% |
(24.22) |
|
|
OPERATING PROFIT |
% |
(176.38) |
|
|
NET PROFIT |
% |
29.62 |
|
|
FIXED ASSETS |
% |
(1.66) |
|
|
TOTAL ASSETS |
% |
(7.87) |
|
PROFITABILITY
RATIO
|
Gross Profit Margin |
4.04 |
Deteriorated |
Industrial Average |
10.07 |
|
Net Profit Margin |
(2.32) |
Deteriorated |
Industrial Average |
1.37 |
|
Return on Assets |
(3.25) |
Deteriorated |
Industrial Average |
3.50 |
|
Return on Equity |
(15.33) |
Deteriorated |
Industrial Average |
10.32 |
Gross Profit Margin used to assess a firm's
financial health by revealing the proportion of money left over from revenues after
accounting for the cost of goods sold. Gross profit margin serves as the source
for paying additional expenses and future savings. The company's figure is
4.04%. When compared with the industry average, the ratio of the company was
lower. This indicated that company was originated from the problems with control over its costs.
Net Profit Margin is the indicator of the
company's efficiency in that net profit takes into consideration all expenses
of the company. A low profit margin indicates a low margin of safety, higher
risk that a decline in sales will erase profits and result in a net loss. The
company's figure is -2.32%. When compared with the industry average, the ratio
of the company was lower.
Return on Assets measures how efficiently
profits are being generated from the assets employed in the business when
compared with the ratios of firms in a similar business. A low ratio in
comparison with industry averages indicates an inefficient use of business
assets. When compared with the industry average, it was lower, the company's
figure is -3.25%.
Return on Equity indicates how profitable a
company is by comparing its net income to its average shareholders' equity, ROE
measures how much the shareholders earned for their investment in the company. When
compared with the industry average, it was lower, the company's figure is
-15.33%.
Trend
of the average competitors in the same industry for last 5 years
Return on Assets Uptrend
Return on Equity Downtrend
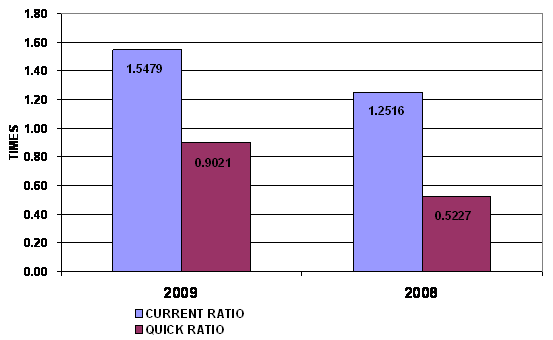
LIQUIDITY
RATIO
|
Current Ratio |
1.55 |
Impressive |
Industrial Average |
1.41 |
|
Quick Ratio |
0.90 |
|
|
|
|
Cash Conversion Cycle |
87.20 |
|
|
|
The Current Ratio is to ascertain whether a
company's short-term assets are readily available to pay off its short-term liabilities.
The company's figure is 1.55 times in 2009, increase from 1.25 times, then it
is generally considered to have good short-term financial strength. When
compared with the industry average, the ratio of the company was higher,
indicated that company was an efficient operator in a dominant position within its industry.
The Quick Ratio is a liquidity indicator
that further refines the current ratio by measuring the amount of the most
liquid current assets there are to cover current liabilities. The company's
figure is 0.9 times in 2009, increase from 0.52 times, by excluding inventory,
the company may have problems meeting current liabilities.
The Cash Conversion Cycle measures the
number of days a company's cash is tied up in the production and sales process
of its operations and the benefit from
payment terms from its creditors. It meant the company could survive when no
cash inflow was received from sale for 88 days.
Trend
of the average competitors in the same industry for last 5 years
Current Ratio Uptrend


LEVERAGE
RATIO
|
Debt Ratio |
0.79 |
Impressive |
Industrial Average |
0.61 |
|
Debt to Equity Ratio |
3.72 |
Risky |
Industrial Average |
1.74 |
|
Times Interest Earned |
(0.53) |
Risky |
Industrial Average |
2.23 |
Debt to Equity Ratio a measurement of how
much suppliers, lenders, creditors and obligors have committed to the company
versus what the shareholders have committed. A lower the percentage means that
the company is using less leverage and has
stronger equity position.
Times Interest Earned measuring a company's
ability to meet its debt obligations. Ratio is -0.54 lower than 1, so the
company is not generating enough cash from EBIT to meet its interest
obligations.
Debt Ratio shows the proportion of a company's
assets which are financed through debt. The company's figure is 0.79 greater
than 0.5, most of the company's assets are financed through debt.
Trend
of the average competitors in the same industry for last 5 years
Debt Ratio Downtrend
Times Interest Earned Uptrend

ACTIVITY
RATIO
|
Fixed Assets Turnover |
40.41 |
Impressive |
Industrial Average |
10.31 |
|
Total Assets Turnover |
1.40 |
Acceptable |
Industrial Average |
2.56 |
|
Inventory
Conversion Period |
92.78 |
|
|
|
|
Inventory
Turnover |
3.93 |
Acceptable |
Industrial Average |
7.30 |
|
Receivables
Conversion Period |
116.14 |
|
|
|
|
Receivables
Turnover |
3.14 |
Acceptable |
Industrial Average |
4.60 |
|
Payables
Conversion Period |
121.73 |
|
|
|
Trend
of the average competitors in the same industry for last 5 years
Fixed Assets Turnover Downtrend
Total Assets Turnover Uptrend
Inventory Turnover Uptrend
Receivables Turnover Uptrend
FOREIGN EXCHANGE RATES
|
Currency |
Unit
|
Indian Rupees |
|
US Dollar |
1 |
Rs.44.78 |
|
|
1 |
Rs.73.43 |
|
Euro |
1 |
Rs.65.27 |
RATING EXPLANATIONS
|
RATING |
STATUS |
PROPOSED CREDIT LINE |
|
|
>86 |
Aaa |
Possesses an extremely sound financial base with the strongest capability
for timely payment of interest and principal sums |
Unlimited |
|
71-85 |
Aa |
Possesses adequate working capital. No caution needed for credit
transaction. It has above average (strong) capability for payment of interest
and principal sums |
Large |
|
56-70 |
A |
Financial & operational base are regarded healthy. General
unfavourable factors will not cause fatal effect. Satisfactory capability for
payment of interest and principal sums |
Fairly Large |
|
41-55 |
Ba |
Overall operation is considered normal. Capable to meet normal
commitments. |
Satisfactory |
|
26-40 |
B |
Capability to overcome financial difficulties seems comparatively
below average. |
Small |
|
11-25 |
Ca |
Adverse factors are apparent. Repayment of interest and principal sums
in default or expected to be in default upon maturity |
Limited with
full security |
|
<10 |
C |
Absolute credit risk exists. Caution needed to be exercised |
Credit not
recommended |
|
-- |
NB |
New Business |
-- |
This score serves as a reference to assess SC’s credit risk
and to set the amount of credit to be extended. It is calculated from a composite
of weighted scores obtained from each of the major sections of this report. The
assessed factors and their relative weights (as indicated through %) are as
follows:
Financial
condition (40%) Ownership
background (20%) Payment
record (10%)
Credit history
(10%) Market trend
(10%) Operational
size (10%)
This report is issued at your request without any
risk and responsibility on the part of MIRA INFORM PRIVATE LIMITED (MIPL)
or its officials.