MIRA INFORM REPORT


Report Date :

26.05.2011


IDENTIFICATION DETAILS


Name :

STE AFRIQUIA LUBRIFIANTS


Registered Office :

Immeuble Tafraouti, Route de Rabat (R.P. 1) Km 7, Ain Sebaa, Casablanca


Country :

Morocco


Financials (as on) :

31.12.2009


Date of Incorporation :

28.10.1976


Com. Reg. No.:

34861


Legal Form :

Societe Anonyme


Line of Business :

Manufacture of refined petroleum products


RATING & COMMENTS


MIRA’s Rating :

Ba


RATING

STATUS

PROPOSED CREDIT LINE

41-55

Ba

Overall operation is considered normal. Capable to meet normal commitments.

Satisfactory


Status :

Satisfactory


Payment Behaviour :

No Complaints


Litigation :

Clear


NOTES :

Any query related to this report can be made on e-mail: infodept@mirainform.com while quoting report number, name and date.


ECGC Country Risk Classification List – March 31st, 2011


Country Name

Previous Rating

(31.12.2010)

Current Rating

(31.03.2011)

Morocco

A2

A2


Risk Category

ECGC Classification

Insignificant


A1

Low


A2

Moderate


B1

High


B2

Very High


C1

Restricted


C2

Off-credit


D


company Name

STE AFRIQUIA LUBRIFIANTS


Registration Briefing


      Registration Number:                       34861


      Registration Date:                            28/10/1976


      Legal Form:                                     SOCIETE ANONYME


      Latest Financials:                            December 31, 2009


Financial Briefing


      Nominal Capital:                              51,867,200 Moroccan Dirham


      Issued Capital:                                 N/A


      Turnover:                                         79,320,207 Moroccan Dirham


      Net Profit:                                        11,553,982 Moroccan Dirham


      Net Worth:                                       70,724,042 Moroccan Dirham


Company Details


      Company Name:                                    STE AFRIQUIA LUBRIFIANTS

      Headquarter Address:                             Immeuble Tafraouti,

                                                                  Route de Rabat (R.P. 1) Km 7,

                                                                  Ain Sebaa,

                                                                  Casablanca,

                                                                  Morocco


      Postal Address:                                     P.O.Box 2517,

                                                                  Ain Sebaa,

                                                                  Casablanca 20251


      Telephone:                                            +212522 350006

                                                                  +212522 353785

                                                                  +212522 354493

                                                                  +212522 354494

                                                                  +212522 354495


      Fax:                                                      +212522 352209


      E‑Mail:                                                  s.bensemlali@akwagroup.com

      Web Site:                                              www.akwagroup.com


        Company was originally started on 1976


Registration & Legal Details


      Current Legal Form:                             SOCIETE ANONYME

      Registration Address:                           54 Boulevard de La Grande Ceinture,

                                                                Casablanca

      Registration Number:                            34861

      Registration Date:                                28/10/1976

      Year/Date Company Established:          1976

      Registration Town:                               Casablanca

      Tax Registration Number:                     01640195


Capital


      Currency:                                                           Moroccan Dirham

      Authorized Capital:                                                       51,867,200

      Paid Up Capital:                                                           51,867,200


Authorized Capital Breakdown


        Number of Shares: 518,672                 Type of Shares:  None Selected

        Issued Shares: 518,668                      Value per share: MDH 100.00      Value of this type: 51,866,800.00


Shareholders


      Parent Company:                               AFRIQUIA SMDC,

                                                                Rue Ibnou El Ouennane

                                                                Ain Sebaa,

                                                                Casablanca,

                                                                Morocco

                                                                % Shares Held:   100.00%


Principals


        Name:                                               Mr Salah‑Eddine Bensemlali

        Position within the company:              General Director

        Country of Birth:                                 Morocco

        Nationality:                                        Moroccan

        Can fluently speak:                            Arabic & French


        Name:                                               Mr Ali Wakrim

        Position within the company:              Joint General Director

        Country of Birth:                                 Morocco

        Nationality:                                        Moroccan

        Can fluently speak:                            Arabic & French


        Name:                                               Mr Adil Ziady

        Position within the company:              Production Director

        Country of Birth:                                 Morocco

        Nationality:                                        Moroccan

        Can fluently speak:                            Arabic & French


        Name:                                               Mr Abdelali Moukrim

        Position within the company:              Financial Director

        Country of Birth:                                 Morocco

        Nationality:                                        Moroccan

        Can fluently speak:                            Arabic & French


Company Activities


        NACE Codes:  1920           Manufacture of refined petroleum products


        The company is specialised in manufacture and marketing of lubricants, synthetic motor oils and greases.


        Local Reporters consider the investigated company to be MEDIUM in their field of concern.


Operations


         Employees                                      Company Employs: 83


         HQ Premises                                   Operates from:     Owned Offices

                                                                Premises Size:    300 square meters

                                                                Location:             Industrial Area


        Brands:                                             AFRIQUIA ‑ Lubricant


         Exports


                                                              Export % and type of product:     Subject does not export


          Trading & Selling


                                                               Territory:                       100% Nationally

                                                              Type of Customer:          Resellers, Oil Stations & Industrial Companies


Related Companies


         Subsidiaries

         Affiliates

                                  AFRILUB

                                  Ain Sebaa,                                     Owned 50% by subject

                                  Casablanca,

                                  Morocco

                                  Operates as: Manufacture of lubricants.


Bankers


        Banque Marocaine pour le Commerce et l'Industrie,

        Branch: Head office

        26 Place des Nations Unies,

        Casablanca,

        Morocco


        Attijariwafa Bank,

        Branch: Head office

        163 Avenue Hassan II,

        Casablanca,

        Morocco


        BMCE Bank,

        Branch: Head office

        140 Avenue Hassan II,

        Casablanca,

        Morocco


        Société Générale,

        Branch: Head office

        55 Boulevard Abdelmoumen,

        Casablanca,

        Morocco


Financial Information


        Financial Interview Date:                     25/05/2011

        Source:                                             Companies Registry

        Figures are:                                       Official Figures

        Currency:                                          Moroccan Dirham


              Months         Sales Figures         Sales                            Gross Profit/Loss           Net Profit/Loss

               12                31/12/2009              79,320,207                           15,159,309             11,553,982

               12                31/12/2008              74,254,760                           5,839,031                5,467,493


Balance Sheet & Profit & Loss


        BALANCE SHEET

                                                                   As at: 31‑Dec‑2009                   As at: 31‑Dec‑2008

  Fixed Assets

  Land & Buildings                                                   5,000,938                                 5,279,380

  Plant & Machinery                                                3,095,135                                 4,133,299

  Furniture & Equipment                                           1,249,595                                 1,526,663

  Motor Vehicles                                                        161,743                                    243,687

  Misc. Fixed Assets

  Total Fixed Assets                                               9,507,411                               11,183,029


  Financial Assets

  Shares in Related Companies                              75,000,000                               75,000,000

  Loans to related companies

  Investments

  Deposits

  Misc. Financial Assets                                                5,778                                       5,778

  Total Financial Assets                                       75,005,778                               75,005,778


  Intangibles

  Goodwill

  Organisational Expenses

  Patents

  Misc. Intangible Assets

  Total Intangible Assets                                                    0                                              0


  Current Assets

  Stock                                                                 29,244,545                                 6,634,549

  Stock & Work in Progress

  Trade Debtors & receivables                                 26,892,326                               14,104,641

  Provision for bad debs

  Other receivables

  Due from related companies

  Owed by shareholders

  Prepaid expenses

  Cash                                                                      463,723                                 8,810,237

  Tax recoverable                                                     9,724,329                                 6,033,946

  Marketable Securities

  Misc. Current Assets                                               104,195                                    108,174

  Total Current Assets                                          66,429,118                               35,691,547

  Total Assets                                                     150,942,307                              121,880,354

  Owner's Equity & Liabilities

  Issued and paid up capital                                    51,867,200                               51,867,200

  Share premium account                                         1,310,205                                 1,310,205

  Retained earnings                                                    500,890                                 7,236,228

  Net profit/Loss for the year                                   11,553,982                                 5,467,493

  Revaluation reserves

  Legal Reserves                                                     2,091,765                                 1,818,390

  Other reserves                                                      3,400,000                                 3,400,000

  Net Worth                                                          70,724,042                               71,099,516


  Deffered Taxation

  Provisions/allowances

  Mortgages/Loans                                                19,800,000                               14,400,000

  Hire purchase

  Due to group of companies

  Minority interest

  Misc. deferred liabilities

  Total Long Term Liabilities                               19,800,000                               14,400,000


  Current Liabilities

  Creditors                                                            28,783,782                                 9,325,429

  Other creditors                                                            4,066                                       1,092

  Accruals

  Bank overdrafts/Loans                                           3,582,917                                 1,844,029

  Misc. Loans

  Directors accounts

  Owing to shareholders

  Owing to related companies

  Proposed dividend

  Long Term‑due 1 year

  Hire Purchase‑under 1 year

  Taxation                                                             27,743,090                               24,975,666

  Advance receipts

  Misc. Current Liabilities                                            304,410                                    234,622

  Total Current Liabilities                                    60,418,265                               36,380,838

  Owner's Equity & Liabilities                            150,942,307                              121,880,354


PROFIT & LOSS


                                                                            Figures are:                              Figures are:

                                                                             Fiscal Year                               Fiscal Year


                                                        01/01/2009 to 31/12/2009          01/01/2008 to 31/12/2008

  Total Income/Turnover                                          79,320,207                               74,254,760

  Cost of sales                                                      22,850,608                                    230,094


  Gross Profit/(Loss)                                              56,469,599                               74,024,666


  Admin/selling expenses                                       27,981,026                               50,688,022

  Services                                                               4,154,787                                 3,876,535

  Salaries                                                               6,522,537                                 6,410,513

  Auditors Fee                                                           808,678                                    671,437

  Stock Depreciation

  Depreciation                                                         3,588,968                                 6,193,428

  Misc. Operating Expenses                                     2,780,787                                    258,477

  Misc. Operating Income                                         3,839,103                                    681,018

  Net Operating Profit/(Loss)                                14,471,919                                 6,607,272


  Interest Receivable/Finance Income                            40,959                                      21,498

  Group related income

  Misc. Financial Income                                          1,567,645                                    404,973

  Total Financial Income                                       1,608,604                                    426,471


  Interest Payable/Finance costs                                 642,890                                    539,298

  Misc. financial expenses                                          278,324                                    655,414

  Total Financial Expenses                                      921,214                                 1,194,712


  Profit/(Loss) before taxes                                  15,159,309                                 5,839,031


  Income Tax                                                          3,605,327                                    371,538

  Other Tax

  Profit/(Loss) after taxes                                     11,553,982                                 5,467,493


  Extraordinary items

  Exceptional items

  Misc. Items


  Net Profit/(Loss)                                                 11,553,982                                 5,467,493


  Previous years retained earnings

  Current years net income                                     11,553,982                                 5,467,493

  Misc. additions in current year

  Current years net loss

  Dividends in current year

  Withdrawals in current year

  Misc. deductions in current year


  Retained earnings at end of                             11,553,982                                 5,467,493

  financial period


  Average employees


  Directors fee

  Earnings per share

  Earnings per share‑previous year


Auditors Comments


      Accounts obtained from:                    Companies registry


      Auditors Opinion:                               The audited financial statement gives a true and fair view of the state of affairs of the subject


                                                                Financial Statements have been prepared on an on‑going basis.

                                                                Assuming support of: shareholders


FINANCIAL RATIOS / COMPARATIVE DATA


                                      Actual Company      Industrial Averages     Actual Company      Industrial Averages

                                        Results (2009)                   (2009)                   Results (2008)                   (2008)

  Liquidity Ratios

  Current Ratio                                      1.10                            1.48                           0.98                            1.52

  Acid Test Ratio                                   0.62                            0.96                           0.80                            1.06

  Accounts                                            0.36                            0.36                           0.13                            0.31

  Payable/Sales Ratio

  Current Liabilities/Net                          0.85                            4.09                           0.51                            6.02

  Worth

  Total Liabilities/Net                              1.13                            4.57                           0.71                            6.32

  Worth

  Fixed Assets/Net                              13.44                        157.99                          15.73                        108.55

  Worth (%)


  Profitability Ratios

  Gross Profit Ratio (%)                        71.19                          93.55                          99.69                          94.45

  Return on Capital                               16.75                            5.30                           6.83                            2.61

  Employed (ROCE)(%)

  Net Profit/Sales (%)                           19.11                            2.48                           7.86                           ‑2.53

  Return on Assets (%)                        10.04                            3.76                           4.79                            3.43


  Efficiency Ratios

  Sales/Working Capital                       13.20                         ‑13.55                       ‑107.73                        187.16

  Assets/Sales(%)                             190.29                        136.75                        164.14                        142.05

  Shareholders                                     21.43                            5.06                           8.21                          17.02

  Return(%)

  Average Inventory                             286.55                  599,375.77                                                     51,884.83

  Period

  Average Collection                             94.33                        117.03                                                           99.11

  Period


  Leverage Ratios

  Capital Employed                                1.12                            5.22                           1.04                            4.85

  Capital Structure (%)                         21.87                          26.57                          16.84                          23.65


  Number of                                                                             365                                                              365

  Companies within the

  industry (NACE C)

  Statistics based on                                       Manufacturing                                               Manufacturing

  NACE(C)


    INDUSTRY SECTOR COMPARATIVE DATA


        Elements Taken              Result for specific                    RANKING                Total Companies Used

                                                      company

DATE OF REGISTRATION                        28/10/1976                                    296                                    689

TOTAL EMPLOYEES                                            83                                    423                                    690

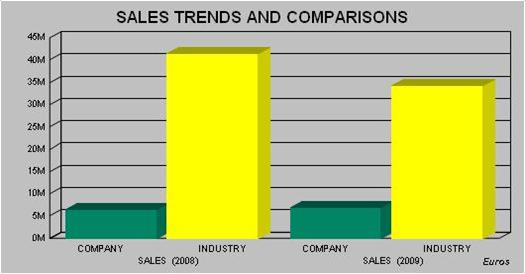
SALES (2009)                                            6,973,833                                    108                                    243

SALES (2008)                                            6,528,478                                    162                                    350

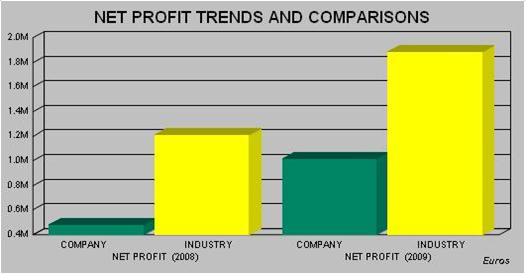
NET PROFIT (2009)                                    1,015,826                                      38                                    215

NET PROFIT (2008)                                      480,702                                      96                                    348

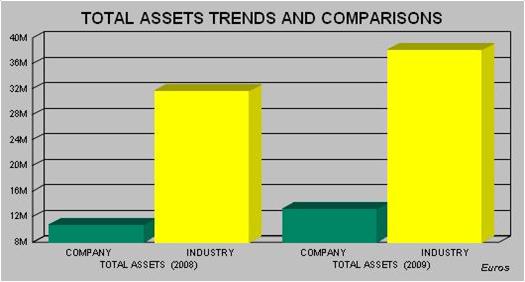
TOTAL ASSETS (2009)                             13,270,848                                      74                                    214

TOTAL ASSETS (2008)                             10,715,721                                    126                                    350


                                                                                                                                        Currency: EUROS


PLEASE NOTE THAT CHARTS ARE SHOWN IN EUROS FOR TREND AND COMPARISON PURPOSES


    The statistical Industrial Average results are calculated against companies within the specific country.


Payments


Subject's payments reported to be:        NO COMPLAINTS


Representation


Other Comments


Other Comments:                                      Patent N° : 30352260


Interview & Reporter Comments


Name/Title:                                                Mr. Abdelali Moukrim Financial Director

Comment:                                                 Latest Financial Statements are not currently available.

                                                                We have sent a fax/e‑mail/questionnaire however no reply has been received as of yet.


Reporter Comment:                                    Please note that a fax/questionnaire was sent to Mr. Abdelali Moukrim, the Financial director, however no reply has been received as of yet.


The Latest Financial statements are not currently available at the companies Registry.


Conclusions


        Local Reputation:                               The company being investigated is considered by local reporters to be a Fair / Normal Trade Risk.


        General Conclusion:                           Local informants consider granting of credit to be a fair trade risk.


        Owner/Shareholders Comments:         Some of the owners / shareholders have an active participation in the running of the business.


        Financial Results Trend:                     Financial Information indicates that the business activities of the company are showing an upward turn.


        Age of Business:                               The company is long established in the local market.


FOREIGN EXCHANGE RATES


Currency

Unit

Indian Rupees

US Dollar

1

Rs.45.38

UK Pound

1

Rs.73.31

Euro

1

Rs.63.70


RATING EXPLANATIONS


RATING

STATUS


PROPOSED CREDIT LINE

>86

Aaa

Possesses an extremely sound financial base with the strongest capability for timely payment of interest and principal sums


Unlimited

71-85

Aa

Possesses adequate working capital. No caution needed for credit transaction. It has above average (strong) capability for payment of interest and principal sums


Large

56-70

A

Financial & operational base are regarded healthy. General unfavourable factors will not cause fatal effect. Satisfactory capability for payment of interest and principal sums


Fairly Large

41-55

Ba

Overall operation is considered normal. Capable to meet normal commitments.


Satisfactory

26-40

B

Capability to overcome financial difficulties seems comparatively below average.


Small

11-25

Ca

Adverse factors are apparent. Repayment of interest and principal sums in default or expected to be in default upon maturity


Limited with full security

<10

C

Absolute credit risk exists. Caution needed to be exercised


Credit not recommended

--

NB

                                       New Business


--


This score serves as a reference to assess SC’s credit risk and to set the amount of credit to be extended. It is calculated from a composite of weighted scores obtained from each of the major sections of this report. The assessed factors and their relative weights (as indicated through %) are as follows:


Financial condition (40%)            Ownership background (20%)                 Payment record (10%)

Credit history (10%)                    Market trend (10%)                                Operational size (10%)


PRIVATE & CONFIDENTIAL : This information is provided to you at your request, you having employed MIPL for such purpose. You will use the information as aid only in determining the propriety of giving credit and generally as an aid to your business and for no other purpose. You will hold the information in strict confidence, and shall not reveal it or make it known to the subject persons, firms or corporations or to any other. MIPL does not warrant the correctness of the information as you hold it free of any liability whatsoever. You will be liable to and indemnify MIPL for any loss, damage or expense, occasioned by your breach or non observance of any one, or more of these conditions

This report is issued at your request without any risk and responsibility on the part of MIRA INFORM PRIVATE LIMITED (MIPL) or its officials.