![]()
MIRA INFORM REPORT
|
Report Date : |
08.11.2011 |
IDENTIFICATION DETAILS
|
Name : |
VICTORY
TOOL COMPANY LIMITED |
|
|
|
|
Registered Office : |
54/18 Charansanitwong 34
Road, Arun-Amarin,
Bangkoknoi, Bangkok 10700 |
|
|
|
|
Country : |
Thailand |
|
|
|
|
Financials (as on) : |
31.12.2010 |
|
|
|
|
Date of Incorporation : |
24.06.2003 |
|
|
|
|
Com. Reg. No.: |
0105546072376 |
|
|
|
|
Legal Form : |
Private Limited Company |
|
|
|
|
Line of Business : |
Importer and Distributor of Machinery and Tools |
RATING & COMMENTS
|
MIRA’s Rating : |
Ba |
|
RATING |
STATUS |
PROPOSED CREDIT LINE |
|
|
41-55 |
Ba |
Overall operation is considered normal. Capable to meet normal
commitments. |
Satisfactory |
|
Status : |
Satisfactory |
|
|
|
|
Payment
Behaviour : |
No Complaints |
|
|
|
|
Litigation : |
Clear |
NOTES :
Any query related to this report can be made
on e-mail : infodept@mirainform.com
while quoting report number, name and date.
ECGC Country Risk Classification List – September 30th, 2011
|
Country Name |
Previous Rating (30.06.2011) |
Current Rating (30.09.2011) |
|
Thailand |
b1 |
b1 |
|
Risk Category |
ECGC
Classification |
|
Insignificant |
A1 |
|
Low |
A2 |
|
Moderate |
B1 |
|
High |
B2 |
|
Very High |
C1 |
|
Restricted |
C2 |
|
Off-credit |
D |
Company name
VICTORY TOOL COMPANY
LIMITED
SUMMARY
BUSINESS
ADDRESS : 54/18
CHARANSANITWONG 34 ROAD, ARUN-AMARIN,
BANGKOKNOI, BANGKOK
10700, THAILAND
TELEPHONE : [66] 2435-5191
FAX :
[66] 2424-9678
REGISTRATION
ADDRESS : SAME
AS BUSINESS ADDRESS
ESTABLISHED
: 2003
REGISTRATION
NO. : 0105546072376
CAPITAL REGISTERED : BHT. 2,000,000
CAPITAL PAID-UP : BHT.
2,000,000
SHAREHOLDER’S PROPORTION : THAI : 100%
FISCAL YEAR CLOSING DATE : DECEMBER 31
LEGAL
STATUS : PRIVATE LIMITED
COMPANY
EXECUTIVE : MR. NARONGCHAI HIRANJARUKORN, THAI
MANAGING DIRECTOR
NO.
OF STAFF : UNKNOWN
LINES
OF BUSINESS : MACHINERY AND
TOOLS
IMPORTER AND
DISTRIBUTOR
CORPORATE PROFILE
OPERATING
TREND : STABLE
PRESENT
SITUATION : OPERATING NORMALLY
REPUTATION : FAIR
WITH NORMAL BUSINESS
ENGAGEMENT
MANAGEMENT
STANDARD : MANAGEMENT WITH
FAIR PERFORMANCE
HISTORY
The
subject was established on June
24, 2003 as
a private limited
company under the registered name
style VICTORY TOOL COMPANY LIMITED by
Thai group. Its business objective is
to distribute industrial
machinery and tools
to domestic market.
The subject’s registered address is 54/18
Charansanitwong 34 Rd., Arun-Amarin, Bangkoknoi, Bangkok
10700, and this
is the subject’s
current operation address.
THE BOARD OF DIRECTOR
|
Name |
|
Nationality |
Age |
|
|
|
|
|
|
Mr. Surin Hiranjarukorn |
|
Thai |
67 |
|
Mrs. Nuchanart Hiranjarukorn |
|
Thai |
62 |
|
Ms. Paradee Hiranjarukorn |
|
Thai |
36 |
|
Mr. Narongchai Hiranjarukorn |
[x] |
Thai |
41 |
AUTHORIZED PERSON
Only the mentioned
director [x] can
sign on behalf
of the subject
with company’s affixed.
MANAGEMENT
Mr. Narongchai Hiranjarukorn is
the Managing Director.
He is Thai
nationality with the
age of 41
years old.
LOCATION
DETAILS
The
premise is rented
for administrative office
at the heading
address. Premise is located in
commercial/residential area.
Note
Due to the
subject’s office is in the
flood area, therefore,
we were unable
to contact the
subject.
COMMENT
Subject
is a distributor of industrial machine and tools.
It reported moderate
business in the
year 2010. However,
current flood in the large
area of Bangkok
including the subject’s
office location has
resulted to temporarily
close its business.
FINANCIAL INFORMATION
The
capital was registered
at Bht. 1,000,000 divided
into 1,000 shares of Bht. 1,000
each with fully
paid.
On
August 28, 2007,
the capital was
increased to Bht.
2,000,000 divided into
2,000 shares of
Bht. 1,000 each with
fully paid.
THE SHAREHOLDERS
LISTED WERE :
[as at April
30, 2010]
|
NAME |
HOLDING |
% |
|
|
|
|
|
Mr. Narongchai Hiranjarukorn Nationality: Thai Address : 825
Moo 6, Salathammasop,
Taweewattana, Bangkok |
1,500 |
75.00 |
|
Mrs. Pakjira Hiranjarukorn Nationality: Thai Address : 825
Moo 6, Salathammasop,
Taweewattana, Bangkok |
200 |
10.00 |
|
Mr. Surin Hiranjarukorn Nationality: Thai Address : 320
Charansanitwong 65 Rd.,
Bangbamru, Bangplad,
Bangkok |
50 |
2.50 |
|
Ms. Voranuch Kittiprompong Nationality: Thai Address : 99
Moo 21, Krasang,
Krasang, Buriram |
50 |
2.50 |
|
Mrs. Nuchanart Hiranjarukorn Nationality: Thai Address : 54/18
Charansanitwong Rd.,
Arun-amarin, Bangkoknoi, Bangkok |
50 |
2.50 |
|
Mr. Vorathep Kittiprompong Nationality: Thai Address : 762/105
Moo 11, Tonthongchai, Muang, Lampang |
50 |
2.50 |
|
Ms. Pichaya Sribamrungkiat Nationality: Thai Address : 36
Bangyikhan, Bangplad, Bangkok |
50 |
2.50 |
|
Ms. Paradee Hiranjarukorn Nationality: Thai Address : 320
Charansanitwong 65 Rd.,
Bangbamru, Bangplad, Bangkok |
50 |
2.50 |
Total Shareholders : 8
Share Structure [as
at April 30,
2010]
|
Nationality |
Shareholders |
No. of Share |
% Shares |
|
|
|
|
|
|
Thai |
8 |
2,000 |
100.00 |
|
Foreign |
- |
- |
- |
|
Total |
8 |
2,000 |
100.00 |
NAME OF AUDITOR
& CERTIFIED PUBLIC
ACCOUNTANT NO. :
Ms. Nongnart Nithiprapha No.
0826
BALANCE SHEET [BAHT]
The
latest financial figures
published for December
31, 2010 &
2009 were:
ASSETS
|
Current Assets |
2010 |
2009 |
|
|
|
|
|
Cash and Cash Equivalent |
73,472.60 |
2,377,555.45 |
|
Trade Accounts Receivable |
9,146,895.00 |
1,326,600.00 |
|
Short-term Loan from Person Related |
- |
3,750,000.00 |
|
Other Current Assets |
19,298.26 |
105,836.48 |
|
|
|
|
|
Total Current Assets
|
9,239,665.86 |
7,559,991.93 |
|
|
|
|
|
Fixed Assets |
20,660.00 |
73,910.97 |
|
Other Assets |
97,285.19 |
- |
|
Total Assets |
9,357,611.05 |
7,633,902.90 |
LIABILITIES &
SHAREHOLDERS’ EQUITY [BAHT]
|
Current
Liabilities |
2010 |
2009 |
|
|
|
|
|
Bank Overdraft |
2,401.70 |
- |
|
Trade Accounts Payable |
312,796.07 |
975,065.10 |
|
Short-term Loan from Person
Related |
1,250,000.00 |
- |
|
Other Current Liabilities |
38,472.28 |
29,197.84 |
|
|
|
|
|
Total Current Liabilities |
1,603,670.05 |
1,004,262.94 |
|
Total Liabilities |
1,603,670.05 |
1,004,262.94 |
|
|
|
|
|
Shareholders’ Equity |
|
|
|
|
|
|
|
Share capital : Baht 100
par value authorized, issued
and fully paid share
capital 20,000 shares |
2,000,000.00 |
2,000,000.00 |
|
|
|
|
|
Capital Paid |
2,000,000.00 |
2,000,000.00 |
|
Retained Earning-
Unappropriated |
5,753,941.00 |
4,629,639.96 |
|
Total Shareholders' Equity |
7,753,941.00 |
6,629,639.96 |
|
Total Liabilities & Shareholders' Equity |
9,357,611.05 |
7,633,902.90 |
PROFIT & LOSS ACCOUNT
|
Sale |
2010 |
2009 |
|
|
|
|
|
Sales Income |
29,920,850.00 |
9,815,860.00 |
|
Gain on Exchange
Rate |
- |
15,263.78 |
|
Other Income [Interest
Receipt] |
- |
7,808.93 |
|
Total Sales |
29,920,850.00 |
9,838,932.71 |
|
Expenses |
|
|
|
|
|
|
|
Cost of Goods
Sold |
23,936,680.31 |
7,486,533.79 |
|
Selling and Administrative
Expenses |
4,615,223.44 |
2,090,659.67 |
|
Total Expenses |
28,551,903.75 |
9,577,193.46 |
|
|
|
|
|
Profit / [Loss] before Interest
Expenses |
1,368,946.25 |
261,739.25 |
|
Interest Expenses |
[33,211.53] |
[402.65] |
|
Profit / [Loss] before Income
Tax |
1,335,734.72 |
261,336.60 |
|
Income Tax |
[211,433.68] |
[16,700.49] |
|
|
|
|
|
Net Profit / [Loss] |
1,124,301.04 |
244,636.11 |
FINANCIAL ANALYSIS
|
ITEM |
UNIT |
2010 |
2009 |
|
|
|
|
|
|
LIQUIDITY RATIO |
|
|
|
|
CURRENT RATIO |
TIMES |
5.76 |
7.53 |
|
QUICK RATIO |
TIMES |
5.75 |
7.42 |
|
|
|
|
|
|
ACTIVITY RATIO |
|
|
|
|
FIXED ASSETS TURNOVER |
TIMES |
1,448.25 |
132.81 |
|
TOTAL ASSETS TURNOVER |
TIMES |
3.20 |
1.29 |
|
INVENTORY CONVERSION PERIOD |
DAYS |
- |
- |
|
INVENTORY TURNOVER |
TIMES |
- |
- |
|
RECEIVABLES CONVERSION PERIOD |
DAYS |
111.58 |
49.33 |
|
RECEIVABLES TURNOVER |
TIMES |
3.27 |
7.40 |
|
PAYABLES CONVERSION PERIOD |
DAYS |
4.77 |
47.54 |
|
CASH CONVERSION CYCLE |
DAYS |
106.81 |
1.79 |
|
|
|
|
|
|
PROFITABILITY
RATIO |
|
|
|
|
COST OF GOODS SOLD |
% |
80.00 |
76.27 |
|
SELLING & ADMINISTRATION |
% |
15.42 |
21.30 |
|
INTEREST |
% |
0.11 |
0.00 |
|
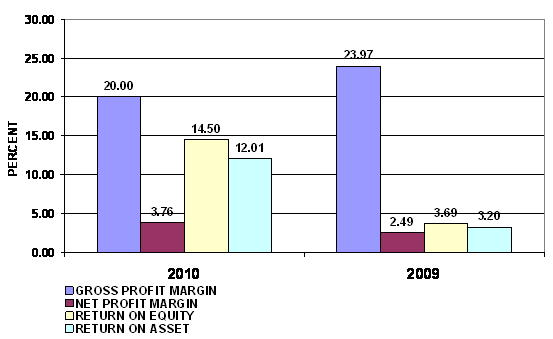
GROSS PROFIT MARGIN |
% |
20.00 |
23.97 |
|
NET PROFIT MARGIN BEFORE EX. ITEM |
% |
4.58 |
2.67 |
|
NET PROFIT MARGIN |
% |
3.76 |
2.49 |
|
RETURN ON EQUITY |
% |
14.50 |
3.69 |
|
RETURN ON ASSET |
% |
12.01 |
3.20 |
|
EARNING PER SHARE |
BAHT |
56.22 |
12.23 |
|
|
|
|
|
|
LEVERAGE RATIO |
|
|
|
|
DEBT RATIO |
TIMES |
0.17 |
0.13 |
|
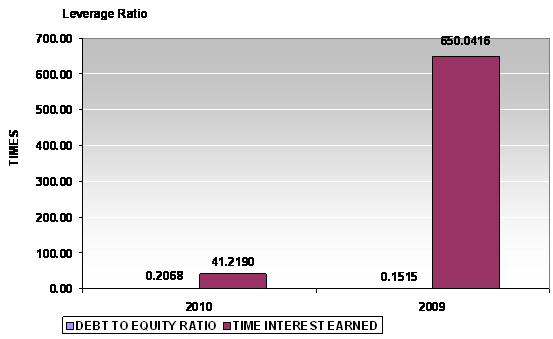
DEBT TO EQUITY RATIO |
TIMES |
0.21 |
0.15 |
|
TIME INTEREST EARNED |
TIMES |
41.22 |
650.04 |
|
|
|
|
|
|
ANNUAL GROWTH |
|
|
|
|
SALES GROWTH |
% |
204.82 |
|
|
OPERATING PROFIT |
% |
423.02 |
|
|
NET PROFIT |
% |
359.58 |
|
|
FIXED ASSETS |
% |
(72.05) |
|
|
TOTAL ASSETS |
% |
22.58 |
|
PROFITABILITY RATIO
|
Gross Profit Margin |
20.00 |
Satisfactory |
Industrial Average |
21.39 |
|
Net Profit Margin |
3.76 |
Impressive |
Industrial Average |
1.71 |
|
Return on Assets |
12.01 |
Impressive |
Industrial Average |
3.46 |
|
Return on Equity |
14.50 |
Impressive |
Industrial Average |
9.59 |
Gross Profit Margin used to assess a firm's financial health by
revealing the proportion of money left over from sales after accounting for the
cost of goods sold. Gross profit margin serves as the source for paying
additional expenses and future savings. The company's figure is 20%. When
compared with the industry average, the ratio of the company was lower,
indicated that company was originated from the
problems with control over its costs.
Net Profit Margin is the indicator of the company's efficiency in that
net profit takes into consideration all expenses of the company. A low profit
margin indicates a low margin of safety, higher risk that a decline in sales
will erase profits and result in a net loss. The company's figure is 3.76%,
higher figure when compared with those of its average competitors in the
same industry, indicated that business was an efficient operator in a dominant position within its industry.
Return on Assets measures how efficiently profits are being generated
from the assets employed in the business when compared with the ratios of firms
in a similar business. A low ratio in comparison with industry averages
indicates an inefficient use of business assets. Return on Assets ratio is
12.01%, higher figure when compared with those of its average competitors in
the same industry, indicated that business was an efficient profit in a dominant position within its industry.
Return on Equity indicates how profitable a company is by comparing its
net income to its average shareholders' equity, ROE measures how much the
shareholders earned for their investment in the company. Return on Equity ratio
is 14.5%, higher figure when compared with those of its average competitors in
the same industry, indicated that business was an efficient profit in a dominant position within its industry.
Trend of the
average competitors in the same industry for last 5 years
Return on Assets Uptrend
Return on Equity Uptrend
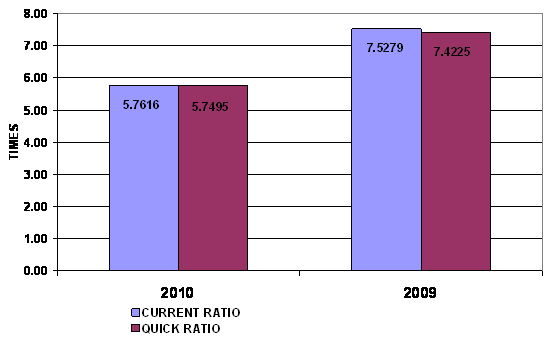
LIQUIDITY RATIO
|
Current Ratio |
5.76 |
Impressive |
Industrial Average |
2.20 |
|
Quick Ratio |
5.75 |
|
|
|
|
Cash Conversion Cycle |
106.81 |
|
|
|
The Current Ratio is to ascertain whether a company's short-term assets
are readily available to pay off its short-term liabilities. The company's
figure is 5.76 times in 2010, decrease from 7.53 times, then it is generally
considered to have good short-term financial strength. When compared with the
industry average, the ratio of the company was higher, indicated that company
was an efficient operator in a dominant position within its industry.
The Quick Ratio is a liquidity indicator that further refines the
current ratio by measuring the amount of the most liquid current assets there
are to cover current liabilities. The company's figure is 5.75 times in 2010,
decrease from 7.42 times, although excluding inventory so the company still
have good short-term financial strength.
The Cash Conversion Cycle measures the number of days a company's cash
is tied up in the production and sales process of its operations and the
benefit from payment terms from its creditors. It meant the company could
survive when no cash inflow was received from sale for 107 days.
Trend of the
average competitors in the same industry for last 5 years
Current Ratio Uptrend
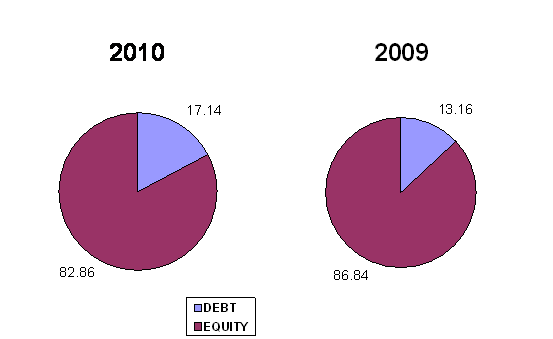
LEVERAGE RATIO
|
Debt Ratio |
0.17 |
Impressive |
Industrial Average |
0.89 |
|
Debt to Equity Ratio |
0.21 |
Impressive |
Industrial Average |
2.44 |
|
Times Interest Earned |
41.22 |
Impressive |
Industrial Average |
2.80 |
Debt to Equity Ratio a measurement of how much suppliers, lenders, creditors
and obligors have committed to the company versus what the shareholders have
committed. A lower the percentage means that the company is using less leverage
and has a stronger equity position.
Times Interest Earned measuring a company's ability to meet its debt
obligations. Ratio is 41.22 higher than 1, so the company can pay interest
expenses on outstanding debt.
Debt Ratio shows the proportion of a company's assets which are financed
through debt. The company's figure is 0.17 less than 0.5, most of the company's
assets are financed through equity.
Trend of the
average competitors in the same industry for last 5 years
Debt Ratio Uptrend
Times Interest Earned Uptrend
ACTIVITY RATIO
|
Fixed Assets Turnover |
1,448.25 |
Impressive |
Industrial Average |
11.55 |
|
Total Assets Turnover |
3.20 |
Impressive |
Industrial Average |
2.83 |
|
Inventory Conversion Period |
- |
|
|
|
|
Inventory Turnover |
- |
|
Industrial Average |
6.17 |
|
Receivables Conversion Period |
111.58 |
|
|
|
|
Receivables Turnover |
3.27 |
Deteriorated |
Industrial Average |
6.91 |
|
Payables Conversion Period |
4.77 |
|
|
|
Trend of the
average competitors in the same industry for last 5 years
Fixed Assets Turnover Uptrend
Total Assets Turnover Uptrend
Inventory Turnover Uptrend
Receivables Turnover Uptrend
FOREIGN EXCHANGE RATES
|
Currency |
Unit
|
Indian Rupees |
|
US Dollar |
1 |
Rs.49.08 |
|
UK Pound |
1 |
Rs.78.65 |
|
Euro |
1 |
Rs.67.79 |
RATING EXPLANATIONS
|
RATING |
STATUS |
PROPOSED CREDIT LINE |
|
|
>86 |
Aaa |
Possesses an extremely sound financial base with the strongest
capability for timely payment of interest and principal sums |
Unlimited |
|
71-85 |
Aa |
Possesses adequate working capital. No caution needed for credit
transaction. It has above average (strong) capability for payment of interest
and principal sums |
Large |
|
56-70 |
A |
Financial & operational base are regarded healthy. General unfavourable
factors will not cause fatal effect. Satisfactory capability for payment of
interest and principal sums |
Fairly Large |
|
41-55 |
Ba |
Overall operation is considered normal. Capable to meet normal
commitments. |
Satisfactory |
|
26-40 |
B |
Capability to overcome financial difficulties seems comparatively
below average. |
Small |
|
11-25 |
Ca |
Adverse factors are apparent. Repayment of interest and principal sums
in default or expected to be in default upon maturity |
Limited with full
security |
|
<10 |
C |
Absolute credit risk exists. Caution needed to be exercised |
Credit not
recommended |
|
---- |
NB |
New Business |
---- |
This score serves as a reference to assess SC’s credit risk and
to set the amount of credit to be extended. It is calculated from a composite
of weighted scores obtained from each of the major sections of this report. The
assessed factors and their relative weights (as indicated through %) are as
follows:
Financial
condition (40%) Ownership
background (20%) Payment
record (10%)
Credit history
(10%) Market trend
(10%) Operational
size (10%)
This report is issued at your request without any
risk and responsibility on the part of MIRA INFORM PRIVATE LIMITED (MIPL)
or its officials.