![]()
MIRA
INFORM REPORT
|
Report Date : |
12.11.2011 |
IDENTIFICATION DETAILS
|
Name : |
KOHINOOR SPINNING MILLS LIMITED |
|
|
|
|
Registered Office : |
7/1 E-3 Main Boulevard Gulberg III Lahore |
|
|
|
|
Country : |
Pakistan |
|
|
|
|
Financials (as on) : |
30.06.2009 |
|
|
|
|
Date of Incorporation : |
23.07.1970 |
|
|
|
|
Legal Form : |
Public Independent |
|
|
|
|
Line of Business : |
Preparation and spinning of textile fibres. |
RATING & COMMENTS
|
MIRA’s Rating : |
B |
|
RATING |
STATUS |
PROPOSED CREDIT LINE |
|
|
26-40 |
B |
Capability to overcome financial difficulties seems comparatively
below average. |
Small |
|
Status : |
Moderate |
|
|
|
|
Payment Behaviour : |
Slow |
|
|
|
|
Litigation : |
Clear |
NOTES :
Any query related to this report can be made
on e-mail: infodept@mirainform.com
while quoting report number, name and date.
ECGC Country Risk Classification List – September 30, 2011
|
Country Name |
Previous Rating (30.06.2011) |
Current Rating (30.09.2011) |
|
Pakistan |
B2 |
B2 |
|
Risk Category |
ECGC
Classification |
|
Insignificant |
A1 |
|
Low |
A2 |
|
Moderate |
B1 |
|
High |
B2 |
|
Very High |
C1 |
|
Restricted |
C2 |
|
Off-credit |
D |
Company name and address
Kohinoor Spinning Mills Limited
|
|
|
||||||||||||||||||||||||||||||||||||||||||||||||||||
Business
Description
|
Kohinoor Spinning Mills Ltd. is a Pakistan-based company. The Company
is engaged in the business of textile spinning. For the three months ended 30
September 2009, Kohinoor Spinning Mills Limited's revenues decreased 7% to
PKR839.2M. Net loss totaled PKR34.2M, vs. an income of PKR3.4M. Revenue
reflects a decrease in demand for the Company's product & services. Net
loss reflects a decrease in gross & operating margin and higher
distribution expenses. The Company is engaged in the business of textile
spinning in Pakistan. |
|
|
|
|
Industry
|
Industry |
Textiles - Non Apparel |
|
ANZSIC 2006: |
1312 - Natural Textile Manufacturing |
|
NACE 2002: |
171 - Preparation and spinning of textile
fibres |
|
NAICS 2002: |
313111 - Yarn Spinning Mills |
|
UK SIC 2003: |
171 - Preparation and spinning of textile
fibres |
|
US SIC 1987: |
2282 - Yarn Texturizing, Throwing,
Twisting, and Winding Mills |
|
|
|
Key Executives
|
Significant Developments
|
|||||||||
|
* number of significant developments within the last 12 months |
|
||||||||
Financial Summary
|
|
|
Stock Snapshot
|
|
1 - Profit &
Loss Item Exchange Rate: USD 1 = PKR 78.57394
2 - Balance Sheet Item Exchange Rate: USD 1 = PKR 81.44
Corporate Overview
|
||||||||||||||||||||||||||||||||||||||||||||||||||||||||||||||||||||||||||||||||||||||||||||||||||||||||||||||||||||||||||||||||||||||||||||||||||||||||||||||||||||||||||||||||||||||||||||||||||||||||||||||||||||||||||||||||||
|
|
Executives Report
|
Significant Developments
|
|
|
Annual Income
Statement
|
Financials in: USD (mil) |
|
|
Except for share items (millions) and per
share items (actual units) |
|
|
|
|
|
|
|
|
|
30-Jun-2009 |
30-Jun-2008 |
30-Jun-2007 |
30-Jun-2006 |
30-Jun-2005 |
|
Period Length |
12 Months |
12 Months |
12 Months |
12 Months |
9 Months |
|
UpdateType/Date |
Updated Normal |
Updated Normal |
Updated Normal |
Updated Normal |
Updated Normal |
|
Filed Currency |
PKR |
PKR |
PKR |
PKR |
PKR |
|
Exchange Rate (Period
Average) |
78.573941 |
62.550956 |
60.637036 |
59.865977 |
59.345369 |
|
Auditor |
Hameed Khan
& Co. |
Hameed Khan
& Co. |
Hameed Khan
& Co. |
Hameed Khan
& Co. |
Hameed Khan
& Co. |
|
Auditor Opinion |
Unqualified |
Unqualified |
Unqualified |
Unqualified |
Unqualified |
|
|
|
|
|
|
|
|
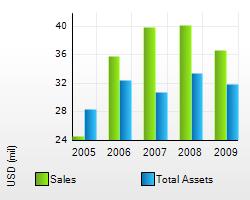
Net Sales |
36.7 |
40.2 |
39.9 |
36.0 |
24.5 |
|
Excise Tax Receipts |
- |
- |
0.0 |
0.0 |
- |
|
Revenue |
36.7 |
40.2 |
39.9 |
36.0 |
24.5 |
|
Other Revenue |
- |
- |
0.0 |
-0.1 |
- |
|
Other Revenue, Total |
- |
- |
0.0 |
-0.1 |
- |
|
Total Revenue |
36.7 |
40.2 |
39.9 |
35.9 |
24.5 |
|
|
|
|
|
|
|
|
Cost of Revenue |
33.7 |
35.9 |
35.5 |
31.9 |
21.8 |
|
Cost of Revenue, Total |
33.7 |
35.9 |
35.5 |
31.9 |
21.8 |
|
Gross Profit |
3.1 |
4.3 |
4.4 |
4.1 |
2.7 |
|
|
|
|
|
|
|
|
Selling/General/Administrative Expense |
2.0 |
2.1 |
2.0 |
1.7 |
1.2 |
|
Total Selling/General/Administrative Expenses |
2.0 |
2.1 |
2.0 |
1.7 |
1.2 |
|
Loss (Gain) on Sale of Assets - Operating |
0.0 |
0.0 |
0.0 |
- |
- |
|
Unusual Expense (Income) |
0.0 |
0.0 |
0.0 |
- |
- |
|
Other Operating Expense |
0.0 |
0.0 |
0.0 |
0.1 |
0.1 |
|
Other, Net |
-0.1 |
-0.1 |
-0.1 |
-0.4 |
-0.7 |
|
Other Operating Expenses, Total |
-0.1 |
-0.1 |
-0.1 |
-0.3 |
-0.6 |
|
Total Operating Expense |
35.7 |
37.8 |
37.4 |
33.2 |
22.4 |
|
|
|
|
|
|
|
|
Operating Income |
1.1 |
2.4 |
2.5 |
2.7 |
2.1 |
|
|
|
|
|
|
|
|
Interest Expense -
Non-Operating |
-3.0 |
-1.6 |
-1.6 |
-2.0 |
-1.1 |
|
Interest Expense, Net Non-Operating |
-3.0 |
-1.6 |
-1.6 |
-2.0 |
-1.1 |
|
Interest Income (Expense) - Net Non-Operating |
-0.5 |
-0.4 |
-0.3 |
- |
- |
|
Interest Income (Expense) - Net Non-Operating Total |
-3.5 |
-2.0 |
-1.9 |
-2.0 |
-1.1 |
|
Income Before Tax |
-2.4 |
0.4 |
0.6 |
0.6 |
1.1 |
|
|
|
|
|
|
|
|
Total Income Tax |
0.1 |
0.2 |
0.3 |
0.1 |
0.6 |
|
Income After Tax |
-2.6 |
0.2 |
0.3 |
0.5 |
0.4 |
|
|
|
|
|
|
|
|
Net Income Before Extraord Items |
-2.6 |
0.2 |
0.3 |
0.5 |
0.4 |
|
Net Income |
-2.6 |
0.2 |
0.3 |
0.5 |
0.4 |
|
|
|
|
|
|
|
|
Income Available to Common Excl Extraord Items |
-2.6 |
0.2 |
0.3 |
0.5 |
0.4 |
|
|
|
|
|
|
|
|
Income Available to Common Incl Extraord Items |
-2.6 |
0.2 |
0.3 |
0.5 |
0.4 |
|
|
|
|
|
|
|
|
Basic/Primary Weighted Average Shares |
130.0 |
130.0 |
130.0 |
130.0 |
39.5 |
|
Basic EPS Excl Extraord Items |
-0.02 |
0.00 |
0.00 |
0.00 |
0.01 |
|
Basic/Primary EPS Incl Extraord Items |
-0.02 |
0.00 |
0.00 |
0.00 |
0.01 |
|
Dilution Adjustment |
0.0 |
0.0 |
0.0 |
- |
- |
|
Diluted Net Income |
-2.6 |
0.2 |
0.3 |
0.5 |
0.4 |
|
Diluted Weighted Average Shares |
130.0 |
130.0 |
130.0 |
130.0 |
39.5 |
|
Diluted EPS Excl Extraord Items |
-0.02 |
0.00 |
0.00 |
0.00 |
0.01 |
|
Diluted EPS Incl Extraord Items |
-0.02 |
0.00 |
0.00 |
0.00 |
0.01 |
|
Dividends per Share - Common Stock Primary Issue |
0.00 |
0.00 |
0.00 |
0.01 |
0.00 |
|
Gross Dividends - Common Stock |
0.0 |
0.0 |
0.0 |
- |
0.0 |
|
Interest Expense, Supplemental |
3.0 |
1.6 |
1.6 |
2.0 |
1.1 |
|
Depreciation, Supplemental |
0.9 |
1.0 |
1.0 |
1.2 |
0.9 |
|
Total Special Items |
0.0 |
0.0 |
0.0 |
- |
- |
|
Normalized Income Before Tax |
-2.4 |
0.4 |
0.6 |
0.6 |
1.1 |
|
|
|
|
|
|
|
|
Effect of Special Items on Income Taxes |
0.0 |
0.0 |
0.0 |
- |
- |
|
Inc Tax Ex Impact of Sp Items |
0.1 |
0.2 |
0.3 |
0.1 |
0.6 |
|
Normalized Income After Tax |
-2.6 |
0.2 |
0.3 |
0.5 |
0.4 |
|
|
|
|
|
|
|
|
Normalized Inc. Avail to Com. |
-2.6 |
0.2 |
0.3 |
0.5 |
0.4 |
|
|
|
|
|
|
|
|
Basic Normalized EPS |
-0.02 |
0.00 |
0.00 |
0.00 |
0.01 |
|
Diluted Normalized EPS |
-0.02 |
0.00 |
0.00 |
0.00 |
0.01 |
|
Rental Expenses |
0.0 |
0.0 |
0.0 |
0.0 |
0.0 |
|
Advertising Expense, Supplemental |
0.0 |
0.0 |
0.0 |
0.0 |
0.0 |
|
Normalized EBIT |
1.1 |
2.3 |
2.5 |
2.7 |
2.1 |
|
Normalized EBITDA |
1.9 |
3.3 |
3.5 |
3.8 |
3.0 |
|
Interest Cost - Domestic |
0.0 |
0.0 |
0.0 |
- |
- |
|
Service Cost - Domestic |
0.1 |
0.2 |
0.2 |
- |
- |
|
Domestic Pension Plan Expense |
0.1 |
0.2 |
0.2 |
- |
- |
|
Defined Contribution Expense - Domestic |
0.1 |
0.2 |
0.1 |
- |
- |
|
Total Pension Expense |
0.2 |
0.4 |
0.4 |
- |
- |
|
Discount Rate - Domestic |
12.00% |
12.00% |
10.00% |
- |
- |
|
Compensation Rate - Domestic |
11.00% |
11.00% |
9.00% |
- |
- |
|
Total Plan Interest Cost |
0.0 |
0.0 |
0.0 |
- |
- |
|
Total Plan Service Cost |
0.1 |
0.2 |
0.2 |
- |
- |
|
|
|
Annual Balance
Sheet |
|
Financials in:
USD (mil) |
|
|
30-Jun-2009 |
30-Jun-2008 |
30-Jun-2007 |
30-Jun-2006 |
30-Jun-2005 |
|
UpdateType/Date |
Updated Normal |
Reclassified Normal
|
Updated Normal |
Updated Normal |
Updated Normal |
|
Filed Currency |
PKR |
PKR |
PKR |
PKR |
PKR |
|
Exchange Rate |
81.44 |
68.45 |
60.47 |
60.21 |
59.61 |
|
Auditor |
Hameed Khan
& Co. |
Hameed Khan
& Co. |
Hameed Khan
& Co. |
Hameed Khan
& Co. |
Hameed Khan
& Co. |
|
Auditor Opinion |
Unqualified |
Unqualified |
Unqualified |
Unqualified |
Unqualified |
|
|
|
|
|
|
|
|
Cash |
0.0 |
0.1 |
0.2 |
2.8 |
3.3 |
|
Short Term Investments |
1.4 |
1.5 |
2.5 |
0.1 |
2.2 |
|
Cash and Short Term Investments |
1.4 |
1.7 |
2.7 |
2.9 |
5.5 |
|
Trade Accounts Receivable - Net |
1.1 |
1.0 |
0.8 |
0.5 |
0.3 |
|
Other Receivables |
0.9 |
0.8 |
0.9 |
0.8 |
0.2 |
|
Total Receivables, Net |
1.9 |
1.8 |
1.7 |
1.3 |
0.5 |
|
Inventories - Finished Goods |
1.7 |
2.0 |
1.0 |
0.5 |
0.4 |
|
Inventories - Work In Progress |
0.4 |
0.4 |
0.3 |
0.3 |
0.2 |
|
Inventories - Raw Materials |
9.6 |
7.9 |
6.0 |
8.2 |
8.0 |
|
Inventories - Other |
0.3 |
0.2 |
0.2 |
0.2 |
0.2 |
|
Total Inventory |
11.9 |
10.5 |
7.5 |
9.2 |
8.9 |
|
Prepaid Expenses |
- |
- |
- |
0.0 |
0.0 |
|
Other Current Assets |
1.5 |
1.9 |
0.2 |
0.2 |
0.9 |
|
Other Current Assets, Total |
1.5 |
1.9 |
0.2 |
0.2 |
0.9 |
|
Total Current Assets |
16.8 |
15.8 |
12.1 |
13.5 |
15.8 |
|
|
|
|
|
|
|
|
Buildings |
4.2 |
5.0 |
5.5 |
5.3 |
4.3 |
|
Land/Improvements |
0.1 |
0.2 |
0.2 |
0.2 |
0.2 |
|
Machinery/Equipment |
24.8 |
28.4 |
29.9 |
27.6 |
21.3 |
|
Construction in
Progress |
0.0 |
0.0 |
0.0 |
0.0 |
0.0 |
|
Leases |
0.2 |
0.2 |
0.2 |
1.6 |
1.3 |
|
Property/Plant/Equipment - Gross |
29.3 |
33.7 |
35.8 |
34.8 |
27.2 |
|
Accumulated Depreciation |
-14.4 |
-16.1 |
-17.2 |
-16.1 |
-15.2 |
|
Property/Plant/Equipment - Net |
15.0 |
17.6 |
18.6 |
18.7 |
11.9 |
|
LT Investments - Other |
0.0 |
0.0 |
0.0 |
0.0 |
0.4 |
|
Long Term Investments |
0.0 |
0.0 |
0.0 |
0.0 |
0.4 |
|
Note Receivable - Long Term |
0.1 |
0.1 |
0.1 |
0.1 |
0.1 |
|
Total Assets |
31.8 |
33.4 |
30.8 |
32.4 |
28.3 |
|
|
|
|
|
|
|
|
Accounts Payable |
3.4 |
1.9 |
1.9 |
3.0 |
3.1 |
|
Accrued Expenses |
1.1 |
0.8 |
1.0 |
1.0 |
0.7 |
|
Notes Payable/Short Term Debt |
10.7 |
11.2 |
8.1 |
8.4 |
10.2 |
|
Current Portion - Long Term Debt/Capital Leases |
1.0 |
1.2 |
0.7 |
1.2 |
1.6 |
|
Dividends Payable |
0.0 |
0.0 |
0.0 |
0.0 |
0.0 |
|
Income Taxes Payable |
0.0 |
0.0 |
0.0 |
0.0 |
0.2 |
|
Other Current Liabilities |
0.3 |
0.4 |
0.4 |
0.3 |
0.3 |
|
Other Current liabilities, Total |
0.3 |
0.4 |
0.4 |
0.3 |
0.5 |
|
Total Current Liabilities |
16.6 |
15.4 |
12.0 |
13.9 |
16.1 |
|
|
|
|
|
|
|
|
Long Term Debt |
11.5 |
10.2 |
11.1 |
10.6 |
19.7 |
|
Capital Lease Obligations |
0.4 |
0.9 |
0.1 |
0.5 |
0.5 |
|
Total Long Term Debt |
11.9 |
11.1 |
11.1 |
11.1 |
20.3 |
|
Total Debt |
23.6 |
23.5 |
19.9 |
20.7 |
32.0 |
|
|
|
|
|
|
|
|
Other Long Term Liabilities |
0.4 |
0.5 |
0.5 |
0.5 |
0.5 |
|
Other Liabilities, Total |
0.4 |
0.5 |
0.5 |
0.5 |
0.5 |
|
Total Liabilities |
28.9 |
26.9 |
23.7 |
25.5 |
36.8 |
|
|
|
|
|
|
|
|
Common Stock |
16.0 |
19.0 |
21.5 |
21.6 |
6.6 |
|
Common Stock |
16.0 |
19.0 |
21.5 |
21.6 |
6.6 |
|
Retained Earnings (Accumulated Deficit) |
-13.0 |
-12.5 |
-14.4 |
-14.7 |
-15.1 |
|
Unrealized Gain (Loss) |
0.0 |
0.0 |
0.0 |
- |
- |
|
Total Equity |
2.9 |
6.5 |
7.1 |
6.9 |
-8.5 |
|
|
|
|
|
|
|
|
Total Liabilities & Shareholders’ Equity |
31.8 |
33.4 |
30.8 |
32.4 |
28.3 |
|
|
|
|
|
|
|
|
Shares Outstanding - Common Stock Primary
Issue |
130.0 |
130.0 |
130.0 |
130.0 |
39.5 |
|
Total Common Shares Outstanding |
130.0 |
130.0 |
130.0 |
130.0 |
39.5 |
|
Employees |
2,591 |
2,684 |
3,014 |
2,828 |
2,301 |
|
Number of Common Shareholders |
550 |
550 |
564 |
590 |
622 |
|
Interest Costs |
-0.1 |
-0.2 |
0.0 |
-0.1 |
- |
|
Total Capital Leases, Supplemental |
0.8 |
1.3 |
0.1 |
0.9 |
- |
|
Capital Lease Payments Due in Year 1 |
0.0 |
0.5 |
0.0 |
0.4 |
- |
|
Capital Lease Payments Due in Year 2 |
0.5 |
0.5 |
0.1 |
0.4 |
- |
|
Capital Lease Payments Due in Year 3 |
0.4 |
0.4 |
0.0 |
0.2 |
- |
|
Capital Lease Payments Due in Year 4 |
0.0 |
0.0 |
0.0 |
0.0 |
- |
|
Capital Lease Payments Due in Year 5 |
- |
- |
0.0 |
0.0 |
- |
|
Capital Lease Payments Due in 2-3 Years |
0.9 |
1.0 |
0.1 |
0.5 |
- |
|
Capital Lease Payments Due in 4-5 Years |
0.0 |
0.0 |
0.0 |
0.0 |
- |
|
Discount Rate - Domestic |
12.00% |
12.00% |
10.00% |
- |
- |
|
Compensation Rate - Domestic |
11.00% |
11.00% |
9.00% |
- |
- |
|
Accrued Liabilities - Domestic |
-0.4 |
-0.5 |
-0.5 |
- |
- |
|
Net Assets Recognized on Balance Sheet |
-0.4 |
-0.5 |
-0.5 |
- |
- |
|
|
|
Annual Cash
Flows |
|
Financials in:
USD (mil) |
|
|
30-Jun-2009 |
30-Jun-2008 |
30-Jun-2007 |
30-Jun-2006 |
30-Jun-2005 |
|
Period Length |
12 Months |
12 Months |
12 Months |
12 Months |
9 Months |
|
UpdateType/Date |
Updated Normal |
Updated Normal |
Reclassified
Normal |
Updated Normal |
Updated Normal |
|
Filed Currency |
PKR |
PKR |
PKR |
PKR |
PKR |
|
Exchange Rate
(Period Average) |
78.573941 |
62.550956 |
60.637036 |
59.865977 |
59.345369 |
|
Auditor |
Hameed Khan
& Co. |
Hameed Khan
& Co. |
Hameed Khan
& Co. |
Hameed Khan
& Co. |
Hameed Khan
& Co. |
|
Auditor Opinion |
Unqualified |
Unqualified |
Unqualified |
Unqualified |
Unqualified |
|
|
|
|
|
|
|
|
Net Income/Starting Line |
-2.4 |
0.4 |
0.6 |
0.6 |
1.1 |
|
Depreciation |
0.8 |
1.0 |
1.0 |
1.2 |
0.9 |
|
Depreciation/Depletion |
0.8 |
1.0 |
1.0 |
1.2 |
0.9 |
|
Unusual Items |
0.0 |
0.0 |
0.0 |
-0.3 |
-0.6 |
|
Other Non-Cash Items |
3.6 |
2.1 |
1.5 |
2.2 |
1.2 |
|
Non-Cash Items |
3.6 |
2.1 |
1.5 |
1.9 |
0.5 |
|
Accounts Receivable |
-0.3 |
-0.3 |
-0.3 |
-0.2 |
0.1 |
|
Inventories |
-3.3 |
-4.2 |
1.6 |
-0.4 |
1.2 |
|
Other Assets |
-0.1 |
-1.1 |
0.2 |
2.3 |
-1.7 |
|
Accounts Payable |
2.0 |
0.3 |
-1.0 |
0.0 |
0.3 |
|
Other Liabilities |
- |
- |
- |
- |
0.0 |
|
Other Operating Cash Flow |
-3.6 |
-2.5 |
-2.5 |
-2.4 |
-1.3 |
|
Changes in Working Capital |
-5.1 |
-7.9 |
-1.9 |
-0.6 |
-1.4 |
|
Cash from Operating Activities |
-3.2 |
-4.4 |
1.2 |
3.0 |
1.1 |
|
|
|
|
|
|
|
|
Purchase of Fixed Assets |
-1.1 |
-2.3 |
-1.0 |
-8.8 |
-0.4 |
|
Capital Expenditures |
-1.1 |
-2.3 |
-1.0 |
-8.8 |
-0.4 |
|
Sale of Fixed Assets |
0.0 |
0.0 |
0.0 |
0.7 |
0.1 |
|
Sale/Maturity of Investment |
- |
- |
- |
0.4 |
0.7 |
|
Other Investing Cash Flow |
0.0 |
0.1 |
0.1 |
0.1 |
0.0 |
|
Other Investing Cash Flow Items, Total |
0.1 |
0.1 |
0.1 |
1.2 |
0.9 |
|
Cash from Investing Activities |
-1.0 |
-2.1 |
-0.9 |
-7.6 |
0.5 |
|
|
|
|
|
|
|
|
Cash Dividends Paid - Common |
- |
0.0 |
0.0 |
0.0 |
- |
|
Total Cash Dividends Paid |
- |
0.0 |
0.0 |
0.0 |
- |
|
Sale/Issuance of
Common |
- |
- |
- |
15.1 |
0.0 |
|
Common Stock, Net |
- |
- |
- |
15.1 |
0.0 |
|
Issuance (Retirement) of Stock, Net |
- |
- |
- |
15.1 |
0.0 |
|
Short Term Debt, Net |
1.3 |
4.4 |
-0.3 |
-1.7 |
-0.9 |
|
Long Term Debt, Net |
2.8 |
2.0 |
-0.4 |
-9.4 |
-0.7 |
|
Issuance (Retirement) of Debt, Net |
4.1 |
6.4 |
-0.7 |
-11.0 |
-1.6 |
|
Cash from Financing Activities |
4.1 |
6.4 |
-0.8 |
4.1 |
-1.6 |
|
|
|
|
|
|
|
|
Net Change in Cash |
-0.1 |
-0.1 |
-0.4 |
-0.5 |
0.0 |
|
|
|
|
|
|
|
|
Net Cash - Beginning Balance |
0.1 |
0.2 |
0.6 |
3.3 |
3.4 |
|
Net Cash - Ending Balance |
0.0 |
0.1 |
0.2 |
2.8 |
3.3 |
|
Cash Interest Paid |
3.2 |
2.1 |
1.9 |
1.9 |
- |
|
Cash Taxes Paid |
0.3 |
0.2 |
0.3 |
0.4 |
- |
|
|
|
|
Financials in: USD (mil) |
|
|
Except for share items (millions) and per
share items (actual units) |
|
|
|
|
|
|
|
|
|
|
|
|
30-Jun-2009 |
30-Jun-2008 |
30-Jun-2007 |
30-Jun-2006 |
30-Jun-2005 |
|
Period Length |
12 Months |
12 Months |
12 Months |
12 Months |
9 Months |
|
UpdateType/Date |
Updated Normal |
Updated Normal |
Updated Normal |
Updated Normal |
Updated Normal |
|
Filed Currency |
PKR |
PKR |
PKR |
PKR |
PKR |
|
Exchange Rate
(Period Average) |
78.573941 |
62.550956 |
60.637036 |
59.865977 |
59.345369 |
|
Auditor |
Hameed Khan
& Co. |
Hameed Khan
& Co. |
Hameed Khan
& Co. |
Hameed Khan
& Co. |
Hameed Khan
& Co. |
|
Auditor Opinion |
Unqualified |
Unqualified |
Unqualified |
Unqualified |
Unqualified |
|
|
|
|
|
|
|
|
Local Sales |
22.8 |
25.6 |
20.0 |
11.5 |
- |
|
Export Sales |
13.9 |
14.6 |
19.8 |
24.4 |
- |
|
Sales Tax |
- |
- |
0.0 |
0.0 |
- |
|
Commission |
- |
- |
0.0 |
-0.1 |
- |
|
Sales |
- |
- |
- |
- |
24.5 |
|
Total Revenue |
36.7 |
40.2 |
39.9 |
35.9 |
24.5 |
|
|
|
|
|
|
|
|
Cost of Goods Sold |
33.7 |
35.9 |
35.5 |
31.9 |
21.8 |
|
Selling/Distribution Cost |
0.9 |
0.9 |
0.9 |
0.8 |
0.6 |
|
Administrative |
1.1 |
1.2 |
1.1 |
0.9 |
0.6 |
|
Operating Expenses |
0.0 |
0.0 |
0.0 |
0.1 |
0.1 |
|
Other Income |
-0.1 |
-0.1 |
-0.1 |
-0.4 |
-0.7 |
|
Gain on Sale of Fixed Asset |
0.0 |
0.0 |
0.0 |
- |
- |
|
Profit on Sale of Raw Material |
0.0 |
0.0 |
0.0 |
- |
- |
|
Total Operating Expense |
35.7 |
37.8 |
37.4 |
33.2 |
22.4 |
|
|
|
|
|
|
|
|
Interest Expense |
-3.0 |
-1.6 |
-1.6 |
-2.0 |
-1.1 |
|
Bank Charges and Commissions |
-0.4 |
-0.2 |
-0.2 |
- |
- |
|
Inland Letters of Credit Charges |
-0.1 |
-0.1 |
-0.1 |
- |
- |
|
Net Income Before Taxes |
-2.4 |
0.4 |
0.6 |
0.6 |
1.1 |
|
|
|
|
|
|
|
|
Provision for Income Taxes |
0.1 |
0.2 |
0.3 |
0.1 |
0.6 |
|
Net Income After Taxes |
-2.6 |
0.2 |
0.3 |
0.5 |
0.4 |
|
|
|
|
|
|
|
|
Net Income Before Extra. Items |
-2.6 |
0.2 |
0.3 |
0.5 |
0.4 |
|
Net Income |
-2.6 |
0.2 |
0.3 |
0.5 |
0.4 |
|
|
|
|
|
|
|
|
Income Available to Com Excl ExtraOrd |
-2.6 |
0.2 |
0.3 |
0.5 |
0.4 |
|
|
|
|
|
|
|
|
Income Available to Com Incl ExtraOrd |
-2.6 |
0.2 |
0.3 |
0.5 |
0.4 |
|
|
|
|
|
|
|
|
Basic Weighted Average Shares |
130.0 |
130.0 |
130.0 |
130.0 |
39.5 |
|
Basic EPS Excluding ExtraOrdinary Items |
-0.02 |
0.00 |
0.00 |
0.00 |
0.01 |
|
Basic EPS Including ExtraOrdinary Item |
-0.02 |
0.00 |
0.00 |
0.00 |
0.01 |
|
Dilution Adjustment |
0.0 |
0.0 |
0.0 |
- |
- |
|
Diluted Net Income |
-2.6 |
0.2 |
0.3 |
0.5 |
0.4 |
|
Diluted Weighted Average Shares |
130.0 |
130.0 |
130.0 |
130.0 |
39.5 |
|
Diluted EPS Excluding ExtraOrd Items |
-0.02 |
0.00 |
0.00 |
0.00 |
0.01 |
|
Diluted EPS Including ExtraOrd Items |
-0.02 |
0.00 |
0.00 |
0.00 |
0.01 |
|
DPS-Ordinary Shares |
0.00 |
0.00 |
0.00 |
0.01 |
0.00 |
|
Gross Dividends - Common Stock |
0.0 |
0.0 |
0.0 |
- |
0.0 |
|
Normalized Income Before Taxes |
-2.4 |
0.4 |
0.6 |
0.6 |
1.1 |
|
|
|
|
|
|
|
|
Inc Tax Ex Impact of Sp Items |
0.1 |
0.2 |
0.3 |
0.1 |
0.6 |
|
Normalized Income After Taxes |
-2.6 |
0.2 |
0.3 |
0.5 |
0.4 |
|
|
|
|
|
|
|
|
Normalized Inc. Avail to Com. |
-2.6 |
0.2 |
0.3 |
0.5 |
0.4 |
|
|
|
|
|
|
|
|
Basic Normalized EPS |
-0.02 |
0.00 |
0.00 |
0.00 |
0.01 |
|
Diluted Normalized EPS |
-0.02 |
0.00 |
0.00 |
0.00 |
0.01 |
|
Interest Expense |
3.0 |
1.6 |
1.6 |
2.0 |
1.1 |
|
Depreciation |
0.9 |
1.0 |
1.0 |
1.2 |
0.9 |
|
Advertising Expenses |
0.0 |
0.0 |
0.0 |
0.0 |
0.0 |
|
Rental Expense |
0.0 |
0.0 |
0.0 |
0.0 |
0.0 |
|
Service Cost |
0.1 |
0.2 |
0.2 |
- |
- |
|
Interest Cost |
0.0 |
0.0 |
0.0 |
- |
- |
|
Domestic Pension Plan Expense |
0.1 |
0.2 |
0.2 |
- |
- |
|
Gratuity |
0.1 |
0.2 |
0.1 |
- |
- |
|
Total Pension Expense |
0.2 |
0.4 |
0.4 |
- |
- |
|
Discount Rate |
12.00% |
12.00% |
10.00% |
- |
- |
|
Expected Rate of Increase in Salary |
11.00% |
11.00% |
9.00% |
- |
- |
|
|
|
Annual Balance
Sheet |
|
Financials in:
USD (mil) |
|
|
|
|
|
30-Jun-2009 |
30-Jun-2008 |
30-Jun-2007 |
30-Jun-2006 |
30-Jun-2005 |
|
UpdateType/Date |
Updated Normal |
Reclassified
Normal |
Updated Normal |
Updated Normal |
Updated Normal |
|
Filed Currency |
PKR |
PKR |
PKR |
PKR |
PKR |
|
Exchange Rate |
81.44 |
68.45 |
60.47 |
60.21 |
59.61 |
|
Auditor |
Hameed Khan
& Co. |
Hameed Khan
& Co. |
Hameed Khan
& Co. |
Hameed Khan
& Co. |
Hameed Khan
& Co. |
|
Auditor Opinion |
Unqualified |
Unqualified |
Unqualified |
Unqualified |
Unqualified |
|
|
|
|
|
|
|
|
Stores |
0.0 |
0.1 |
0.0 |
0.0 |
0.0 |
|
Spares |
0.2 |
0.1 |
0.1 |
0.1 |
0.1 |
|
Raw Material |
9.6 |
7.9 |
6.0 |
8.2 |
8.0 |
|
Work in Progress |
0.4 |
0.4 |
0.3 |
0.3 |
0.2 |
|
Finished Goods |
1.7 |
2.0 |
1.0 |
0.5 |
0.4 |
|
Waste |
0.0 |
0.0 |
0.0 |
0.0 |
0.0 |
|
Trade Debts |
1.1 |
1.0 |
0.8 |
0.5 |
0.3 |
|
Advances and Loans |
1.5 |
1.9 |
0.2 |
0.2 |
0.9 |
|
Deposits |
0.5 |
0.1 |
0.4 |
0.1 |
2.2 |
|
Prepayments |
- |
- |
- |
0.0 |
0.0 |
|
Other Receivable |
0.9 |
0.8 |
0.9 |
0.8 |
0.2 |
|
Short Term Investments |
0.9 |
1.5 |
2.2 |
- |
- |
|
Cash in Hand |
0.0 |
0.0 |
0.0 |
0.0 |
- |
|
Cash/Bank |
0.0 |
0.1 |
0.2 |
2.8 |
3.3 |
|
Total Current Assets |
16.8 |
15.8 |
12.1 |
13.5 |
15.8 |
|
|
|
|
|
|
|
|
Freehold Land |
0.1 |
0.2 |
0.2 |
0.2 |
0.2 |
|
Office Building |
0.0 |
0.0 |
0.1 |
0.1 |
0.1 |
|
Factory Building |
3.4 |
4.0 |
4.4 |
4.3 |
3.4 |
|
Colony Building |
0.8 |
0.9 |
1.0 |
0.9 |
0.8 |
|
Plant/Machinery |
22.5 |
25.7 |
28.5 |
26.2 |
20.3 |
|
Tube Wells |
0.0 |
0.0 |
0.0 |
0.0 |
0.0 |
|
Electric Install |
0.6 |
0.7 |
0.7 |
0.7 |
0.5 |
|
Tools/Equipment |
0.1 |
0.1 |
0.1 |
0.1 |
0.1 |
|
Telephone Inst. |
0.0 |
0.0 |
0.0 |
0.0 |
0.0 |
|
Office Equipment |
0.1 |
0.1 |
0.1 |
0.1 |
0.1 |
|
Furn./Fixtures |
0.1 |
0.1 |
0.1 |
0.1 |
0.1 |
|
Computer Software |
0.0 |
0.0 |
0.0 |
0.0 |
0.0 |
|
Vehicles |
0.3 |
0.3 |
0.4 |
0.3 |
0.3 |
|
Power House Machinery |
1.1 |
1.3 |
0.0 |
- |
- |
|
Finance Lease |
0.2 |
0.2 |
0.2 |
1.6 |
1.3 |
|
Fuel Tank - Power House |
- |
- |
- |
0.0 |
0.0 |
|
Depreciation |
-14.4 |
-16.1 |
-17.2 |
-16.1 |
-15.2 |
|
Capital Work in Progress |
0.0 |
0.0 |
0.0 |
0.0 |
0.0 |
|
LT Loans |
0.0 |
0.0 |
0.1 |
0.1 |
0.1 |
|
LT Deposits |
0.0 |
0.0 |
0.0 |
0.1 |
0.1 |
|
LT Investments |
0.0 |
0.0 |
0.0 |
0.0 |
0.4 |
|
Total Assets |
31.8 |
33.4 |
30.8 |
32.4 |
28.3 |
|
|
|
|
|
|
|
|
Sec. Creditors |
1.2 |
0.5 |
0.6 |
0.6 |
0.7 |
|
Unsec Creditors |
2.2 |
1.4 |
1.3 |
2.4 |
2.4 |
|
Unsec. Accrued |
0.6 |
0.6 |
0.6 |
0.6 |
0.4 |
|
Unclaimed Div. |
0.0 |
0.0 |
0.0 |
0.0 |
0.0 |
|
Workers Partic. |
0.3 |
0.4 |
0.4 |
0.3 |
0.2 |
|
Other Liabs. |
0.0 |
0.0 |
0.0 |
0.0 |
0.0 |
|
Accrued Interest on Loans and Borrowings |
0.5 |
0.2 |
0.4 |
0.4 |
0.3 |
|
ST Borrowings-Banking |
10.7 |
11.1 |
8.1 |
8.4 |
10.2 |
|
ST Borrowings-Related Parties |
0.0 |
0.1 |
0.0 |
- |
- |
|
Cur Por LT Liabs |
0.6 |
0.8 |
0.6 |
1.2 |
1.6 |
|
Finance Lease |
0.4 |
0.4 |
0.1 |
- |
- |
|
Tax Provision |
0.0 |
0.0 |
0.0 |
0.0 |
0.2 |
|
Total Current Liabilities |
16.6 |
15.4 |
12.0 |
13.9 |
16.1 |
|
|
|
|
|
|
|
|
Obligations Lease |
0.4 |
0.9 |
0.1 |
0.5 |
0.5 |
|
LT Loan-Banking |
6.7 |
4.4 |
4.5 |
10.6 |
19.7 |
|
LT Loan-Related Parties |
4.9 |
5.8 |
6.6 |
- |
- |
|
Total Long Term Debt |
11.9 |
11.1 |
11.1 |
11.1 |
20.3 |
|
|
|
|
|
|
|
|
Def. Gratuity/Liabilities |
0.4 |
0.5 |
0.5 |
0.5 |
0.5 |
|
Total Liabilities |
28.9 |
26.9 |
23.7 |
25.5 |
36.8 |
|
|
|
|
|
|
|
|
Share Capital |
16.0 |
19.0 |
21.5 |
21.6 |
6.6 |
|
Accumulated |
-13.0 |
-12.5 |
-14.4 |
-14.7 |
-15.1 |
|
Unrealised Gain /Loss on LT Investments |
0.0 |
0.0 |
0.0 |
- |
- |
|
Total Equity |
2.9 |
6.5 |
7.1 |
6.9 |
-8.5 |
|
|
|
|
|
|
|
|
Total Liabilities & Shareholders' Equity |
31.8 |
33.4 |
30.8 |
32.4 |
28.3 |
|
|
|
|
|
|
|
|
S/O-Ordinary Shares |
130.0 |
130.0 |
130.0 |
130.0 |
39.5 |
|
Total Common Shares Outstanding |
130.0 |
130.0 |
130.0 |
130.0 |
39.5 |
|
Full-Time Employees |
2,591 |
2,684 |
3,014 |
2,828 |
2,301 |
|
Number of Common Shareholders |
550 |
550 |
564 |
590 |
622 |
|
Capitla lease Due Within 1 Year |
0.0 |
0.5 |
0.0 |
0.4 |
- |
|
Capitla lease Due Within 2 Year |
0.5 |
0.5 |
0.1 |
0.4 |
- |
|
Capitla lease Due Within 3 Year |
0.4 |
0.4 |
0.0 |
0.2 |
- |
|
Capitla lease Due Within 4 Year |
0.0 |
0.0 |
0.0 |
0.0 |
- |
|
Capitla lease Due Within 5 Year |
- |
- |
0.0 |
0.0 |
- |
|
Financial Charges |
-0.1 |
-0.2 |
0.0 |
-0.1 |
- |
|
Total Capital Leases |
0.8 |
1.3 |
0.1 |
0.9 |
- |
|
Discount Rate |
12.00% |
12.00% |
10.00% |
- |
- |
|
Expected rate |
11.00% |
11.00% |
9.00% |
- |
- |
|
Gratuity |
-0.4 |
-0.5 |
-0.5 |
- |
- |
|
Net Assets Recognized on Balance Sheet |
-0.4 |
-0.5 |
-0.5 |
- |
- |
|
|
|
|
|
Annual Cash
Flows |
|
Financials in:
USD (mil) |
|
|
|
|
|
30-Jun-2009 |
30-Jun-2008 |
30-Jun-2007 |
30-Jun-2006 |
30-Jun-2005 |
|
Period Length |
12 Months |
12 Months |
12 Months |
12 Months |
9 Months |
|
UpdateType/Date |
Updated Normal |
Updated Normal |
Reclassified
Normal |
Updated Normal |
Updated Normal |
|
Filed Currency |
PKR |
PKR |
PKR |
PKR |
PKR |
|
Exchange Rate
(Period Average) |
78.573941 |
62.550956 |
60.637036 |
59.865977 |
59.345369 |
|
Auditor |
Hameed Khan
& Co. |
Hameed Khan
& Co. |
Hameed Khan
& Co. |
Hameed Khan
& Co. |
Hameed Khan
& Co. |
|
Auditor Opinion |
Unqualified |
Unqualified |
Unqualified |
Unqualified |
Unqualified |
|
|
|
|
|
|
|
|
Net Income |
-2.4 |
0.4 |
0.6 |
0.6 |
1.1 |
|
Depreciation |
0.8 |
1.0 |
1.0 |
1.2 |
0.9 |
|
Gratuity |
0.1 |
0.2 |
0.2 |
0.2 |
0.1 |
|
Worker Profit Participation Fund |
0.0 |
0.0 |
0.0 |
0.0 |
0.1 |
|
Dividend Income |
- |
- |
- |
0.0 |
0.0 |
|
Sale of Fixed Assets |
0.0 |
0.0 |
0.0 |
0.0 |
-0.1 |
|
Doubtful Balance Written off |
- |
- |
- |
- |
0.0 |
|
Gain on Sale of Investments |
- |
- |
- |
-0.3 |
-0.5 |
|
Interest Income |
-0.1 |
-0.1 |
-0.1 |
-0.1 |
0.0 |
|
Financial Expenses |
3.5 |
2.0 |
1.9 |
2.0 |
1.1 |
|
Stores/Spares |
-0.1 |
0.0 |
0.0 |
0.0 |
0.0 |
|
Stock in Trade |
-3.2 |
-4.2 |
1.6 |
-0.4 |
1.2 |
|
Machibery Held For Sales |
- |
- |
- |
- |
0.0 |
|
Trade Debts |
-0.3 |
-0.3 |
-0.3 |
-0.2 |
0.1 |
|
Loans and Advances |
0.1 |
-1.9 |
0.0 |
0.3 |
0.4 |
|
Short Term Investments |
0.4 |
0.5 |
0.5 |
- |
- |
|
Adv./Dep./Prepay./Other Receivables |
-0.5 |
0.3 |
-0.3 |
2.0 |
-2.1 |
|
Trade and Other Payable |
2.0 |
0.3 |
-1.0 |
0.0 |
0.3 |
|
Interest Paid |
-3.2 |
-2.1 |
-1.9 |
-1.9 |
-1.0 |
|
Income Tax Paid |
-0.3 |
-0.2 |
-0.3 |
-0.4 |
-0.2 |
|
Gratuity Paid |
-0.1 |
-0.2 |
-0.2 |
-0.1 |
-0.1 |
|
Adjustment |
- |
- |
-0.5 |
- |
- |
|
Cash from Operating Activities |
-3.2 |
-4.4 |
1.2 |
3.0 |
1.1 |
|
|
|
|
|
|
|
|
Capital Expenditure |
-1.1 |
-2.3 |
-1.0 |
-8.8 |
-0.4 |
|
LT Deposits |
0.0 |
0.0 |
0.0 |
0.0 |
0.0 |
|
LT Advances |
0.0 |
0.1 |
0.0 |
0.0 |
0.0 |
|
Sale/Fixed Assets |
0.0 |
0.0 |
0.0 |
0.7 |
0.1 |
|
Proc./LT Deposits/Investments |
- |
- |
- |
0.4 |
0.7 |
|
Dividend Received |
- |
- |
- |
0.0 |
0.0 |
|
Profit received on bank account |
0.0 |
0.1 |
0.1 |
0.1 |
0.0 |
|
Cash from Investing Activities |
-1.0 |
-2.1 |
-0.9 |
-7.6 |
0.5 |
|
|
|
|
|
|
|
|
Share Capital Increase |
- |
- |
- |
15.1 |
0.0 |
|
Payment of Long Term Financing |
3.0 |
0.7 |
0.3 |
-9.2 |
-0.4 |
|
Obligations/Lease |
-0.3 |
1.3 |
-0.8 |
-0.2 |
-0.3 |
|
ST Borrowings |
1.3 |
4.4 |
-0.3 |
-1.7 |
-0.9 |
|
Associated Companies |
- |
- |
- |
- |
0.0 |
|
Dividend |
- |
0.0 |
0.0 |
0.0 |
- |
|
Cash from Financing Activities |
4.1 |
6.4 |
-0.8 |
4.1 |
-1.6 |
|
|
|
|
|
|
|
|
Net Change in Cash |
-0.1 |
-0.1 |
-0.4 |
-0.5 |
0.0 |
|
|
|
|
|
|
|
|
Net Cash - Beginning Balance |
0.1 |
0.2 |
0.6 |
3.3 |
3.4 |
|
Net Cash - Ending Balance |
0.0 |
0.1 |
0.2 |
2.8 |
3.3 |
|
Cash Interest Paid |
3.2 |
2.1 |
1.9 |
1.9 |
- |
|
Cash Taxes Paid |
0.3 |
0.2 |
0.3 |
0.4 |
- |
|
|
|
|
Financials in: USD (mil) |
|
|
Except for share items (millions) and per
share items (actual units) |
|
|
Key Indicators USD (mil) |
||||||
|
|
Quarter |
Quarter |
Annual |
1 Year |
3 Year |
5 Year |
|
Total Revenue1 |
10.2 |
-7.16% |
36.7 |
14.89% |
10.35% |
7.89% |
|
Operating Income1 |
0.4 |
-53.04% |
1.1 |
-43.06% |
-19.20% |
17.12% |
|
Income Available to Common Excl Extraord Items1 |
-0.4 |
- |
-2.6 |
- |
- |
- |
|
Basic EPS Excl Extraord Items1 |
0.00 |
- |
-0.02 |
- |
- |
- |
|
Capital Expenditures2 |
0.1 |
- |
1.1 |
-41.13% |
-45.88% |
-3.44% |
|
Cash from Operating Activities2 |
3.3 |
- |
-3.2 |
- |
- |
- |
|
Free Cash Flow |
3.2 |
- |
-4.1 |
- |
- |
- |
|
Total Assets3 |
28.7 |
4.35% |
31.8 |
13.36% |
9.99% |
8.36% |
|
Total Liabilities3 |
26.2 |
18.26% |
28.9 |
27.58% |
15.29% |
0.78% |
|
Total Long Term Debt3 |
11.8 |
29.88% |
11.9 |
28.34% |
13.27% |
-4.86% |
|
Employees3 |
- |
- |
2591 |
-3.46% |
-2.88% |
3.00% |
|
Total Common Shares Outstanding3 |
130.0 |
0.00% |
130.0 |
0.00% |
0.00% |
26.91% |
|
1-ExchangeRate: PKR to USD Average for Period |
82.619511 |
|
78.573941 |
|
|
|
|
2-ExchangeRate: PKR to USD Average for Period |
82.619511 |
|
78.573941 |
|
|
|
|
3-ExchangeRate: PKR to USD Period End Date |
83.160000 |
|
81.440000 |
|
|
|
|
Key Ratios |
|||||
|
|
30-Jun-2009
|
30-Jun-2008
|
30-Jun-2007
|
30-Jun-2006
|
30-Jun-2005
|
|
Profitability |
|||||
|
Gross Margin |
8.32% |
10.70% |
11.11% |
11.37% |
11.11% |
|
Operating Margin |
2.91% |
5.86% |
6.28% |
7.40% |
8.67% |
|
Pretax Margin |
-6.63% |
0.93% |
1.53% |
1.70% |
4.30% |
|
Net Profit Margin |
-7.01% |
0.42% |
0.83% |
1.38% |
1.74% |
|
Financial Strength |
|||||
|
Current Ratio |
1.02 |
1.02 |
1.01 |
0.98 |
0.98 |
|
Long Term Debt/Equity |
4.05 |
1.71 |
1.56 |
1.62 |
-2.39 |
|
Total Debt/Equity |
8.02 |
3.62 |
2.79 |
3.02 |
-3.79 |
|
Interest Coverage |
1.98 |
6.49 |
9.18 |
- |
- |
|
Management Effectiveness |
|||||
|
Return on Assets |
-8.29% |
0.51% |
1.06% |
1.63% |
1.48% |
|
Return on Equity |
-59.19% |
2.43% |
4.77% |
-65.70% |
-4.91% |
|
Efficiency |
|||||
|
Receivables Turnover |
20.72 |
22.64 |
27.12 |
41.02 |
37.72 |
|
Inventory Turnover |
3.13 |
3.84 |
4.28 |
3.53 |
2.29 |
|
Asset Turnover |
1.18 |
1.21 |
1.27 |
1.18 |
0.85 |
|
Market Valuation USD (mil) |
||||
|
Enterprise Value2 |
20.7 |
. |
Price/Sales (TTM) |
0.05 |
|
Enterprise Value/Revenue (TTM) |
0.61 |
. |
Price/Book (MRQ) |
0.63 |
|
Enterprise Value/EBITDA (TTM) |
15.15 |
. |
Market Cap1 |
1.5 |
|
1-ExchangeRate: PKR to USD on 18-Oct-2011 |
86.695000 |
|
|
|
|
2-ExchangeRate: PKR to USD on 30-Sep-2009 |
83.160000 |
|
|
|
|
|
|
|
Financials in: USD (mil) |
|
|
Except for share items (millions) and per
share items (actual units) |
|
|
|
|
|
|
|||||||||||||||||||||||||||||||||||||||||||||||||||||||||||||||||||||||||||||||||||||||||||||||||||||||||||||||||||||||||||||||||||||||||||||||||||||||||||||||||||||||||||||||||||||||||||||||||||||||||||||||||||||||||||||||||||||||||||||||||||||||||||||||||||
|
|||||||||||||||||||||||||||||||||||||||||||||||||||||||||||||||||||||||||||||||||||||||||||||||||||||||||||||||||||||||||||||||||||||||||||||||||||||||||||||||||||||||||||||||||||||||||||||||||||||||||||||||||||||||||||||||||||||||||||||||||||||||||||||||||||
|
|||||||||||||||||||||||||||||||||||||||||||||||||||||||||||||||||||||||||||||||||||||||||||||||||||||||||||||||||||||||||||||||||||||||||||||||||||||||||||||||||||||||||||||||||||||||||||||||||||||||||||||||||||||||||||||||||||||||||||||||||||||||||||||||||||
|
|
|
|
Financials in: USD (mil) |
|
|
Except for share items (millions) and per
share items (actual units) |
|
|
|
|
|
|
|
|
|
30-Jun-2009 |
30-Jun-2008 |
30-Jun-2007 |
30-Jun-2006 |
30-Jun-2005 |
|
Period Length |
12 Months |
12 Months |
12 Months |
12 Months |
9 Months |
|
UpdateType/Date |
Updated Normal |
Updated Normal |
Updated Normal |
Updated Normal |
Updated Normal |
|
Filed Currency |
PKR |
PKR |
PKR |
PKR |
PKR |
|
Exchange Rate
(Period Average) |
78.573941 |
62.550956 |
60.637036 |
59.865977 |
59.345369 |
|
Auditor |
Hameed Khan
& Co. |
Hameed Khan
& Co. |
Hameed Khan
& Co. |
Hameed Khan
& Co. |
Hameed Khan
& Co. |
|
Auditor Opinion |
Unqualified |
Unqualified |
Unqualified |
Unqualified |
Unqualified |
|
|
|
|
|
|
|
|
Net Sales |
36.7 |
40.2 |
39.9 |
36.0 |
24.5 |
|
Excise Tax Receipts |
- |
- |
0.0 |
0.0 |
- |
|
Revenue |
36.7 |
40.2 |
39.9 |
36.0 |
24.5 |
|
Other Revenue |
- |
- |
0.0 |
-0.1 |
- |
|
Other Revenue, Total |
- |
- |
0.0 |
-0.1 |
- |
|
Total Revenue |
36.7 |
40.2 |
39.9 |
35.9 |
24.5 |
|
|
|
|
|
|
|
|
Cost of Revenue |
33.7 |
35.9 |
35.5 |
31.9 |
21.8 |
|
Cost of Revenue, Total |
33.7 |
35.9 |
35.5 |
31.9 |
21.8 |
|
Gross Profit |
3.1 |
4.3 |
4.4 |
4.1 |
2.7 |
|
|
|
|
|
|
|
|
Selling/General/Administrative Expense |
2.0 |
2.1 |
2.0 |
1.7 |
1.2 |
|
Total Selling/General/Administrative Expenses |
2.0 |
2.1 |
2.0 |
1.7 |
1.2 |
|
Loss (Gain) on Sale of Assets - Operating |
0.0 |
0.0 |
0.0 |
- |
- |
|
Unusual Expense (Income) |
0.0 |
0.0 |
0.0 |
- |
- |
|
Other Operating Expense |
0.0 |
0.0 |
0.0 |
0.1 |
0.1 |
|
Other, Net |
-0.1 |
-0.1 |
-0.1 |
-0.4 |
-0.7 |
|
Other Operating Expenses, Total |
-0.1 |
-0.1 |
-0.1 |
-0.3 |
-0.6 |
|
Total Operating Expense |
35.7 |
37.8 |
37.4 |
33.2 |
22.4 |
|
|
|
|
|
|
|
|
Operating Income |
1.1 |
2.4 |
2.5 |
2.7 |
2.1 |
|
|
|
|
|
|
|
|
Interest Expense -
Non-Operating |
-3.0 |
-1.6 |
-1.6 |
-2.0 |
-1.1 |
|
Interest Expense, Net Non-Operating |
-3.0 |
-1.6 |
-1.6 |
-2.0 |
-1.1 |
|
Interest Income (Expense) - Net Non-Operating |
-0.5 |
-0.4 |
-0.3 |
- |
- |
|
Interest Income (Expense) - Net Non-Operating Total |
-3.5 |
-2.0 |
-1.9 |
-2.0 |
-1.1 |
|
Income Before Tax |
-2.4 |
0.4 |
0.6 |
0.6 |
1.1 |
|
|
|
|
|
|
|
|
Total Income Tax |
0.1 |
0.2 |
0.3 |
0.1 |
0.6 |
|
Income After Tax |
-2.6 |
0.2 |
0.3 |
0.5 |
0.4 |
|
|
|
|
|
|
|
|
Net Income Before Extraord Items |
-2.6 |
0.2 |
0.3 |
0.5 |
0.4 |
|
Net Income |
-2.6 |
0.2 |
0.3 |
0.5 |
0.4 |
|
|
|
|
|
|
|
|
Income Available to Common Excl Extraord Items |
-2.6 |
0.2 |
0.3 |
0.5 |
0.4 |
|
|
|
|
|
|
|
|
Income Available to Common Incl Extraord Items |
-2.6 |
0.2 |
0.3 |
0.5 |
0.4 |
|
|
|
|
|
|
|
|
Basic/Primary Weighted Average Shares |
130.0 |
130.0 |
130.0 |
130.0 |
39.5 |
|
Basic EPS Excl Extraord Items |
-0.02 |
0.00 |
0.00 |
0.00 |
0.01 |
|
Basic/Primary EPS Incl Extraord Items |
-0.02 |
0.00 |
0.00 |
0.00 |
0.01 |
|
Dilution Adjustment |
0.0 |
0.0 |
0.0 |
- |
- |
|
Diluted Net Income |
-2.6 |
0.2 |
0.3 |
0.5 |
0.4 |
|
Diluted Weighted Average Shares |
130.0 |
130.0 |
130.0 |
130.0 |
39.5 |
|
Diluted EPS Excl Extraord Items |
-0.02 |
0.00 |
0.00 |
0.00 |
0.01 |
|
Diluted EPS Incl Extraord Items |
-0.02 |
0.00 |
0.00 |
0.00 |
0.01 |
|
Dividends per Share - Common Stock Primary Issue |
0.00 |
0.00 |
0.00 |
0.01 |
0.00 |
|
Gross Dividends - Common Stock |
0.0 |
0.0 |
0.0 |
- |
0.0 |
|
Interest Expense, Supplemental |
3.0 |
1.6 |
1.6 |
2.0 |
1.1 |
|
Depreciation, Supplemental |
0.9 |
1.0 |
1.0 |
1.2 |
0.9 |
|
Total Special Items |
0.0 |
0.0 |
0.0 |
- |
- |
|
Normalized Income Before Tax |
-2.4 |
0.4 |
0.6 |
0.6 |
1.1 |
|
|
|
|
|
|
|
|
Effect of Special Items on Income Taxes |
0.0 |
0.0 |
0.0 |
- |
- |
|
Inc Tax Ex Impact of Sp Items |
0.1 |
0.2 |
0.3 |
0.1 |
0.6 |
|
Normalized Income After Tax |
-2.6 |
0.2 |
0.3 |
0.5 |
0.4 |
|
|
|
|
|
|
|
|
Normalized Inc. Avail to Com. |
-2.6 |
0.2 |
0.3 |
0.5 |
0.4 |
|
|
|
|
|
|
|
|
Basic Normalized EPS |
-0.02 |
0.00 |
0.00 |
0.00 |
0.01 |
|
Diluted Normalized EPS |
-0.02 |
0.00 |
0.00 |
0.00 |
0.01 |
|
Rental Expenses |
0.0 |
0.0 |
0.0 |
0.0 |
0.0 |
|
Advertising Expense, Supplemental |
0.0 |
0.0 |
0.0 |
0.0 |
0.0 |
|
Normalized EBIT |
1.1 |
2.3 |
2.5 |
2.7 |
2.1 |
|
Normalized EBITDA |
1.9 |
3.3 |
3.5 |
3.8 |
3.0 |
|
Interest Cost - Domestic |
0.0 |
0.0 |
0.0 |
- |
- |
|
Service Cost - Domestic |
0.1 |
0.2 |
0.2 |
- |
- |
|
Domestic Pension Plan Expense |
0.1 |
0.2 |
0.2 |
- |
- |
|
Defined Contribution Expense - Domestic |
0.1 |
0.2 |
0.1 |
- |
- |
|
Total Pension Expense |
0.2 |
0.4 |
0.4 |
- |
- |
|
Discount Rate - Domestic |
12.00% |
12.00% |
10.00% |
- |
- |
|
Compensation Rate - Domestic |
11.00% |
11.00% |
9.00% |
- |
- |
|
Total Plan Interest Cost |
0.0 |
0.0 |
0.0 |
- |
- |
|
Total Plan Service Cost |
0.1 |
0.2 |
0.2 |
- |
- |
|
|
|
|
Financials in: USD (mil) |
|
|
Except for share items (millions) and per
share items (actual units) |
|
|
|
|
|
|
|
|
|
30-Sep-2009 |
30-Jun-2009 |
31-Mar-2009 |
31-Dec-2008 |
30-Sep-2008 |
|
Period Length |
3 Months |
3 Months |
3 Months |
3 Months |
3 Months |
|
UpdateType/Date |
Updated Normal |
Updated Normal |
Updated Normal |
Updated Normal |
Updated Normal |
|
Filed Currency |
PKR |
PKR |
PKR |
PKR |
PKR |
|
Exchange Rate
(Period Average) |
82.619511 |
80.751022 |
79.729396 |
79.797043 |
74.087124 |
|
|
|
|
|
|
|
|
Net Sales |
10.2 |
9.2 |
7.3 |
8.2 |
12.2 |
|
Revenue |
10.2 |
9.2 |
7.3 |
8.2 |
12.2 |
|
Total Revenue |
10.2 |
9.2 |
7.3 |
8.2 |
12.2 |
|
|
|
|
|
|
|
|
Cost of Revenue |
9.4 |
8.8 |
6.8 |
7.4 |
10.8 |
|
Cost of Revenue, Total |
9.4 |
8.8 |
6.8 |
7.4 |
10.8 |
|
Gross Profit |
0.8 |
0.4 |
0.5 |
0.8 |
1.4 |
|
|
|
|
|
|
|
|
Selling/General/Administrative Expense |
0.4 |
0.9 |
0.4 |
0.3 |
0.5 |
|
Total Selling/General/Administrative Expenses |
0.4 |
0.9 |
0.4 |
0.3 |
0.5 |
|
Other Operating Expense |
- |
0.0 |
- |
- |
- |
|
Other, Net |
0.0 |
0.0 |
0.0 |
0.0 |
0.0 |
|
Other Operating Expenses, Total |
0.0 |
0.0 |
0.0 |
0.0 |
0.0 |
|
Total Operating Expense |
9.7 |
9.7 |
7.2 |
7.7 |
11.2 |
|
|
|
|
|
|
|
|
Operating Income |
0.4 |
-0.4 |
0.1 |
0.5 |
1.0 |
|
|
|
|
|
|
|
|
Interest Income (Expense) - Net Non-Operating |
-0.7 |
-1.3 |
-0.6 |
-0.8 |
-0.9 |
|
Interest Income (Expense) - Net Non-Operating Total |
-0.7 |
-1.3 |
-0.6 |
-0.8 |
-0.9 |
|
Income Before Tax |
-0.3 |
-1.7 |
-0.5 |
-0.3 |
0.1 |
|
|
|
|
|
|
|
|
Total Income Tax |
0.1 |
0.0 |
0.0 |
0.0 |
0.1 |
|
Income After Tax |
-0.4 |
-1.7 |
-0.5 |
-0.3 |
0.0 |
|
|
|
|
|
|
|
|
Net Income Before Extraord Items |
-0.4 |
-1.7 |
-0.5 |
-0.3 |
0.0 |
|
Net Income |
-0.4 |
-1.7 |
-0.5 |
-0.3 |
0.0 |
|
|
|
|
|
|
|
|
Income Available to Common Excl Extraord Items |
-0.4 |
-1.7 |
-0.5 |
-0.3 |
0.0 |
|
|
|
|
|
|
|
|
Income Available to Common Incl Extraord Items |
-0.4 |
-1.7 |
-0.5 |
-0.3 |
0.0 |
|
|
|
|
|
|
|
|
Basic/Primary Weighted Average Shares |
130.0 |
130.0 |
130.0 |
130.0 |
130.0 |
|
Basic EPS Excl Extraord Items |
0.00 |
-0.01 |
0.00 |
0.00 |
0.00 |
|
Basic/Primary EPS Incl Extraord Items |
0.00 |
-0.01 |
0.00 |
0.00 |
0.00 |
|
Dilution Adjustment |
0.0 |
0.0 |
0.0 |
0.0 |
- |
|
Diluted Net Income |
-0.4 |
-1.7 |
-0.5 |
-0.3 |
0.0 |
|
Diluted Weighted Average Shares |
130.0 |
130.0 |
130.0 |
130.0 |
130.0 |
|
Diluted EPS Excl Extraord Items |
0.00 |
-0.01 |
0.00 |
0.00 |
0.00 |
|
Diluted EPS Incl Extraord Items |
0.00 |
-0.01 |
0.00 |
0.00 |
0.00 |
|
Dividends per Share - Common Stock Primary Issue |
0.00 |
0.00 |
0.00 |
0.00 |
0.00 |
|
Gross Dividends - Common Stock |
0.0 |
0.0 |
0.0 |
0.0 |
0.0 |
|
Depreciation, Supplemental |
0.2 |
0.2 |
0.2 |
0.2 |
0.2 |
|
Normalized Income Before Tax |
-0.3 |
-1.7 |
-0.5 |
-0.3 |
0.1 |
|
|
|
|
|
|
|
|
Inc Tax Ex Impact of Sp Items |
0.1 |
0.0 |
0.0 |
0.0 |
0.1 |
|
Normalized Income After Tax |
-0.4 |
-1.7 |
-0.5 |
-0.3 |
0.0 |
|
|
|
|
|
|
|
|
Normalized Inc. Avail to Com. |
-0.4 |
-1.7 |
-0.5 |
-0.3 |
0.0 |
|
|
|
|
|
|
|
|
Basic Normalized EPS |
0.00 |
-0.01 |
0.00 |
0.00 |
0.00 |
|
Diluted Normalized EPS |
0.00 |
-0.01 |
0.00 |
0.00 |
0.00 |
|
Normalized EBIT |
0.4 |
-0.4 |
0.1 |
0.5 |
1.0 |
|
Normalized EBITDA |
0.6 |
-0.2 |
0.3 |
0.7 |
1.2 |
|
|
|
|
Financials in: USD (mil) |
|
|
Except for share items (millions) and per
share items (actual units) |
|
|
|
|
|
|
|
|
|
30-Jun-2009 |
30-Jun-2008 |
30-Jun-2007 |
30-Jun-2006 |
30-Jun-2005 |
|
UpdateType/Date |
Updated Normal |
Reclassified
Normal |
Updated Normal |
Updated Normal |
Updated Normal |
|
Filed Currency |
PKR |
PKR |
PKR |
PKR |
PKR |
|
Exchange Rate |
81.44 |
68.45 |
60.47 |
60.21 |
59.61 |
|
Auditor |
Hameed Khan
& Co. |
Hameed Khan
& Co. |
Hameed Khan
& Co. |
Hameed Khan
& Co. |
Hameed Khan
& Co. |
|
Auditor Opinion |
Unqualified |
Unqualified |
Unqualified |
Unqualified |
Unqualified |
|
|
|
|
|
|
|
|
Cash |
0.0 |
0.1 |
0.2 |
2.8 |
3.3 |
|
Short Term Investments |
1.4 |
1.5 |
2.5 |
0.1 |
2.2 |
|
Cash and Short Term Investments |
1.4 |
1.7 |
2.7 |
2.9 |
5.5 |
|
Trade Accounts Receivable - Net |
1.1 |
1.0 |
0.8 |
0.5 |
0.3 |
|
Other Receivables |
0.9 |
0.8 |
0.9 |
0.8 |
0.2 |
|
Total Receivables, Net |
1.9 |
1.8 |
1.7 |
1.3 |
0.5 |
|
Inventories - Finished Goods |
1.7 |
2.0 |
1.0 |
0.5 |
0.4 |
|
Inventories - Work In Progress |
0.4 |
0.4 |
0.3 |
0.3 |
0.2 |
|
Inventories - Raw Materials |
9.6 |
7.9 |
6.0 |
8.2 |
8.0 |
|
Inventories - Other |
0.3 |
0.2 |
0.2 |
0.2 |
0.2 |
|
Total Inventory |
11.9 |
10.5 |
7.5 |
9.2 |
8.9 |
|
Prepaid Expenses |
- |
- |
- |
0.0 |
0.0 |
|
Other Current Assets |
1.5 |
1.9 |
0.2 |
0.2 |
0.9 |
|
Other Current Assets, Total |
1.5 |
1.9 |
0.2 |
0.2 |
0.9 |
|
Total Current Assets |
16.8 |
15.8 |
12.1 |
13.5 |
15.8 |
|
|
|
|
|
|
|
|
Buildings |
4.2 |
5.0 |
5.5 |
5.3 |
4.3 |
|
Land/Improvements |
0.1 |
0.2 |
0.2 |
0.2 |
0.2 |
|
Machinery/Equipment |
24.8 |
28.4 |
29.9 |
27.6 |
21.3 |
|
Construction in
Progress |
0.0 |
0.0 |
0.0 |
0.0 |
0.0 |
|
Leases |
0.2 |
0.2 |
0.2 |
1.6 |
1.3 |
|
Property/Plant/Equipment - Gross |
29.3 |
33.7 |
35.8 |
34.8 |
27.2 |
|
Accumulated Depreciation |
-14.4 |
-16.1 |
-17.2 |
-16.1 |
-15.2 |
|
Property/Plant/Equipment - Net |
15.0 |
17.6 |
18.6 |
18.7 |
11.9 |
|
LT Investments - Other |
0.0 |
0.0 |
0.0 |
0.0 |
0.4 |
|
Long Term Investments |
0.0 |
0.0 |
0.0 |
0.0 |
0.4 |
|
Note Receivable - Long Term |
0.1 |
0.1 |
0.1 |
0.1 |
0.1 |
|
Total Assets |
31.8 |
33.4 |
30.8 |
32.4 |
28.3 |
|
|
|
|
|
|
|
|
Accounts Payable |
3.4 |
1.9 |
1.9 |
3.0 |
3.1 |
|
Accrued Expenses |
1.1 |
0.8 |
1.0 |
1.0 |
0.7 |
|
Notes Payable/Short Term Debt |
10.7 |
11.2 |
8.1 |
8.4 |
10.2 |
|
Current Portion - Long Term Debt/Capital Leases |
1.0 |
1.2 |
0.7 |
1.2 |
1.6 |
|
Dividends Payable |
0.0 |
0.0 |
0.0 |
0.0 |
0.0 |
|
Income Taxes Payable |
0.0 |
0.0 |
0.0 |
0.0 |
0.2 |
|
Other Current Liabilities |
0.3 |
0.4 |
0.4 |
0.3 |
0.3 |
|
Other Current liabilities, Total |
0.3 |
0.4 |
0.4 |
0.3 |
0.5 |
|
Total Current Liabilities |
16.6 |
15.4 |
12.0 |
13.9 |
16.1 |
|
|
|
|
|
|
|
|
Long Term Debt |
11.5 |
10.2 |
11.1 |
10.6 |
19.7 |
|
Capital Lease Obligations |
0.4 |
0.9 |
0.1 |
0.5 |
0.5 |
|
Total Long Term Debt |
11.9 |
11.1 |
11.1 |
11.1 |
20.3 |
|
Total Debt |
23.6 |
23.5 |
19.9 |
20.7 |
32.0 |
|
|
|
|
|
|
|
|
Other Long Term Liabilities |
0.4 |
0.5 |
0.5 |
0.5 |
0.5 |
|
Other Liabilities, Total |
0.4 |
0.5 |
0.5 |
0.5 |
0.5 |
|
Total Liabilities |
28.9 |
26.9 |
23.7 |
25.5 |
36.8 |
|
|
|
|
|
|
|
|
Common Stock |
16.0 |
19.0 |
21.5 |
21.6 |
6.6 |
|
Common Stock |
16.0 |
19.0 |
21.5 |
21.6 |
6.6 |
|
Retained Earnings (Accumulated Deficit) |
-13.0 |
-12.5 |
-14.4 |
-14.7 |
-15.1 |
|
Unrealized Gain (Loss) |
0.0 |
0.0 |
0.0 |
- |
- |
|
Total Equity |
2.9 |
6.5 |
7.1 |
6.9 |
-8.5 |
|
|
|
|
|
|
|
|
Total Liabilities & Shareholders’ Equity |
31.8 |
33.4 |
30.8 |
32.4 |
28.3 |
|
|
|
|
|
|
|
|
Shares Outstanding - Common Stock Primary
Issue |
130.0 |
130.0 |
130.0 |
130.0 |
39.5 |
|
Total Common Shares Outstanding |
130.0 |
130.0 |
130.0 |
130.0 |
39.5 |
|
Employees |
2,591 |
2,684 |
3,014 |
2,828 |
2,301 |
|
Number of Common Shareholders |
550 |
550 |
564 |
590 |
622 |
|
Interest Costs |
-0.1 |
-0.2 |
0.0 |
-0.1 |
- |
|
Total Capital Leases, Supplemental |
0.8 |
1.3 |
0.1 |
0.9 |
- |
|
Capital Lease Payments Due in Year 1 |
0.0 |
0.5 |
0.0 |
0.4 |
- |
|
Capital Lease Payments Due in Year 2 |
0.5 |
0.5 |
0.1 |
0.4 |
- |
|
Capital Lease Payments Due in Year 3 |
0.4 |
0.4 |
0.0 |
0.2 |
- |
|
Capital Lease Payments Due in Year 4 |
0.0 |
0.0 |
0.0 |
0.0 |
- |
|
Capital Lease Payments Due in Year 5 |
- |
- |
0.0 |
0.0 |
- |
|
Capital Lease Payments Due in 2-3 Years |
0.9 |
1.0 |
0.1 |
0.5 |
- |
|
Capital Lease Payments Due in 4-5 Years |
0.0 |
0.0 |
0.0 |
0.0 |
- |
|
Discount Rate - Domestic |
12.00% |
12.00% |
10.00% |
- |
- |
|
Compensation Rate - Domestic |
11.00% |
11.00% |
9.00% |
- |
- |
|
Accrued Liabilities - Domestic |
-0.4 |
-0.5 |
-0.5 |
- |
- |
|
Net Assets Recognized on Balance Sheet |
-0.4 |
-0.5 |
-0.5 |
- |
- |
|
|
|
|
Financials in: USD (mil) |
|
|
Except for share items (millions) and per
share items (actual units) |
|
|
|
|
|
|
|
|
|
30-Sep-2009 |
30-Jun-2009 |
31-Mar-2009 |
30-Sep-2008 |
30-Jun-2008 |
|
UpdateType/Date |
Updated Normal |
Updated Normal |
Updated Normal |
Updated Normal |
Reclassified
Normal |
|
Filed Currency |
PKR |
PKR |
PKR |
PKR |
PKR |
|
Exchange Rate |
83.16 |
81.44 |
80.51 |
78.25 |
68.45 |
|
|
|
|
|
|
|
|
Cash |
0.3 |
0.0 |
0.1 |
0.2 |
0.1 |
|
Short Term Investments |
0.8 |
0.9 |
1.0 |
1.2 |
1.5 |
|
Cash and Short Term Investments |
1.0 |
0.9 |
1.1 |
1.3 |
1.6 |
|
Trade Accounts Receivable - Net |
1.5 |
1.1 |
0.7 |
1.6 |
1.0 |
|
Other Receivables |
1.6 |
1.4 |
1.1 |
0.9 |
0.8 |
|
Total Receivables, Net |
3.1 |
2.5 |
1.8 |
2.5 |
1.8 |
|
Inventories - Finished Goods |
1.4 |
1.7 |
1.9 |
2.0 |
2.0 |
|
Inventories - Work In Progress |
0.4 |
0.4 |
0.3 |
0.2 |
0.4 |
|
Inventories - Raw Materials |
6.5 |
9.8 |
12.0 |
6.2 |
8.0 |
|
Inventories - Other |
0.0 |
0.0 |
0.0 |
0.1 |
0.0 |
|
Total Inventory |
8.3 |
11.9 |
14.3 |
8.5 |
10.5 |
|
Other Current Assets |
1.6 |
1.5 |
2.0 |
1.8 |
1.9 |
|
Other Current Assets, Total |
1.6 |
1.5 |
2.0 |
1.8 |
1.9 |
|
Total Current Assets |
14.1 |
16.8 |
19.2 |
14.1 |
15.8 |
|
|
|
|
|
|
|
|
Construction in
Progress |
- |
- |
- |
0.0 |
0.0 |
|
Leases |
1.1 |
1.1 |
1.1 |
1.1 |
1.3 |
|
Property/Plant/Equipment - Gross |
1.1 |
1.1 |
1.1 |
1.1 |
1.3 |
|
Property/Plant/Equipment - Net |
14.5 |
15.0 |
14.7 |
15.3 |
17.6 |
|
LT Investments - Other |
0.0 |
0.0 |
0.0 |
0.0 |
0.0 |
|
Long Term Investments |
0.0 |
0.0 |
0.0 |
0.0 |
0.0 |
|
Note Receivable - Long Term |
0.1 |
0.1 |
0.1 |
0.1 |
0.1 |
|
Total Assets |
28.7 |
31.8 |
34.0 |
29.5 |
33.4 |
|
|
|
|
|
|
|
|
Accounts Payable |
5.2 |
4.3 |
5.0 |
3.5 |
2.8 |
|
Accrued Expenses |
0.5 |
0.5 |
0.2 |
0.2 |
0.2 |
|
Notes Payable/Short Term Debt |
7.5 |
10.7 |
13.3 |
9.3 |
11.2 |
|
Current Portion - Long Term Debt/Capital Leases |
0.8 |
1.0 |
0.8 |
0.8 |
1.2 |
|
Income Taxes Payable |
- |
0.0 |
- |
- |
0.0 |
|
Other Current liabilities, Total |
- |
0.0 |
- |
- |
0.0 |
|
Total Current Liabilities |
14.0 |
16.6 |
19.2 |
13.8 |
15.4 |
|
|
|
|
|
|
|
|
Long Term Debt |
11.5 |
11.5 |
9.3 |
8.9 |
10.2 |
|
Capital Lease Obligations |
0.3 |
0.4 |
0.5 |
0.6 |
0.9 |
|
Total Long Term Debt |
11.8 |
11.9 |
9.7 |
9.6 |
11.1 |
|
Total Debt |
20.1 |
23.6 |
23.7 |
19.6 |
23.5 |
|
|
|
|
|
|
|
|
Other Long Term Liabilities |
0.4 |
0.4 |
0.4 |
0.4 |
0.5 |
|
Other Liabilities, Total |
0.4 |
0.4 |
0.4 |
0.4 |
0.5 |
|
Total Liabilities |
26.2 |
28.9 |
29.3 |
23.8 |
26.9 |
|
|
|
|
|
|
|
|
Common Stock |
15.6 |
16.0 |
16.1 |
16.6 |
19.0 |
|
Common Stock |
15.6 |
16.0 |
16.1 |
16.6 |
19.0 |
|
Retained Earnings (Accumulated Deficit) |
-13.2 |
-13.0 |
-11.4 |
-10.9 |
-12.5 |
|
Unrealized Gain (Loss) |
0.0 |
0.0 |
0.0 |
0.0 |
0.0 |
|
Total Equity |
2.5 |
2.9 |
4.7 |
5.7 |
6.5 |
|
|
|
|
|
|
|
|
Total Liabilities & Shareholders’ Equity |
28.7 |
31.8 |
34.0 |
29.5 |
33.4 |
|
|
|
|
|
|
|
|
Shares Outstanding - Common Stock Primary
Issue |
130.0 |
130.0 |
130.0 |
130.0 |
130.0 |
|
Total Common Shares Outstanding |
130.0 |
130.0 |
130.0 |
130.0 |
130.0 |
|
Accrued Liabilities - Domestic |
-0.4 |
-0.4 |
-0.4 |
-0.4 |
-0.5 |
|
Net Assets Recognized on Balance Sheet |
-0.4 |
-0.4 |
-0.4 |
-0.4 |
-0.5 |
|
|
|
|
Financials in: USD (mil) |
|
|
Except for share items (millions) and per
share items (actual units) |
|
|
|
|
|
|
|
|
|
30-Jun-2009 |
30-Jun-2008 |
30-Jun-2007 |
30-Jun-2006 |
30-Jun-2005 |
|
Period Length |
12 Months |
12 Months |
12 Months |
12 Months |
9 Months |
|
UpdateType/Date |
Updated Normal |
Updated Normal |
Reclassified
Normal |
Updated Normal |
Updated Normal |
|
Filed Currency |
PKR |
PKR |
PKR |
PKR |
PKR |
|
Exchange Rate
(Period Average) |
78.573941 |
62.550956 |
60.637036 |
59.865977 |
59.345369 |
|
Auditor |
Hameed Khan
& Co. |
Hameed Khan
& Co. |
Hameed Khan
& Co. |
Hameed Khan
& Co. |
Hameed Khan
& Co. |
|
Auditor Opinion |
Unqualified |
Unqualified |
Unqualified |
Unqualified |
Unqualified |
|
|
|
|
|
|
|
|
Net Income/Starting Line |
-2.4 |
0.4 |
0.6 |
0.6 |
1.1 |
|
Depreciation |
0.8 |
1.0 |
1.0 |
1.2 |
0.9 |
|
Depreciation/Depletion |
0.8 |
1.0 |
1.0 |
1.2 |
0.9 |
|
Unusual Items |
0.0 |
0.0 |
0.0 |
-0.3 |
-0.6 |
|
Other Non-Cash Items |
3.6 |
2.1 |
1.5 |
2.2 |
1.2 |
|
Non-Cash Items |
3.6 |
2.1 |
1.5 |
1.9 |
0.5 |
|
Accounts Receivable |
-0.3 |
-0.3 |
-0.3 |
-0.2 |
0.1 |
|
Inventories |
-3.3 |
-4.2 |
1.6 |
-0.4 |
1.2 |
|
Other Assets |
-0.1 |
-1.1 |
0.2 |
2.3 |
-1.7 |
|
Accounts Payable |
2.0 |
0.3 |
-1.0 |
0.0 |
0.3 |
|
Other Liabilities |
- |
- |
- |
- |
0.0 |
|
Other Operating Cash Flow |
-3.6 |
-2.5 |
-2.5 |
-2.4 |
-1.3 |
|
Changes in Working Capital |
-5.1 |
-7.9 |
-1.9 |
-0.6 |
-1.4 |
|
Cash from Operating Activities |
-3.2 |
-4.4 |
1.2 |
3.0 |
1.1 |
|
|
|
|
|
|
|
|
Purchase of Fixed Assets |
-1.1 |
-2.3 |
-1.0 |
-8.8 |
-0.4 |
|
Capital Expenditures |
-1.1 |
-2.3 |
-1.0 |
-8.8 |
-0.4 |
|
Sale of Fixed Assets |
0.0 |
0.0 |
0.0 |
0.7 |
0.1 |
|
Sale/Maturity of Investment |
- |
- |
- |
0.4 |
0.7 |
|
Other Investing Cash Flow |
0.0 |
0.1 |
0.1 |
0.1 |
0.0 |
|
Other Investing Cash Flow Items, Total |
0.1 |
0.1 |
0.1 |
1.2 |
0.9 |
|
Cash from Investing Activities |
-1.0 |
-2.1 |
-0.9 |
-7.6 |
0.5 |
|
|
|
|
|
|
|
|
Cash Dividends Paid - Common |
- |
0.0 |
0.0 |
0.0 |
- |
|
Total Cash Dividends Paid |
- |
0.0 |
0.0 |
0.0 |
- |
|
Sale/Issuance of
Common |
- |
- |
- |
15.1 |
0.0 |
|
Common Stock, Net |
- |
- |
- |
15.1 |
0.0 |
|
Issuance (Retirement) of Stock, Net |
- |
- |
- |
15.1 |
0.0 |
|
Short Term Debt, Net |
1.3 |
4.4 |
-0.3 |
-1.7 |
-0.9 |
|
Long Term Debt, Net |
2.8 |
2.0 |
-0.4 |
-9.4 |
-0.7 |
|
Issuance (Retirement) of Debt, Net |
4.1 |
6.4 |
-0.7 |
-11.0 |
-1.6 |
|
Cash from Financing Activities |
4.1 |
6.4 |
-0.8 |
4.1 |
-1.6 |
|
|
|
|
|
|
|
|
Net Change in Cash |
-0.1 |
-0.1 |
-0.4 |
-0.5 |
0.0 |
|
|
|
|
|
|
|
|
Net Cash - Beginning Balance |
0.1 |
0.2 |
0.6 |
3.3 |
3.4 |
|
Net Cash - Ending Balance |
0.0 |
0.1 |
0.2 |
2.8 |
3.3 |
|
Cash Interest Paid |
3.2 |
2.1 |
1.9 |
1.9 |
- |
|
Cash Taxes Paid |
0.3 |
0.2 |
0.3 |
0.4 |
- |
|
|
|
|
Financials in: USD (mil) |
|
|
Except for share items (millions) and per
share items (actual units) |
|
|
|
|
|
|
|
|
|
30-Sep-2009 |
30-Jun-2009 |
31-Mar-2009 |
30-Sep-2008 |
30-Jun-2008 |
|
Period Length |
3 Months |
12 Months |
9 Months |
3 Months |
12 Months |
|
UpdateType/Date |
Updated Normal |
Updated Normal |
Updated Normal |
Updated Normal |
Updated Normal |
|
Filed Currency |
PKR |
PKR |
PKR |
PKR |
PKR |
|
Exchange Rate
(Period Average) |
82.619511 |
78.573941 |
77.851736 |
74.087124 |
62.550956 |
|
|
|
|
|
|
|
|
Net Income/Starting Line |
-0.3 |
-2.4 |
-0.7 |
0.1 |
0.4 |
|
Depreciation |
0.2 |
0.8 |
0.6 |
0.2 |
1.0 |
|
Depreciation/Depletion |
0.2 |
0.8 |
0.6 |
0.2 |
1.0 |
|
Unusual Items |
- |
0.0 |
0.0 |
- |
0.0 |
|
Other Non-Cash Items |
0.8 |
3.6 |
2.3 |
0.9 |
2.1 |
|
Non-Cash Items |
0.8 |
3.6 |
2.3 |
0.9 |
2.1 |
|
Accounts Receivable |
-0.4 |
-0.3 |
0.1 |
-0.8 |
-0.3 |
|
Inventories |
3.4 |
-3.3 |
-5.6 |
0.7 |
-4.2 |
|
Other Assets |
-0.3 |
-0.1 |
-0.5 |
-0.1 |
-1.1 |
|
Accounts Payable |
0.9 |
2.0 |
2.7 |
1.1 |
0.3 |
|
Other Operating Cash Flow |
-0.9 |
-3.6 |
-2.6 |
-0.9 |
-2.5 |
|
Changes in Working Capital |
2.7 |
-5.1 |
-5.9 |
-0.1 |
-7.9 |
|
Cash from Operating Activities |
3.3 |
-3.2 |
-3.7 |
1.1 |
-4.4 |
|
|
|
|
|
|
|
|
Purchase of Fixed Assets |
-0.1 |
-1.1 |
-0.4 |
-0.1 |
-2.3 |
|
Capital Expenditures |
-0.1 |
-1.1 |
-0.4 |
-0.1 |
-2.3 |
|
Sale of Fixed Assets |
- |
0.0 |
0.0 |
- |
0.0 |
|
Other Investing Cash Flow |
0.0 |
0.0 |
0.1 |
0.0 |
0.1 |
|
Other Investing Cash Flow Items, Total |
0.0 |
0.1 |
0.1 |
0.0 |
0.1 |
|
Cash from Investing Activities |
0.0 |
-1.0 |
-0.3 |
-0.1 |
-2.1 |
|
|
|
|
|
|
|
|
Cash Dividends Paid - Common |
- |
- |
- |
- |
0.0 |
|
Total Cash Dividends Paid |
- |
- |
- |
- |
0.0 |
|
Short Term Debt, Net |
-3.0 |
1.3 |
3.8 |
-0.6 |
4.4 |
|
Long Term Debt Issued |
- |
- |
0.3 |
- |
- |
|
Long Term Debt, Net |
0.0 |
2.8 |
0.1 |
-0.3 |
2.0 |
|
Issuance (Retirement) of Debt, Net |
-3.0 |
4.1 |
3.9 |
-0.9 |
6.4 |
|
Cash from Financing Activities |
-3.0 |
4.1 |
3.9 |
-0.9 |
6.4 |
|
|
|
|
|
|
|
|
Net Change in Cash |
0.3 |
-0.1 |
0.0 |
0.0 |
-0.1 |
|
|
|
|
|
|
|
|
Net Cash - Beginning Balance |
0.0 |
0.1 |
0.1 |
0.1 |
0.2 |
|
Net Cash - Ending Balance |
0.3 |
0.0 |
0.1 |
0.2 |
0.1 |
|
Cash Interest Paid |
0.8 |
3.2 |
2.3 |
0.8 |
2.1 |
|
Cash Taxes Paid |
0.1 |
0.3 |
0.2 |
0.1 |
0.2 |
|
|
|
|
Financials in: USD (mil) |
|
|
Except for share items (millions) and per
share items (actual units) |
|
|
|
|
|
|
|
|
|
|
|
|
30-Jun-2009 |
30-Jun-2008 |
30-Jun-2007 |
30-Jun-2006 |
30-Jun-2005 |
|
Period Length |
12 Months |
12 Months |
12 Months |
12 Months |
9 Months |
|
UpdateType/Date |
Updated Normal |
Updated Normal |
Updated Normal |
Updated Normal |
Updated Normal |
|
Filed Currency |
PKR |
PKR |
PKR |
PKR |
PKR |
|
Exchange Rate
(Period Average) |
78.573941 |
62.550956 |
60.637036 |
59.865977 |
59.345369 |
|
Auditor |
Hameed Khan
& Co. |
Hameed Khan
& Co. |
Hameed Khan
& Co. |
Hameed Khan
& Co. |
Hameed Khan
& Co. |
|
Auditor Opinion |
Unqualified |
Unqualified |
Unqualified |
Unqualified |
Unqualified |
|
|
|
|
|
|
|
|
Local Sales |
22.8 |
25.6 |
20.0 |
11.5 |
- |
|
Export Sales |
13.9 |
14.6 |
19.8 |
24.4 |
- |
|
Sales Tax |
- |
- |
0.0 |
0.0 |
- |
|
Commission |
- |
- |
0.0 |
-0.1 |
- |
|
Sales |
- |
- |
- |
- |
24.5 |
|
Total Revenue |
36.7 |
40.2 |
39.9 |
35.9 |
24.5 |
|
|
|
|
|
|
|
|
Cost of Goods Sold |
33.7 |
35.9 |
35.5 |
31.9 |
21.8 |
|
Selling/Distribution Cost |
0.9 |
0.9 |
0.9 |
0.8 |
0.6 |
|
Administrative |
1.1 |
1.2 |
1.1 |
0.9 |
0.6 |
|
Operating Expenses |
0.0 |
0.0 |
0.0 |
0.1 |
0.1 |
|
Other Income |
-0.1 |
-0.1 |
-0.1 |
-0.4 |
-0.7 |
|
Gain on Sale of Fixed Asset |
0.0 |
0.0 |
0.0 |
- |
- |
|
Profit on Sale of Raw Material |
0.0 |
0.0 |
0.0 |
- |
- |
|
Total Operating Expense |
35.7 |
37.8 |
37.4 |
33.2 |
22.4 |
|
|
|
|
|
|
|
|
Interest Expense |
-3.0 |
-1.6 |
-1.6 |
-2.0 |
-1.1 |
|
Bank Charges and Commissions |
-0.4 |
-0.2 |
-0.2 |
- |
- |
|
Inland Letters of Credit Charges |
-0.1 |
-0.1 |
-0.1 |
- |
- |
|
Net Income Before Taxes |
-2.4 |
0.4 |
0.6 |
0.6 |
1.1 |
|
|
|
|
|
|
|
|
Provision for Income Taxes |
0.1 |
0.2 |
0.3 |
0.1 |
0.6 |
|
Net Income After Taxes |
-2.6 |
0.2 |
0.3 |
0.5 |
0.4 |
|
|
|
|
|
|
|
|
Net Income Before Extra. Items |
-2.6 |
0.2 |
0.3 |
0.5 |
0.4 |
|
Net Income |
-2.6 |
0.2 |
0.3 |
0.5 |
0.4 |
|
|
|
|
|
|
|
|
Income Available to Com Excl ExtraOrd |
-2.6 |
0.2 |
0.3 |
0.5 |
0.4 |
|
|
|
|
|
|
|
|
Income Available to Com Incl ExtraOrd |
-2.6 |
0.2 |
0.3 |
0.5 |
0.4 |
|
|
|
|
|
|
|
|
Basic Weighted Average Shares |
130.0 |
130.0 |
130.0 |
130.0 |
39.5 |
|
Basic EPS Excluding ExtraOrdinary Items |
-0.02 |
0.00 |
0.00 |
0.00 |
0.01 |
|
Basic EPS Including ExtraOrdinary Item |
-0.02 |
0.00 |
0.00 |
0.00 |
0.01 |
|
Dilution Adjustment |
0.0 |
0.0 |
0.0 |
- |
- |
|
Diluted Net Income |
-2.6 |
0.2 |
0.3 |
0.5 |
0.4 |
|
Diluted Weighted Average Shares |
130.0 |
130.0 |
130.0 |
130.0 |
39.5 |
|
Diluted EPS Excluding ExtraOrd Items |
-0.02 |
0.00 |
0.00 |
0.00 |
0.01 |
|
Diluted EPS Including ExtraOrd Items |
-0.02 |
0.00 |
0.00 |
0.00 |
0.01 |
|
DPS-Ordinary Shares |
0.00 |
0.00 |
0.00 |
0.01 |
0.00 |
|
Gross Dividends - Common Stock |
0.0 |
0.0 |
0.0 |
- |
0.0 |
|
Normalized Income Before Taxes |
-2.4 |
0.4 |
0.6 |
0.6 |
1.1 |
|
|
|
|
|
|
|
|
Inc Tax Ex Impact of Sp Items |
0.1 |
0.2 |
0.3 |
0.1 |
0.6 |
|
Normalized Income After Taxes |
-2.6 |
0.2 |
0.3 |
0.5 |
0.4 |
|
|
|
|
|
|
|
|
Normalized Inc. Avail to Com. |
-2.6 |
0.2 |
0.3 |
0.5 |
0.4 |
|
|
|
|
|
|
|
|
Basic Normalized EPS |
-0.02 |
0.00 |
0.00 |
0.00 |
0.01 |
|
Diluted Normalized EPS |
-0.02 |
0.00 |
0.00 |
0.00 |
0.01 |
|
Interest Expense |
3.0 |
1.6 |
1.6 |
2.0 |
1.1 |
|
Depreciation |
0.9 |
1.0 |
1.0 |
1.2 |
0.9 |
|
Advertising Expenses |
0.0 |
0.0 |
0.0 |
0.0 |
0.0 |
|
Rental Expense |
0.0 |
0.0 |
0.0 |
0.0 |
0.0 |
|
Service Cost |
0.1 |
0.2 |
0.2 |
- |
- |
|
Interest Cost |
0.0 |
0.0 |
0.0 |
- |
- |
|
Domestic Pension Plan Expense |
0.1 |
0.2 |
0.2 |
- |
- |
|
Gratuity |
0.1 |
0.2 |
0.1 |
- |
- |
|
Total Pension Expense |
0.2 |
0.4 |
0.4 |
- |
- |
|
Discount Rate |
12.00% |
12.00% |
10.00% |
- |
- |
|
Expected Rate of Increase in Salary |
11.00% |
11.00% |
9.00% |
- |
- |
|
|
|
|
Financials in: USD (mil) |
|
|
Except for share items (millions) and per
share items (actual units) |
|
|
|
|
|
|
|
|
|
|
|
|
30-Sep-2009 |
30-Jun-2009 |
31-Mar-2009 |
31-Dec-2008 |
30-Sep-2008 |
|
Period Length |
3 Months |
3 Months |
3 Months |
3 Months |
3 Months |
|
UpdateType/Date |
Updated Normal |
Updated Normal |
Updated Normal |
Updated Normal |
Updated Normal |
|
Filed Currency |
PKR |
PKR |
PKR |
PKR |
PKR |
|
Exchange Rate
(Period Average) |
82.619511 |
80.751022 |
79.729396 |
79.797043 |
74.087124 |
|
|
|
|
|
|
|
|
Sales |
10.2 |
9.2 |
7.3 |
8.2 |
12.2 |
|
Total Revenue |
10.2 |
9.2 |
7.3 |
8.2 |
12.2 |
|
|
|
|
|
|
|
|
Cost of Goods Sold |
9.4 |
8.8 |
6.8 |
7.4 |
10.8 |
|
Selling Expenses |
0.2 |
0.5 |
0.1 |
0.1 |
0.2 |
|
Administrative Expenses |
0.2 |
0.4 |
0.3 |
0.2 |
0.3 |
|
Other Income |
0.0 |
0.0 |
0.0 |
0.0 |
0.0 |
|
Other Operating Expenses |
- |
0.0 |
- |
- |
- |
|
Total Operating Expense |
9.7 |
9.7 |
7.2 |
7.7 |
11.2 |
|
|
|
|
|
|
|
|
Finance costs |
-0.7 |
-1.3 |
-0.6 |
-0.8 |
-0.9 |
|
Net Income Before Taxes |
-0.3 |
-1.7 |
-0.5 |
-0.3 |
0.1 |
|
|
|
|
|
|
|
|
Provision for Income Taxes |
0.1 |
0.0 |
0.0 |
0.0 |
0.1 |
|
Net Income After Taxes |
-0.4 |
-1.7 |
-0.5 |
-0.3 |
0.0 |
|
|
|
|
|
|
|
|
Net Income Before Extra. Items |
-0.4 |
-1.7 |
-0.5 |
-0.3 |
0.0 |
|
Net Income |
-0.4 |
-1.7 |
-0.5 |
-0.3 |
0.0 |
|
|
|
|
|
|
|
|
Income Available to Com Excl ExtraOrd |
-0.4 |
-1.7 |
-0.5 |
-0.3 |
0.0 |
|
|
|
|
|
|
|
|
Income Available to Com Incl ExtraOrd |
-0.4 |
-1.7 |
-0.5 |
-0.3 |
0.0 |
|
|
|
|
|
|
|
|
Basic Weighted Average Shares |
130.0 |
130.0 |
130.0 |
130.0 |
130.0 |
|
Basic EPS Excluding ExtraOrdinary Items |
0.00 |
-0.01 |
0.00 |
0.00 |
0.00 |
|
Basic EPS Including ExtraOrdinary Item |
0.00 |
-0.01 |
0.00 |
0.00 |
0.00 |
|
Dilution Adjustment |
0.0 |
0.0 |
0.0 |
0.0 |
- |
|
Diluted Net Income |
-0.4 |
-1.7 |
-0.5 |
-0.3 |
0.0 |
|
Diluted Weighted Average Shares |
130.0 |
130.0 |
130.0 |
130.0 |
130.0 |
|
Diluted EPS Excluding ExtraOrd Items |
0.00 |
-0.01 |
0.00 |
0.00 |
0.00 |
|
Diluted EPS Including ExtraOrd Items |
0.00 |
-0.01 |
0.00 |
0.00 |
0.00 |
|
DPS-Ordinary Shares |
0.00 |
0.00 |
0.00 |
0.00 |
0.00 |
|
Gross Dividends - Common Stock |
0.0 |
0.0 |
0.0 |
0.0 |
0.0 |
|
Normalized Income Before Taxes |
-0.3 |
-1.7 |
-0.5 |
-0.3 |
0.1 |
|
|
|
|
|
|
|
|
Inc Tax Ex Impact of Sp Items |
0.1 |
0.0 |
0.0 |
0.0 |
0.1 |
|
Normalized Income After Taxes |
-0.4 |
-1.7 |
-0.5 |
-0.3 |
0.0 |
|
|
|
|
|
|
|
|
Normalized Inc. Avail to Com. |
-0.4 |
-1.7 |
-0.5 |
-0.3 |
0.0 |
|
|
|
|
|
|
|
|
Basic Normalized EPS |
0.00 |
-0.01 |
0.00 |
0.00 |
0.00 |
|
Diluted Normalized EPS |
0.00 |
-0.01 |
0.00 |
0.00 |
0.00 |
|
Depreciation Expenses |
0.2 |
0.2 |
0.2 |
0.2 |
0.2 |
|
|
|
|
Financials in: USD (mil) |
|
|
Except for share items (millions) and per
share items (actual units) |
|
|
|
|
|
|
|
|
|
|
|
|
30-Jun-2009 |
30-Jun-2008 |
30-Jun-2007 |
30-Jun-2006 |
30-Jun-2005 |
|
UpdateType/Date |
Updated Normal |
Reclassified
Normal |
Updated Normal |
Updated Normal |
Updated Normal |
|
Filed Currency |
PKR |
PKR |
PKR |
PKR |
PKR |
|
Exchange Rate |
81.44 |
68.45 |
60.47 |
60.21 |
59.61 |
|
Auditor |
Hameed Khan
& Co. |
Hameed Khan
& Co. |
Hameed Khan
& Co. |
Hameed Khan
& Co. |
Hameed Khan
& Co. |
|
Auditor Opinion |
Unqualified |
Unqualified |
Unqualified |
Unqualified |
Unqualified |
|
|
|
|
|
|
|
|
Stores |
0.0 |
0.1 |
0.0 |
0.0 |
0.0 |
|
Spares |
0.2 |
0.1 |
0.1 |
0.1 |
0.1 |
|
Raw Material |
9.6 |
7.9 |
6.0 |
8.2 |
8.0 |
|
Work in Progress |
0.4 |
0.4 |
0.3 |
0.3 |
0.2 |
|
Finished Goods |
1.7 |
2.0 |
1.0 |
0.5 |
0.4 |
|
Waste |
0.0 |
0.0 |
0.0 |
0.0 |
0.0 |
|
Trade Debts |
1.1 |
1.0 |
0.8 |
0.5 |
0.3 |
|
Advances and Loans |
1.5 |
1.9 |
0.2 |
0.2 |
0.9 |
|
Deposits |
0.5 |
0.1 |
0.4 |
0.1 |
2.2 |
|
Prepayments |
- |
- |
- |
0.0 |
0.0 |
|
Other Receivable |
0.9 |
0.8 |
0.9 |
0.8 |
0.2 |
|
Short Term Investments |
0.9 |
1.5 |
2.2 |
- |
- |
|
Cash in Hand |
0.0 |
0.0 |
0.0 |
0.0 |
- |
|
Cash/Bank |
0.0 |
0.1 |
0.2 |
2.8 |
3.3 |
|
Total Current Assets |
16.8 |
15.8 |
12.1 |
13.5 |
15.8 |
|
|
|
|
|
|
|
|
Freehold Land |
0.1 |
0.2 |
0.2 |
0.2 |
0.2 |
|
Office Building |
0.0 |
0.0 |
0.1 |
0.1 |
0.1 |
|
Factory Building |
3.4 |
4.0 |
4.4 |
4.3 |
3.4 |
|
Colony Building |
0.8 |
0.9 |
1.0 |
0.9 |
0.8 |
|
Plant/Machinery |
22.5 |
25.7 |
28.5 |
26.2 |
20.3 |
|
Tube Wells |
0.0 |
0.0 |
0.0 |
0.0 |
0.0 |
|
Electric Install |
0.6 |
0.7 |
0.7 |
0.7 |
0.5 |
|
Tools/Equipment |
0.1 |
0.1 |
0.1 |
0.1 |
0.1 |
|
Telephone Inst. |
0.0 |
0.0 |
0.0 |
0.0 |
0.0 |
|
Office Equipment |
0.1 |
0.1 |
0.1 |
0.1 |
0.1 |
|
Furn./Fixtures |
0.1 |
0.1 |
0.1 |
0.1 |
0.1 |
|
Computer Software |
0.0 |
0.0 |
0.0 |
0.0 |
0.0 |
|
Vehicles |
0.3 |
0.3 |
0.4 |
0.3 |
0.3 |
|
Power House Machinery |
1.1 |
1.3 |
0.0 |
- |
- |
|
Finance Lease |
0.2 |
0.2 |
0.2 |
1.6 |
1.3 |
|
Fuel Tank - Power House |
- |
- |
- |
0.0 |
0.0 |
|
Depreciation |
-14.4 |
-16.1 |
-17.2 |
-16.1 |
-15.2 |
|
Capital Work in Progress |
0.0 |
0.0 |
0.0 |
0.0 |
0.0 |
|
LT Loans |
0.0 |
0.0 |
0.1 |
0.1 |
0.1 |
|
LT Deposits |
0.0 |
0.0 |
0.0 |
0.1 |
0.1 |
|
LT Investments |
0.0 |
0.0 |
0.0 |
0.0 |
0.4 |
|
Total Assets |
31.8 |
33.4 |
30.8 |
32.4 |
28.3 |
|
|
|
|
|
|
|
|
Sec. Creditors |
1.2 |
0.5 |
0.6 |
0.6 |
0.7 |
|
Unsec Creditors |
2.2 |
1.4 |
1.3 |
2.4 |
2.4 |
|
Unsec. Accrued |
0.6 |
0.6 |
0.6 |
0.6 |
0.4 |
|
Unclaimed Div. |
0.0 |
0.0 |
0.0 |
0.0 |
0.0 |
|
Workers Partic. |
0.3 |
0.4 |
0.4 |
0.3 |
0.2 |
|
Other Liabs. |
0.0 |
0.0 |
0.0 |
0.0 |
0.0 |
|
Accrued Interest on Loans and Borrowings |
0.5 |
0.2 |
0.4 |
0.4 |
0.3 |
|
ST Borrowings-Banking |
10.7 |
11.1 |
8.1 |
8.4 |
10.2 |
|
ST Borrowings-Related Parties |
0.0 |
0.1 |
0.0 |
- |
- |
|
Cur Por LT Liabs |
0.6 |
0.8 |
0.6 |
1.2 |
1.6 |
|
Finance Lease |
0.4 |
0.4 |
0.1 |
- |
- |
|
Tax Provision |
0.0 |
0.0 |
0.0 |
0.0 |
0.2 |
|
Total Current Liabilities |
16.6 |
15.4 |
12.0 |
13.9 |
16.1 |
|
|
|
|
|
|
|
|
Obligations Lease |
0.4 |
0.9 |
0.1 |
0.5 |
0.5 |
|
LT Loan-Banking |
6.7 |
4.4 |
4.5 |
10.6 |
19.7 |
|
LT Loan-Related Parties |
4.9 |
5.8 |
6.6 |
- |
- |
|
Total Long Term Debt |
11.9 |
11.1 |
11.1 |
11.1 |
20.3 |
|
|
|
|
|
|
|
|
Def. Gratuity/Liabilities |
0.4 |
0.5 |
0.5 |
0.5 |
0.5 |
|
Total Liabilities |
28.9 |
26.9 |
23.7 |
25.5 |
36.8 |
|
|
|
|
|
|
|
|
Share Capital |
16.0 |
19.0 |
21.5 |
21.6 |
6.6 |
|
Accumulated |
-13.0 |
-12.5 |
-14.4 |
-14.7 |
-15.1 |
|
Unrealised Gain /Loss on LT Investments |
0.0 |
0.0 |
0.0 |
- |
- |
|
Total Equity |
2.9 |
6.5 |
7.1 |
6.9 |
-8.5 |
|
|
|
|
|
|
|
|
Total Liabilities & Shareholders' Equity |
31.8 |
33.4 |
30.8 |
32.4 |
28.3 |
|
|
|
|
|
|
|
|
S/O-Ordinary Shares |
130.0 |
130.0 |
130.0 |
130.0 |
39.5 |
|
Total Common Shares Outstanding |
130.0 |
130.0 |
130.0 |
130.0 |
39.5 |
|
Full-Time Employees |
2,591 |
2,684 |
3,014 |
2,828 |
2,301 |
|
Number of Common Shareholders |
550 |
550 |
564 |
590 |
622 |
|
Capitla lease Due Within 1 Year |
0.0 |
0.5 |
0.0 |
0.4 |
- |
|
Capitla lease Due Within 2 Year |
0.5 |
0.5 |
0.1 |
0.4 |
- |
|
Capitla lease Due Within 3 Year |
0.4 |
0.4 |
0.0 |
0.2 |
- |
|
Capitla lease Due Within 4 Year |
0.0 |
0.0 |
0.0 |
0.0 |
- |
|
Capitla lease Due Within 5 Year |
- |
- |
0.0 |
0.0 |
- |
|
Financial Charges |
-0.1 |
-0.2 |
0.0 |
-0.1 |
- |
|
Total Capital Leases |
0.8 |
1.3 |
0.1 |
0.9 |
- |
|
Discount Rate |
12.00% |
12.00% |
10.00% |
- |
- |
|
Expected rate |
11.00% |
11.00% |
9.00% |
- |
- |
|
Gratuity |
-0.4 |
-0.5 |
-0.5 |
- |
- |
|
Net Assets Recognized on Balance Sheet |
-0.4 |
-0.5 |
-0.5 |
- |
- |
|
|
|
|
Financials in: USD (mil) |
|
|
Except for share items (millions) and per
share items (actual units) |
|
|
|
|
|
|
|
|
|
|
|
|
30-Sep-2009 |
30-Jun-2009 |
31-Mar-2009 |
30-Sep-2008 |
30-Jun-2008 |
|
UpdateType/Date |
Updated Normal |
Updated Normal |
Updated Normal |
Updated Normal |
Reclassified
Normal |
|
Filed Currency |
PKR |
PKR |
PKR |
PKR |
PKR |
|
Exchange Rate |
83.16 |
81.44 |
80.51 |
78.25 |
68.45 |
|
|
|
|
|
|
|
|
Stores and Spares |
0.2 |
0.2 |
0.2 |
0.2 |
0.2 |
|
Raw Materials |
6.3 |
9.6 |
11.8 |
6.1 |
7.9 |
|
Work-in-progress |
0.4 |
0.4 |
0.3 |
0.2 |
0.4 |
|
Finished Goods |
1.4 |
1.7 |
1.9 |
2.0 |
2.0 |
|
Waste |
0.0 |
0.0 |
0.0 |
0.1 |
0.0 |
|
Trade Debts |
1.5 |
1.1 |
0.7 |
1.6 |
1.0 |
|
Loans and Advances |
1.6 |
1.5 |
2.0 |
1.8 |
1.9 |
|
Advances, Deposits & Prepayments |
1.6 |
1.4 |
1.1 |
0.9 |
0.8 |
|
Short Term Investments |
0.8 |
0.9 |
1.0 |
1.2 |
1.5 |
|
Cash and Bank Balances |
0.3 |
0.0 |
0.1 |
0.2 |
0.1 |
|
Total Current Assets |
14.1 |
16.8 |
19.2 |
14.1 |
15.8 |
|
|
|
|
|
|
|
|
Operating Assets |
13.5 |
13.9 |
13.6 |
14.2 |
16.3 |
|
Long Term Loans |
0.0 |
0.0 |
0.0 |
0.0 |
0.0 |
|
Long Term Deposits |
0.0 |
0.0 |
0.0 |
0.0 |
0.0 |
|
Long Term Investments |
0.0 |
0.0 |
0.0 |
0.0 |
0.0 |
|
Assets Subject to Finance Lease |
1.1 |
1.1 |
1.1 |
1.1 |
1.3 |
|
Capital Work-in-progress |
- |
- |
- |
0.0 |
0.0 |
|
Total Assets |
28.7 |
31.8 |
34.0 |
29.5 |
33.4 |
|
|
|
|
|
|
|
|
Trade and other Payables |
5.2 |
4.3 |
5.0 |
3.5 |
2.8 |
|
Accrued Interest on Loans and Borrowings |
0.5 |
0.5 |
0.2 |
0.2 |
0.2 |
|
Short-term Borrowings |
7.5 |
10.7 |
13.3 |
9.3 |
11.2 |
|
Current Portion of Long-term Liabilities |
0.8 |
1.0 |
0.8 |
0.8 |
1.2 |
|
Provision for Taxation |
- |
0.0 |
- |
- |
0.0 |
|
Total Current Liabilities |
14.0 |
16.6 |
19.2 |
13.8 |
15.4 |
|
|
|
|
|
|
|
|
Long Term Loan |
11.5 |
11.5 |
9.3 |
8.9 |
10.2 |
|
Obligations Under Finance Lease |
0.3 |
0.4 |
0.5 |
0.6 |
0.9 |
|
Total Long Term Debt |
11.8 |
11.9 |
9.7 |
9.6 |
11.1 |
|
|
|
|
|
|
|
|
Def. Gratuity/Liabilities |
0.4 |
0.4 |
0.4 |
0.4 |
0.5 |
|
Total Liabilities |
26.2 |
28.9 |
29.3 |
23.8 |
26.9 |
|
|
|
|
|
|
|
|
Share Capital |
15.6 |
16.0 |
16.1 |
16.6 |
19.0 |
|
Accumulated Loss |
-13.2 |
-13.0 |
-11.4 |
-10.9 |
-12.5 |
|
Unrealised Gain/(Loss) on Long term Inv |
0.0 |
0.0 |
0.0 |
0.0 |
0.0 |
|
Total Equity |
2.5 |
2.9 |
4.7 |
5.7 |
6.5 |
|
|
|
|
|
|
|
|
Total Liabilities & Shareholders' Equity |
28.7 |
31.8 |
34.0 |
29.5 |
33.4 |
|
|
|
|
|
|
|
|
S/O-Ordinary Shares |
130.0 |
130.0 |
130.0 |
130.0 |
130.0 |
|
Total Common Shares Outstanding |
130.0 |
130.0 |
130.0 |
130.0 |
130.0 |
|
Gratuity |
-0.4 |
-0.4 |
-0.4 |
-0.4 |
-0.5 |
|
Net Assets Recognized on Balance Sheet |
-0.4 |
-0.4 |
-0.4 |
-0.4 |
-0.5 |
|
|
|
|
Financials in: USD (mil) |
|
|
Except for share items (millions) and per
share items (actual units) |
|
|
|
|
|
|
|
|
|
|
|
|
30-Jun-2009 |
30-Jun-2008 |
30-Jun-2007 |
30-Jun-2006 |
30-Jun-2005 |
|
Period Length |
12 Months |
12 Months |
12 Months |
12 Months |
9 Months |
|
UpdateType/Date |
Updated Normal |
Updated Normal |
Reclassified
Normal |
Updated Normal |
Updated Normal |
|
Filed Currency |
PKR |
PKR |
PKR |
PKR |
PKR |
|
Exchange Rate
(Period Average) |
78.573941 |
62.550956 |
60.637036 |
59.865977 |
59.345369 |
|
Auditor |
Hameed Khan
& Co. |
Hameed Khan
& Co. |
Hameed Khan
& Co. |
Hameed Khan
& Co. |
Hameed Khan
& Co. |
|
Auditor Opinion |
Unqualified |
Unqualified |
Unqualified |
Unqualified |
Unqualified |
|
|
|
|
|
|
|
|
Net Income |
-2.4 |
0.4 |
0.6 |
0.6 |
1.1 |
|
Depreciation |
0.8 |
1.0 |
1.0 |
1.2 |
0.9 |
|
Gratuity |
0.1 |
0.2 |
0.2 |
0.2 |
0.1 |
|
Worker Profit Participation Fund |
0.0 |
0.0 |
0.0 |
0.0 |
0.1 |
|
Dividend Income |
- |
- |
- |
0.0 |
0.0 |
|
Sale of Fixed Assets |
0.0 |
0.0 |
0.0 |
0.0 |
-0.1 |
|
Doubtful Balance Written off |
- |
- |
- |
- |
0.0 |
|
Gain on Sale of Investments |
- |
- |
- |
-0.3 |
-0.5 |
|
Interest Income |
-0.1 |
-0.1 |
-0.1 |
-0.1 |
0.0 |
|
Financial Expenses |
3.5 |
2.0 |
1.9 |
2.0 |
1.1 |
|
Stores/Spares |
-0.1 |
0.0 |
0.0 |
0.0 |
0.0 |
|
Stock in Trade |
-3.2 |
-4.2 |
1.6 |
-0.4 |
1.2 |
|
Machibery Held For Sales |
- |
- |
- |
- |
0.0 |
|
Trade Debts |
-0.3 |
-0.3 |
-0.3 |
-0.2 |
0.1 |
|
Loans and Advances |
0.1 |
-1.9 |
0.0 |
0.3 |
0.4 |
|
Short Term Investments |
0.4 |
0.5 |
0.5 |
- |
- |
|
Adv./Dep./Prepay./Other Receivables |
-0.5 |
0.3 |
-0.3 |
2.0 |
-2.1 |
|
Trade and Other Payable |
2.0 |
0.3 |
-1.0 |
0.0 |
0.3 |
|
Interest Paid |
-3.2 |
-2.1 |
-1.9 |
-1.9 |
-1.0 |
|
Income Tax Paid |
-0.3 |
-0.2 |
-0.3 |
-0.4 |
-0.2 |
|
Gratuity Paid |
-0.1 |
-0.2 |
-0.2 |
-0.1 |
-0.1 |
|
Adjustment |
- |
- |
-0.5 |
- |
- |
|
Cash from Operating Activities |
-3.2 |
-4.4 |
1.2 |
3.0 |
1.1 |
|
|
|
|
|
|
|
|
Capital Expenditure |
-1.1 |
-2.3 |
-1.0 |
-8.8 |
-0.4 |
|
LT Deposits |
0.0 |
0.0 |
0.0 |
0.0 |
0.0 |
|
LT Advances |
0.0 |
0.1 |
0.0 |
0.0 |
0.0 |
|
Sale/Fixed Assets |
0.0 |
0.0 |
0.0 |
0.7 |
0.1 |
|
Proc./LT Deposits/Investments |
- |
- |
- |
0.4 |
0.7 |
|
Dividend Received |
- |
- |
- |
0.0 |
0.0 |
|
Profit received on bank account |
0.0 |
0.1 |
0.1 |
0.1 |
0.0 |
|
Cash from Investing Activities |
-1.0 |
-2.1 |
-0.9 |
-7.6 |
0.5 |
|
|
|
|
|
|
|
|
Share Capital Increase |
- |
- |
- |
15.1 |
0.0 |
|
Payment of Long Term Financing |
3.0 |
0.7 |
0.3 |
-9.2 |
-0.4 |
|
Obligations/Lease |
-0.3 |
1.3 |
-0.8 |
-0.2 |
-0.3 |
|
ST Borrowings |
1.3 |
4.4 |
-0.3 |
-1.7 |
-0.9 |
|
Associated Companies |
- |
- |
- |
- |
0.0 |
|
Dividend |
- |
0.0 |
0.0 |
0.0 |
- |
|
Cash from Financing Activities |
4.1 |
6.4 |
-0.8 |
4.1 |
-1.6 |
|
|
|
|
|
|
|
|
Net Change in Cash |
-0.1 |
-0.1 |
-0.4 |
-0.5 |
0.0 |
|
|
|
|
|
|
|
|
Net Cash - Beginning Balance |
0.1 |
0.2 |
0.6 |
3.3 |
3.4 |
|
Net Cash - Ending Balance |
0.0 |
0.1 |
0.2 |
2.8 |
3.3 |
|
Cash Interest Paid |
3.2 |
2.1 |
1.9 |
1.9 |
- |
|
Cash Taxes Paid |
0.3 |
0.2 |
0.3 |
0.4 |
- |
|
|
|
|
Financials in: USD (mil) |
|
|
Except for share items (millions) and per
share items (actual units) |
|
|
|
|
|
|
|
|
|
|
|
|
30-Sep-2009 |
30-Jun-2009 |
31-Mar-2009 |
30-Sep-2008 |
30-Jun-2008 |
|
Period Length |
3 Months |
12 Months |
9 Months |
3 Months |
12 Months |
|
UpdateType/Date |
Updated Normal |
Updated Normal |
Updated Normal |
Updated Normal |
Updated Normal |
|
Filed Currency |
PKR |
PKR |
PKR |
PKR |
PKR |
|
Exchange Rate
(Period Average) |
82.619511 |
78.573941 |
77.851736 |
74.087124 |
62.550956 |
|
|
|
|
|
|
|
|
Net Income |
-0.3 |
-2.4 |
-0.7 |
0.1 |
0.4 |
|
Depreciation |
0.2 |
0.8 |
0.6 |
0.2 |
1.0 |
|
Gratuity- Net of Payments |
0.0 |
0.1 |
0.1 |
0.0 |
0.2 |
|
Workers Participation Fund |
- |
0.0 |
- |
- |
0.0 |
|
Gain on Sale of Fixed Assets |
- |
0.0 |
0.0 |
- |
0.0 |
|
Interest Income |
0.0 |
-0.1 |
0.0 |
0.0 |
-0.1 |
|
Finance Cost |
0.7 |
3.5 |
2.2 |
0.9 |
2.0 |
|
Stores and Spares |
0.0 |
-0.1 |
0.0 |
0.0 |
0.0 |
|
Stock-in-trade |
3.4 |
-3.2 |
-5.6 |
0.7 |
-4.2 |
|
Trade Debts |
-0.4 |
-0.3 |
0.1 |
-0.8 |
-0.3 |
|
Loans and Advance |
-0.2 |
0.1 |
-0.3 |
-0.1 |
-1.9 |
|
Short Term Investment |
0.1 |
0.4 |
0.3 |
0.1 |
0.5 |
|
Advances, Deposits, and Prepayments |
-0.3 |
-0.5 |
-0.5 |
-0.1 |
0.3 |
|
Trade and Other Payable |
0.9 |
2.0 |
2.7 |
1.1 |
0.3 |
|
Financial Charges Paid |
-0.8 |
-3.2 |
-2.3 |
-0.8 |
-2.1 |
|
Income Tax Paid |
-0.1 |
-0.3 |
-0.2 |
-0.1 |
-0.2 |
|
Gratuity Paid |
0.0 |
-0.1 |
-0.1 |
0.0 |
-0.2 |
|
Cash from Operating Activities |
3.3 |
-3.2 |
-3.7 |
1.1 |
-4.4 |
|
|
|
|
|
|
|
|
Fixed Capital Expenditures |
-0.1 |
-1.1 |
-0.4 |
-0.1 |
-2.3 |
|
Long Term Deposits |
0.0 |
0.0 |
0.0 |
0.0 |
0.0 |
|
Long Term Advances |
0.0 |
0.0 |
0.0 |
0.0 |
0.1 |
|
Sale Proceeds of Fixed Assets |
- |
0.0 |
0.0 |
- |
0.0 |
|
Profit Received on Bank Accounts |
0.0 |
0.0 |
0.1 |
0.0 |
- |
|
Interest Income Received |
- |
- |
- |
- |
0.1 |
|
Cash from Investing Activities |
0.0 |
-1.0 |
-0.3 |
-0.1 |
-2.1 |
|
|
|
|
|
|
|
|
Long Term Financing |
- |
- |
0.3 |
- |
- |
|
Long Term Loans from Bank |
0.1 |
3.0 |
- |
-0.2 |
0.7 |
|
Obligations Under Lease |
-0.1 |
-0.3 |
-0.2 |
-0.1 |
1.3 |
|
Decrease in Short term Debt |
-3.0 |
1.3 |
3.8 |
-0.6 |
4.4 |
|
Dividend |
- |
- |
- |
- |
0.0 |
|
Cash from Financing Activities |
-3.0 |
4.1 |
3.9 |
-0.9 |
6.4 |
|
|
|
|
|
|
|
|
Net Change in Cash |
0.3 |
-0.1 |
0.0 |
0.0 |
-0.1 |
|
|
|
|
|
|
|
|
Opening Balance |
0.0 |
0.1 |
0.1 |
0.1 |
0.2 |
|
Closing Balance |
0.3 |
0.0 |
0.1 |
0.2 |
0.1 |
|
Cash Interest Paid |
0.8 |
3.2 |
2.3 |
0.8 |
2.1 |
|
Cash Taxes Paid |
0.1 |
0.3 |
0.2 |
0.1 |
0.2 |
FOREIGN EXCHANGE RATES
|
Currency |
Unit
|
Indian Rupees |
|
US Dollar |
1 |
Rs.50.28 |
|
|
1 |
Rs.80.08 |
|
Euro |
1 |
Rs.68.44 |
RATING EXPLANATIONS
|
RATING |
STATUS |
PROPOSED CREDIT LINE |
|
|
>86 |
Aaa |
Possesses an extremely sound financial base with the strongest
capability for timely payment of interest and principal sums |
Unlimited |
|
71-85 |
Aa |
Possesses adequate working capital. No caution needed for credit
transaction. It has above average (strong) capability for payment of interest
and principal sums |
Large |
|
56-70 |
A |
Financial & operational base are regarded healthy. General unfavourable
factors will not cause fatal effect. Satisfactory capability for payment of
interest and principal sums |
Fairly Large |
|
41-55 |
Ba |
Overall operation is considered normal. Capable to meet normal
commitments. |
Satisfactory |
|
26-40 |
B |
Capability to overcome financial difficulties seems comparatively
below average. |
Small |
|
11-25 |
Ca |
Adverse factors are apparent. Repayment of interest and principal sums
in default or expected to be in default upon maturity |
Limited with full
security |
|
<10 |
C |
Absolute credit risk exists. Caution needed to be exercised |
Credit not
recommended |
|
-- |
NB |
New Business |
-- |
This score serves as a reference to assess SC’s credit risk and
to set the amount of credit to be extended. It is calculated from a composite
of weighted scores obtained from each of the major sections of this report. The
assessed factors and their relative weights (as indicated through %) are as
follows:
Financial
condition (40%) Ownership
background (20%) Payment
record (10%)
Credit history
(10%) Market trend
(10%) Operational
size (10%)
This report is issued at your request without any
risk and responsibility on the part of MIRA INFORM PRIVATE LIMITED (MIPL)
or its officials.