![]()
MIRA INFORM REPORT
|
Report Date : |
14.11.2011 |
IDENTIFICATION DETAILS
|
Name : |
AYESHA TEXTILE MILLS LIMITED |
|
|
|
|
Registered Office : |
97-B Gulberg II, Lahore |
|
|
|
|
Country : |
Pakistan |
|
|
|
|
Financials (as on) : |
30.06.2008 |
|
|
|
|
Date of Incorporation : |
Not Available |
|
|
|
|
Legal Form : |
Public Independent Company |
|
|
|
|
Line of Business : |
manufacture of cotton and polyester cotton yarn |
RATING & COMMENTS
|
MIRA’s Rating : |
B |
|
RATING |
STATUS |
PROPOSED CREDIT LINE |
|
|
26-40 |
B |
Capability to overcome financial difficulties seems comparatively
below average. |
Small |
|
Status : |
Moderate |
|
|
|
|
Payment
Behaviour : |
Usually Correct |
|
|
|
|
Litigation : |
Clear |
NOTES :
Any query related to this report can be made
on e-mail : infodept@mirainform.com
while quoting report number, name and date.
ECGC Country Risk Classification List – September 30th, 2011
|
Country Name |
Previous Rating (30.06.2011) |
Current Rating (30.09.2011) |
|
Pakistan |
b2 |
b2 |
|
Risk Category |
ECGC
Classification |
|
Insignificant |
A1 |
|
Low |
A2 |
|
Moderate |
B1 |
|
High |
B2 |
|
Very High |
C1 |
|
Restricted |
C2 |
|
Off-credit |
D |
Company name & address
Ayesha Textile Mills Limited
97-B Gulberg II
Lahore,
Pakistan
Tel: 92-42-5756707
Fax: 92-42-5712151
Web: www.ayeshagroup.com
synthesis
Employees: 1,919
Company Type: Public
Independent
Traded: Karachi
Stock Exchange: AYTM
Auditor: Mushtaq & Company Chartered Accountants
Financials in: USD
(Millions)
Fiscal Year End: 30-Jun-2008
Reporting Currency: Pakistan
Rupee
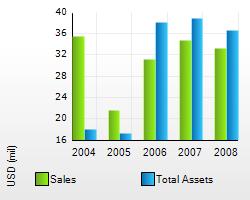
Annual Sales: 33.3
1
Net Income: (0.6)
Total Assets: 36.5
2
Business Description
Ayesha Textile
Mills Limited is a Pakistan-based company. The Company is engaged in the
manufacture of cotton and polyester cotton yarn. During the fiscal year ended
June 30, 2010, 82.65% of the Company's sales came from the sale of yarn. For
the nine months ended 31 March 2009, Ayesha Textile Mills Limited's sales
decreased 6% to PKR1.44B. Net loss decreased 43% to PKR47.3M. Saless reflect a
decrease in local sales, lower export sales and a fall in sale of raw cotton .
Lower loss reflects a decrease in cost of sales, lower administrative expense,
higher gross profit margins and a decrease in depreciation expense. The Company
is principally engaged in the manufacture of cotton.
Industry
Industry Apparel and Accessories
ANZSIC 2006: 1312 - Natural
Textile Manufacturing
NACE 2002: 171 - Preparation
and spinning of textile fibres
NAICS 2002: 313111 - Yarn
Spinning Mills
UK SIC 2003: 171 - Preparation
and spinning of textile fibres
US SIC 1987: 2281 - Yarn
Spinning Mills
Key Executives
|
Name |
Title |
|
Muhammad Rafi |
Chairman of the Board, Chief Executive Officer |
|
A. G. K. Lodhi |
Chief Financial Officer, Director |
|
Saqib Hameed Khokhar |
Company Secretary |
|
Nasir Anwar |
Non-Executive Director |
|
Tariq Rafi |
Non-Executive Director |
Significant Developments
|
Topic |
#* |
Most Recent Headline |
Date |
|
Dividends |
2 |
Ayesha Textile Mills Ltd Not to Pay Dividend |
1-Nov-2011 |
* number of significant developments within
the last 12 months
News
|
Title |
Date |
|
BOARD
MEETINGS |
27-Feb-2011 |
Financial Summary
As of 31-Mar-2009
Key Ratios Company Industry
Current Ratio (MRQ) 0.74 2.75
Quick Ratio (MRQ) 0.36 1.45
Debt to Equity (MRQ) 0.89 0.52
Net Profit Margin (TTM) % 0.07 7.39
Return on Assets (TTM) % 0.06 7.59
Return on Equity (TTM) % 0.14 15.09
Stock Snapshot
Traded: Karachi Stock Exchange: AYTM
As of 30-Jun-2008 Financials in:
PKR
Price % Change Rel S&P 500%
Key IDSM Number: 45960975
1 - Profit & Loss Item Exchange Rate: USD 1 = PKR 62.55096
2 - Balance Sheet Item Exchange Rate: USD 1 = PKR 68.45
Corporate Overview
Location
97-B Gulberg II
Lahore, Pakistan
Tel: 92-42-5756707
Fax: 92-42-5712151
Web: www.ayeshagroup.com
Quote Symbol - Exchange
AYTM - Karachi
Stock Exchange
Sales PKR(mil): 2,084.5
Assets PKR(mil): 2,500.9
Employees: 1,919
Fiscal Year End: 30-Jun-2008
Industry: Apparel
and Accessories
Company Type: Public
Independent
Quoted Status: Quoted
Chairman of the Board,
Chief Executive Officer: Muhammad
Rafi
Company Web Links
· Company Contact/E-mail
· Home Page
Contents
· Industry Codes
· Business Description
· Financial Data
· Key Corporate Relationships
Industry Codes
ANZSIC 2006 Codes:
1312 - Natural Textile Manufacturing
3711 - Textile Product Wholesaling
3739 - Other Goods Wholesaling Not Elsewhere Classified
NACE 2002 Codes:
5141 - Wholesale of textiles
171 - Preparation and spinning of textile fibres
5190 - Other wholesale
NAICS 2002 Codes:
424990 - Other Miscellaneous Nondurable Goods Merchant Wholesalers
313111 - Yarn Spinning Mills
424310 - Piece Goods, Notions, and Other Dry Goods Merchant
Wholesalers
US SIC 1987:
5199 - Nondurable Goods, Not Elsewhere Classified
2281 - Yarn Spinning Mills
5131 - Piece Goods, Notions, and Other Dry Good
UK SIC 2003:
171 - Preparation and spinning of textile fibres
5190 - Other wholesale
5141 - Wholesale of textiles
Business
Description
Ayesha Textile
Mills Limited is a Pakistan-based company. The Company is engaged in the
manufacture of cotton and polyester cotton yarn. During the fiscal year ended
June 30, 2010, 82.65% of the Company's sales came from the sale of yarn. For
the nine months ended 31 March 2009, Ayesha Textile Mills Limited's sales
decreased 6% to PKR1.44B. Net loss decreased 43% to PKR47.3M. Saless reflect a
decrease in local sales, lower export sales and a fall in sale of raw cotton .
Lower loss reflects a decrease in cost of sales, lower administrative expense,
higher gross profit margins and a decrease in depreciation expense. The Company
is principally engaged in the manufacture of cotton.
More Business
Descriptions
Textile and Fabric Finishing Mills
|
|||||||||||||||||||||||||||||||||||||
|
|||||||||||||||||||||||||||||||||||||
Executive report
|
Board of Directors |
|
|
|
|
|||
|
Chairman of the Board, Chief Executive Officer |
Chairman |
|
|||
|
Non-Executive Director |
Director/Board Member |
|
|||
|
Chief Financial Officer, Director |
Director/Board Member |
|
|||
|
Director |
Director/Board Member |
|
|||
|
Non-Executive Director |
Director/Board Member |
|
|||
|
Non-Executive Director |
Director/Board Member |
|
|||
|
Director |
Director/Board Member |
|
|
Executives |
|
|
|
|
|||
|
Chairman of the Board, Chief Executive Officer |
Chief Executive Officer |
|
|||
|
General Manager |
Managing Director |
|
|||
|
Company Secretary |
Company Secretary |
|
|||
|
Chief Financial Officer, Director |
Finance Executive |
|
Significant Developments
Ayesha Textile Mills Ltd Not to Pay Dividend Nov 01, 2011
Ayesha Textile
Mills Ltd announced that it is not to pay dividend for the first quarter ended
September 30, 2011.
Ayesha Textile
Mills Ltd Not to Pay FY 2010-2011 Final Dividend Oct 10, 2011
Ayesha Textile
Mills Ltd announced that its Board of Directors did not declare any final
dividend for fiscal year ended June 30, 2011.
Annual Income Statement
Financials in: USD (mil)
Except for share items (millions) and per share items (actual units)
|
|
30-Jun-2008 |
30-Jun-2007 |
30-Jun-2006 |
30-Jun-2005 |
30-Sep-2004 |
|
Period Length |
12 Months |
12 Months |
12 Months |
9 Months |
12 Months |
|
UpdateType/Date |
Updated Normal |
Reclassified
Normal |
Restated Normal |
Updated Normal |
Updated Normal |
|
Filed Currency |
PKR |
PKR |
PKR |
PKR |
PKR |
|
Exchange Rate
(Period Average) |
62.550956 |
60.637036 |
59.865977 |
59.345369 |
57.788522 |
|
Auditor |
|
Mushtaq &
Company Chartered Accountants |
Mushtaq &
Company Chartered Accountants |
Khalid Majid
Rahman |
Khalid Majid
Rahman |
|
Auditor Opinion |
|
Unqualified |
Unqualified |
Unqualified |
Unqualified |
|
|
|
|
|
|
|
|
Net Sales |
- |
- |
- |
21.7 |
35.4 |
|
Gross Sales |
33.9 |
35.8 |
32.1 |
- |
- |
|
Sales Returns and Allowances |
-0.6 |
-1.1 |
-0.9 |
- |
- |
|
Sales |
33.3 |
34.8 |
31.2 |
21.7 |
35.4 |
|
Total Sales |
33.3 |
34.8 |
31.2 |
21.7 |
35.4 |
|
|
|
|
|
|
|
|
Cost of Sales |
32.5 |
34.1 |
29.3 |
20.1 |
33.4 |
|
Cost of Sales, Total |
32.5 |
34.1 |
29.3 |
20.1 |
33.4 |
|
Gross Profit |
0.8 |
0.7 |
1.9 |
1.6 |
2.1 |
|
|
|
|
|
|
|
|
Selling/General/Administrative Expense |
0.4 |
0.5 |
0.6 |
0.3 |
0.5 |
|
Advertising Expense |
0.0 |
0.0 |
- |
- |
- |
|
Total Selling/General/Administrative Expenses |
0.5 |
0.5 |
0.6 |
0.3 |
0.5 |
|
Depreciation |
0.0 |
0.0 |
- |
- |
- |
|
Depreciation/Amortization |
0.0 |
0.0 |
- |
- |
- |
|
Investment Income -
Operating |
0.1 |
0.0 |
0.0 |
- |
- |
|
Interest/Investment Income - Operating |
0.1 |
0.0 |
0.0 |
- |
- |
|
Interest Expense (Income) - Net Operating Total |
0.1 |
0.0 |
0.0 |
- |
- |
|
Loss (Gain) on Sale of Assets - Operating |
0.0 |
0.0 |
0.0 |
- |
- |
|
Other Unusual Expense (Income) |
0.1 |
0.0 |
- |
- |
- |
|
Unusual Expense (Income) |
0.1 |
0.0 |
0.0 |
- |
- |
|
Other Operating Expense |
0.0 |
0.0 |
0.0 |
- |
- |
|
Other, Net |
0.0 |
-0.3 |
0.0 |
0.0 |
0.0 |
|
Other Operating Expenses, Total |
0.0 |
-0.3 |
0.0 |
0.0 |
0.0 |
|
Total Operating Expense |
33.1 |
34.4 |
29.9 |
20.4 |
33.8 |
|
|
|
|
|
|
|
|
Operating Income |
0.2 |
0.4 |
1.3 |
1.3 |
1.6 |
|
|
|
|
|
|
|
|
Interest Expense -
Non-Operating |
-0.9 |
-1.1 |
-1.1 |
-0.6 |
-0.7 |
|
Interest Expense, Net Non-Operating |
-0.9 |
-1.1 |
-1.1 |
-0.6 |
-0.7 |
|
Investment Income -
Non-Operating |
-0.1 |
-0.1 |
0.0 |
0.0 |
0.0 |
|
Interest/Investment Income - Non-Operating |
-0.1 |
-0.1 |
0.0 |
0.0 |
0.0 |
|
Interest Income (Expense) - Net Non-Operating Total |
-1.0 |
-1.1 |
-1.1 |
-0.6 |
-0.7 |
|
Other Non-Operating Income (Expense) |
-0.3 |
-0.2 |
- |
0.0 |
-0.1 |
|
Other, Net |
-0.3 |
-0.2 |
- |
0.0 |
-0.1 |
|
Income Before Tax |
-1.1 |
-1.0 |
0.3 |
0.7 |
0.8 |
|
|
|
|
|
|
|
|
Total Income Tax |
-0.5 |
-0.2 |
0.1 |
0.2 |
0.2 |
|
Income After Tax |
-0.6 |
-0.8 |
0.1 |
0.4 |
0.7 |
|
|
|
|
|
|
|
|
Net Income Before Extraord Items |
-0.6 |
-0.8 |
0.1 |
0.4 |
0.7 |
|
Net Income |
-0.6 |
-0.8 |
0.1 |
0.4 |
0.7 |
|
|
|
|
|
|
|
|
Income Available to Common Excl Extraord Items |
-0.6 |
-0.8 |
0.1 |
0.4 |
0.7 |
|
|
|
|
|
|
|
|
Income Available to Common Incl Extraord Items |
-0.6 |
-0.8 |
0.1 |
0.4 |
0.7 |
|
|
|
|
|
|
|
|
Basic/Primary Weighted Average Shares |
1.4 |
1.4 |
1.4 |
1.4 |
1.4 |
|
Basic EPS Excl Extraord Items |
-0.39 |
-0.60 |
0.10 |
0.29 |
0.48 |
|
Basic/Primary EPS Incl Extraord Items |
-0.39 |
-0.60 |
0.10 |
0.29 |
0.48 |
|
Dilution Adjustment |
0.0 |
0.0 |
- |
0.0 |
0.0 |
|
Diluted Net Income |
-0.6 |
-0.8 |
0.1 |
0.4 |
0.7 |
|
Diluted Weighted Average Shares |
1.4 |
1.4 |
1.4 |
1.4 |
1.4 |
|
Diluted EPS Excl Extraord Items |
-0.39 |
-0.60 |
0.10 |
0.29 |
0.48 |
|
Diluted EPS Incl Extraord Items |
-0.39 |
-0.60 |
0.10 |
0.29 |
0.48 |
|
Dividends per Share - Common Stock Primary Issue |
0.00 |
0.00 |
0.00 |
0.00 |
0.00 |
|
Gross Dividends - Common Stock |
0.0 |
0.0 |
0.0 |
0.0 |
0.0 |
|
Interest Expense, Supplemental |
0.9 |
1.1 |
1.0 |
0.6 |
0.7 |
|
Depreciation, Supplemental |
1.1 |
2.2 |
1.1 |
0.7 |
1.0 |
|
Total Special Items |
0.1 |
0.0 |
0.0 |
- |
- |
|
Normalized Income Before Tax |
-1.0 |
-1.0 |
0.3 |
0.7 |
0.8 |
|
|
|
|
|
|
|
|
Effect of Special Items on Income Taxes |
0.0 |
0.0 |
0.0 |
- |
- |
|
Inc Tax Ex Impact of Sp Items |
-0.5 |
-0.2 |
0.1 |
0.2 |
0.2 |
|
Normalized Income After Tax |
-0.5 |
-0.8 |
0.1 |
0.4 |
0.7 |
|
|
|
|
|
|
|
|
Normalized Inc. Avail to Com. |
-0.5 |
-0.8 |
0.1 |
0.4 |
0.7 |
|
|
|
|
|
|
|
|
Basic Normalized EPS |
-0.36 |
-0.60 |
0.10 |
0.29 |
0.48 |
|
Diluted Normalized EPS |
-0.36 |
-0.60 |
0.10 |
0.29 |
0.48 |
|
Rental Expenses |
0.0 |
0.0 |
0.0 |
0.0 |
0.0 |
|
Advertising Expense, Supplemental |
0.0 |
0.0 |
0.0 |
0.0 |
0.0 |
|
Normalized EBIT |
0.4 |
0.3 |
1.3 |
1.3 |
1.6 |
|
Normalized EBITDA |
1.5 |
2.5 |
2.4 |
2.0 |
2.5 |
|
Current Tax - Total |
0.2 |
0.2 |
0.2 |
0.1 |
0.2 |
|
Current Tax - Total |
0.2 |
0.2 |
0.2 |
0.1 |
0.2 |
|
Deferred Tax - Total |
-0.7 |
-0.2 |
0.0 |
0.1 |
0.1 |
|
Deferred Tax - Total |
-0.7 |
-0.2 |
0.0 |
0.1 |
0.1 |
|
Other Tax |
0.0 |
-0.1 |
-0.1 |
0.0 |
-0.1 |
|
Income Tax - Total |
-0.5 |
-0.2 |
0.1 |
0.2 |
0.2 |
|
Interest Cost - Domestic |
0.0 |
0.0 |
0.0 |
- |
- |
|
Service Cost - Domestic |
0.1 |
0.0 |
0.1 |
- |
- |
|
Actuarial Gains and Losses - Domestic |
0.0 |
0.0 |
- |
- |
- |
|
Domestic Pension Plan Expense |
0.1 |
0.0 |
0.1 |
- |
- |
|
Defined Contribution Expense - Domestic |
0.1 |
0.2 |
- |
- |
- |
|
Total Pension Expense |
0.2 |
0.2 |
0.1 |
- |
- |
|
Discount Rate - Domestic |
12.00% |
9.00% |
9.00% |
- |
- |
|
Compensation Rate - Domestic |
10.00% |
8.00% |
8.00% |
- |
- |
|
Total Plan Interest Cost |
0.0 |
0.0 |
0.0 |
- |
- |
|
Total Plan Service Cost |
0.1 |
0.0 |
0.1 |
- |
- |
Annual Balance Sheet
Financials in: USD (mil)
|
|
30-Jun-2008 |
30-Jun-2007 |
30-Jun-2006 |
30-Jun-2005 |
30-Sep-2004 |
|
UpdateType/Date |
Updated Normal |
Updated Normal |
Restated Normal |
Updated Normal |
Updated Normal |
|
Filed Currency |
PKR |
PKR |
PKR |
PKR |
PKR |
|
Exchange Rate |
68.45 |
60.47 |
60.21 |
59.61 |
59.26 |
|
Auditor |
|
Mushtaq &
Company Chartered Accountants |
Mushtaq &
Company Chartered Accountants |
Khalid Majid
Rahman |
Khalid Majid
Rahman |
|
Auditor Opinion |
|
Unqualified |
Unqualified |
Unqualified |
Unqualified |
|
|
|
|
|
|
|
|
Cash |
0.3 |
0.1 |
0.9 |
0.4 |
0.5 |
|
Cash and Short Term Investments |
0.3 |
0.1 |
0.9 |
0.4 |
0.5 |
|
Trade Accounts Receivable - Net |
2.4 |
1.6 |
1.5 |
1.6 |
2.5 |
|
Notes Receivable - Short Term |
0.1 |
0.0 |
0.9 |
0.3 |
0.1 |
|
Other Receivables |
0.2 |
0.3 |
0.2 |
0.1 |
0.1 |
|
Total Receivables, Net |
2.6 |
1.9 |
2.6 |
2.1 |
2.7 |
|
Inventories - Finished Goods |
0.6 |
0.5 |
0.3 |
0.3 |
0.3 |
|
Inventories - Work In Progress |
0.4 |
0.5 |
0.3 |
0.2 |
0.3 |
|
Inventories - Raw Materials |
4.1 |
3.4 |
3.0 |
3.3 |
4.0 |
|
Inventories - Other |
1.2 |
1.1 |
0.8 |
0.7 |
0.6 |
|
Total Inventory |
6.4 |
5.5 |
4.5 |
4.6 |
5.1 |
|
Prepaid Expenses |
0.0 |
0.0 |
0.0 |
0.0 |
0.0 |
|
Other Current Assets |
0.9 |
1.4 |
1.5 |
0.7 |
0.6 |
|
Other Current Assets, Total |
0.9 |
1.4 |
1.5 |
0.7 |
0.6 |
|
Total Current Assets |
10.3 |
8.9 |
9.4 |
7.8 |
8.9 |
|
|
|
|
|
|
|
|
Buildings |
4.9 |
5.3 |
5.3 |
1.7 |
1.7 |
|
Land/Improvements |
6.3 |
7.1 |
6.9 |
0.8 |
0.8 |
|
Machinery/Equipment |
17.4 |
19.2 |
15.9 |
15.7 |
14.7 |
|
Construction in
Progress |
0.4 |
0.2 |
0.2 |
0.1 |
0.1 |
|
Leases |
0.2 |
0.2 |
0.2 |
0.0 |
- |
|
Property/Plant/Equipment - Gross |
29.1 |
32.0 |
28.3 |
18.4 |
17.3 |
|
Accumulated Depreciation |
-3.2 |
-2.5 |
-0.3 |
-8.8 |
-8.2 |
|
Property/Plant/Equipment - Net |
25.9 |
29.5 |
28.0 |
9.5 |
9.1 |
|
LT Investment - Affiliate Companies |
0.2 |
0.4 |
0.4 |
0.1 |
0.1 |
|
LT Investments - Other |
0.1 |
0.1 |
0.1 |
0.0 |
0.0 |
|
Long Term Investments |
0.3 |
0.4 |
0.5 |
0.1 |
0.1 |
|
Note Receivable - Long Term |
0.0 |
0.0 |
0.0 |
0.0 |
0.0 |
|
Other Long Term Assets |
- |
- |
0.3 |
- |
- |
|
Other Long Term Assets, Total |
- |
- |
0.3 |
- |
- |
|
Total Assets |
36.5 |
38.9 |
38.2 |
17.4 |
18.1 |
|
|
|
|
|
|
|
|
Accounts Payable |
4.1 |
2.7 |
2.6 |
0.7 |
3.0 |
|
Accrued Expenses |
0.5 |
0.5 |
0.6 |
0.4 |
0.3 |
|
Notes Payable/Short Term Debt |
0.0 |
0.0 |
0.0 |
0.0 |
0.0 |
|
Current Portion - Long Term Debt/Capital Leases |
7.3 |
6.4 |
5.4 |
6.3 |
5.1 |
|
Customer Advances |
0.0 |
0.0 |
0.1 |
0.1 |
0.1 |
|
Income Taxes Payable |
0.6 |
0.6 |
0.9 |
0.4 |
0.3 |
|
Other Current Liabilities |
0.0 |
0.0 |
0.1 |
0.1 |
0.2 |
|
Other Current liabilities, Total |
0.7 |
0.6 |
1.1 |
0.5 |
0.6 |
|
Total Current Liabilities |
12.6 |
10.2 |
9.7 |
7.9 |
9.0 |
|
|
|
|
|
|
|
|
Long Term Debt |
4.7 |
5.6 |
4.2 |
3.4 |
3.5 |
|
Capital Lease Obligations |
0.1 |
0.1 |
0.1 |
0.0 |
- |
|
Total Long Term Debt |
4.8 |
5.7 |
4.3 |
3.4 |
3.5 |
|
Total Debt |
12.1 |
12.1 |
9.7 |
9.7 |
8.6 |
|
|
|
|
|
|
|
|
Deferred Income Tax - LT Liability |
3.0 |
3.4 |
0.4 |
- |
- |
|
Deferred Income Tax |
3.0 |
3.4 |
0.4 |
- |
- |
|
Pension Benefits - Underfunded |
0.1 |
0.2 |
0.2 |
- |
- |
|
Other Long Term Liabilities |
- |
- |
- |
0.6 |
0.4 |
|
Other Liabilities, Total |
0.1 |
0.2 |
0.2 |
0.6 |
0.4 |
|
Total Liabilities |
20.4 |
19.5 |
14.6 |
11.9 |
12.9 |
|
|
|
|
|
|
|
|
Common Stock |
0.2 |
0.2 |
0.2 |
0.2 |
0.2 |
|
Common Stock |
0.2 |
0.2 |
0.2 |
0.2 |
0.2 |
|
Additional Paid-In Capital |
0.1 |
0.1 |
0.1 |
0.1 |
0.1 |
|
Retained Earnings (Accumulated Deficit) |
4.0 |
4.6 |
4.7 |
4.4 |
4.0 |
|
Unrealized Gain (Loss) |
11.8 |
14.4 |
18.6 |
0.7 |
0.7 |
|
Total Equity |
16.1 |
19.4 |
23.6 |
5.5 |
5.1 |
|
|
|
|
|
|
|
|
Total Liabilities & Shareholders’ Equity |
36.5 |
38.9 |
38.2 |
17.4 |
18.1 |
|
|
|
|
|
|
|
|
Shares Outstanding - Common Stock Primary
Issue |
1.4 |
1.4 |
1.4 |
1.4 |
1.4 |
|
Total Common Shares Outstanding |
1.4 |
1.4 |
1.4 |
1.4 |
1.4 |
|
Employees |
- |
- |
1,919 |
1,701 |
1,615 |
|
Number of Common Shareholders |
85 |
85 |
85 |
85 |
- |
|
Deferred Sales - Current |
0.0 |
0.0 |
0.1 |
0.1 |
0.1 |
|
Total Capital Leases, Supplemental |
0.1 |
0.1 |
0.2 |
- |
- |
|
Capital Lease Payments Due in Year 1 |
0.0 |
0.0 |
0.0 |
- |
- |
|
Capital Lease Payments Due in Year 2 |
0.0 |
0.0 |
0.0 |
- |
- |
|
Capital Lease Payments Due in Year 3 |
0.0 |
0.0 |
0.0 |
- |
- |
|
Capital Lease Payments Due in Year 4 |
0.0 |
0.0 |
0.0 |
- |
- |
|
Capital Lease Payments Due in Year 5 |
0.0 |
0.0 |
0.0 |
- |
- |
|
Capital Lease Payments Due in 2-3 Years |
0.0 |
0.1 |
0.0 |
- |
- |
|
Capital Lease Payments Due in 4-5 Years |
0.0 |
0.1 |
0.0 |
- |
- |
|
Cap. Lease Pymts. Due in Year 6 & Beyond |
- |
0.0 |
0.1 |
- |
- |
|
Pension Obligation - Domestic |
0.1 |
0.2 |
0.2 |
- |
- |
|
Funded Status - Domestic |
-0.1 |
-0.2 |
-0.2 |
- |
- |
|
Total Funded Status |
-0.1 |
-0.2 |
-0.2 |
- |
- |
|
Discount Rate - Domestic |
12.00% |
9.00% |
9.00% |
- |
- |
|
Compensation Rate - Domestic |
10.00% |
8.00% |
8.00% |
- |
- |
|
Accrued Liabilities - Domestic |
-0.1 |
-0.2 |
-0.2 |
- |
- |
|
Net Assets Recognized on Balance Sheet |
-0.1 |
-0.2 |
-0.2 |
- |
- |
|
Total Plan Obligations |
0.1 |
0.2 |
0.2 |
- |
- |
Annual Cash Flows
Financials in: USD
(mil)
|
|
30-Jun-2008 |
30-Jun-2007 |
30-Jun-2006 |
30-Jun-2005 |
30-Sep-2004 |
|
Period Length |
12 Months |
12 Months |
12 Months |
9 Months |
12 Months |
|
UpdateType/Date |
Updated Normal |
Updated Normal |
Reclassified
Normal |
Updated Normal |
Updated Normal |
|
Filed Currency |
PKR |
PKR |
PKR |
PKR |
PKR |
|
Exchange Rate
(Period Average) |
62.550956 |
60.637036 |
59.865977 |
59.345369 |
57.788522 |
|
Auditor |
|
Mushtaq &
Company Chartered Accountants |
Mushtaq &
Company Chartered Accountants |
Khalid Majid
Rahman |
Khalid Majid
Rahman |
|
Auditor Opinion |
|
Unqualified |
Unqualified |
Unqualified |
Unqualified |
|
|
|
|
|
|
|
|
Net Income/Starting Line |
-1.1 |
-1.0 |
0.3 |
0.7 |
0.8 |
|
Depreciation |
1.1 |
2.2 |
1.1 |
0.7 |
1.0 |
|
Depreciation/Depletion |
1.1 |
2.2 |
1.1 |
0.7 |
1.0 |
|
Unusual Items |
0.1 |
0.0 |
0.0 |
0.0 |
0.0 |
|
Equity in Net Earnings (Loss) |
0.1 |
0.1 |
0.0 |
- |
- |
|
Other Non-Cash Items |
1.3 |
1.3 |
1.2 |
0.7 |
0.8 |
|
Non-Cash Items |
1.4 |
1.4 |
1.1 |
0.7 |
0.8 |
|
Accounts Receivable |
-1.1 |
0.0 |
0.1 |
0.9 |
-0.3 |
|
Inventories |
-1.7 |
-1.0 |
0.0 |
0.5 |
-2.7 |
|
Prepaid Expenses |
0.0 |
0.0 |
0.0 |
-0.3 |
-0.2 |
|
Other Assets |
0.5 |
0.5 |
-0.8 |
0.0 |
0.1 |
|
Accounts Payable |
2.0 |
-0.1 |
2.1 |
-2.5 |
2.3 |
|
Other Liabilities |
2.0 |
1.2 |
-0.9 |
0.9 |
0.2 |
|
Other Operating Cash Flow |
-1.4 |
-1.5 |
-1.3 |
-0.7 |
-1.0 |
|
Changes in Working Capital |
0.3 |
-1.0 |
-0.8 |
-1.1 |
-1.4 |
|
Cash from Operating Activities |
1.8 |
1.5 |
1.8 |
0.9 |
1.1 |
|
|
|
|
|
|
|
|
Purchase of Fixed Assets |
-1.1 |
-3.5 |
-2.1 |
-1.2 |
-1.2 |
|
Capital Expenditures |
-1.1 |
-3.5 |
-2.1 |
-1.2 |
-1.2 |
|
Sale of Fixed Assets |
0.1 |
0.0 |
0.0 |
0.0 |
0.0 |
|
Other Investing Cash Flow |
0.0 |
0.0 |
0.0 |
0.0 |
0.0 |
|
Other Investing Cash Flow Items, Total |
0.0 |
0.0 |
0.0 |
0.0 |
0.0 |
|
Cash from Investing Activities |
-1.0 |
-3.5 |
-2.2 |
-1.2 |
-1.2 |
|
|
|
|
|
|
|
|
Other Financing Cash Flow |
0.3 |
0.0 |
- |
0.0 |
0.0 |
|
Financing Cash Flow Items |
0.3 |
0.0 |
- |
0.0 |
0.0 |
|
Long Term Debt Issued |
0.3 |
2.2 |
1.4 |
1.0 |
0.9 |
|
Long Term Debt
Reduction |
-1.1 |
-1.0 |
-0.6 |
-0.8 |
-0.9 |
|
Long Term Debt, Net |
-0.8 |
1.2 |
0.8 |
0.2 |
0.0 |
|
Issuance (Retirement) of Debt, Net |
-0.8 |
1.2 |
0.8 |
0.2 |
0.0 |
|
Cash from Financing Activities |
-0.5 |
1.2 |
0.8 |
0.2 |
0.0 |
|
|
|
|
|
|
|
|
Net Change in Cash |
0.2 |
-0.8 |
0.4 |
0.0 |
-0.1 |
|
|
|
|
|
|
|
|
Net Cash - Beginning Balance |
0.1 |
0.9 |
0.4 |
0.5 |
0.6 |
|
Net Cash - Ending Balance |
0.3 |
0.1 |
0.9 |
0.4 |
0.5 |
|
Cash Interest Paid |
1.1 |
1.2 |
1.0 |
0.6 |
0.7 |
|
Cash Taxes Paid |
0.1 |
0.1 |
0.1 |
0.1 |
0.2 |
Annual Income Statement
Financials in: USD (mil)
Except for share items (millions) and per share items (actual units)
|
|
30-Jun-2008 |
30-Jun-2007 |
30-Jun-2006 |
30-Jun-2005 |
30-Sep-2004 |
|
Period Length |
12 Months |
12 Months |
12 Months |
9 Months |
12 Months |
|
UpdateType/Date |
Updated Normal |
Reclassified
Normal |
Restated Normal |
Updated Normal |
Updated Normal |
|
Filed Currency |
PKR |
PKR |
PKR |
PKR |
PKR |
|
Exchange Rate
(Period Average) |
62.550956 |
60.637036 |
59.865977 |
59.345369 |
57.788522 |
|
Auditor |
|
Mushtaq &
Company Chartered Accountants |
HLB Ijaz
Tabussum & Co |
Khalid Majid
Rahman |
Khalid Majid
Rahman |
|
Auditor Opinion |
|
Unqualified |
Unqualified |
Unqualified |
Unqualified |
|
|
|
|
|
|
|
|
Sales |
33.9 |
35.8 |
32.1 |
- |
- |
|
Sales Returns |
-0.3 |
-0.7 |
-0.5 |
- |
- |
|
Commisions |
-0.2 |
-0.4 |
-0.3 |
- |
- |
|
Sales |
- |
- |
- |
21.7 |
35.4 |
|
Total Sales |
33.3 |
34.8 |
31.2 |
21.7 |
35.4 |
|
|
|
|
|
|
|
|
Cost of Sales |
32.5 |
34.1 |
29.3 |
20.1 |
33.4 |
|
Advertising |
0.0 |
0.0 |
- |
- |
- |
|
Depreciation |
0.0 |
0.0 |
- |
- |
- |
|
Administration |
0.2 |
0.3 |
0.3 |
0.2 |
0.2 |
|
Selling/Distribution |
0.2 |
0.3 |
0.3 |
0.1 |
0.2 |
|
Gain on Disposal of Fixed Assets |
0.0 |
0.0 |
0.0 |
- |
- |
|
Interest on Savings |
0.0 |
0.0 |
0.0 |
- |
- |
|
Exchange Gain |
0.0 |
0.0 |
0.0 |
- |
- |
|
Other Operating Income |
0.0 |
-0.3 |
0.0 |
0.0 |
0.0 |
|
Exchange Loss on Plant and Equipment |
0.1 |
0.0 |
- |
- |
- |
|
Loss on Disposal of Assets |
0.1 |
0.0 |
- |
- |
- |
|
Other Operating Expenses |
0.0 |
0.0 |
0.0 |
- |
- |
|
Total Operating Expense |
33.1 |
34.4 |
29.9 |
20.4 |
33.8 |
|
|
|
|
|
|
|
|
Interet on Workers Participate Fund |
0.0 |
0.0 |
- |
- |
- |
|
Bank Charges |
-0.3 |
-0.2 |
- |
- |
- |
|
Financial Exp. |
-0.9 |
-1.1 |
-1.1 |
-0.6 |
-0.7 |
|
Exchange Loss |
- |
- |
0.0 |
0.0 |
0.0 |
|
Share of Loss/Profit in Associate |
-0.1 |
-0.1 |
0.0 |
- |
- |
|
Workers Profit Fund |
- |
- |
- |
0.0 |
0.0 |
|
Work. Welfare Fund |
- |
- |
- |
0.0 |
0.0 |
|
Net Income Before Taxes |
-1.1 |
-1.0 |
0.3 |
0.7 |
0.8 |
|
|
|
|
|
|
|
|
Provision for Income Taxes |
-0.5 |
-0.2 |
0.1 |
0.2 |
0.2 |
|
Net Income After Taxes |
-0.6 |
-0.8 |
0.1 |
0.4 |
0.7 |
|
|
|
|
|
|
|
|
Net Income Before Extra. Items |
-0.6 |
-0.8 |
0.1 |
0.4 |
0.7 |
|
Net Income |
-0.6 |
-0.8 |
0.1 |
0.4 |
0.7 |
|
|
|
|
|
|
|
|
Income Available to Com Excl ExtraOrd |
-0.6 |
-0.8 |
0.1 |
0.4 |
0.7 |
|
|
|
|
|
|
|
|
Income Available to Com Incl ExtraOrd |
-0.6 |
-0.8 |
0.1 |
0.4 |
0.7 |
|
|
|
|
|
|
|
|
Basic Weighted Average Shares |
1.4 |
1.4 |
1.4 |
1.4 |
1.4 |
|
Basic EPS Excluding ExtraOrdinary Items |
-0.39 |
-0.60 |
0.10 |
0.29 |
0.48 |
|
Basic EPS Including ExtraOrdinary Item |
-0.39 |
-0.60 |
0.10 |
0.29 |
0.48 |
|
Dilution Adjustment |
0.0 |
0.0 |
- |
0.0 |
0.0 |
|
Diluted Net Income |
-0.6 |
-0.8 |
0.1 |
0.4 |
0.7 |
|
Diluted Weighted Average Shares |
1.4 |
1.4 |
1.4 |
1.4 |
1.4 |
|
Diluted EPS Excluding ExtraOrd Items |
-0.39 |
-0.60 |
0.10 |
0.29 |
0.48 |
|
Diluted EPS Including ExtraOrd Items |
-0.39 |
-0.60 |
0.10 |
0.29 |
0.48 |
|
DPS-Ordinary Shares |
0.00 |
0.00 |
0.00 |
0.00 |
0.00 |
|
Gross Dividends - Common Stock |
0.0 |
0.0 |
0.0 |
0.0 |
0.0 |
|
Normalized Income Before Taxes |
-1.0 |
-1.0 |
0.3 |
0.7 |
0.8 |
|
|
|
|
|
|
|
|
Inc Tax Ex Impact of Sp Items |
-0.5 |
-0.2 |
0.1 |
0.2 |
0.2 |
|
Normalized Income After Taxes |
-0.5 |
-0.8 |
0.1 |
0.4 |
0.7 |
|
|
|
|
|
|
|
|
Normalized Inc. Avail to Com. |
-0.5 |
-0.8 |
0.1 |
0.4 |
0.7 |
|
|
|
|
|
|
|
|
Basic Normalized EPS |
-0.36 |
-0.60 |
0.10 |
0.29 |
0.48 |
|
Diluted Normalized EPS |
-0.36 |
-0.60 |
0.10 |
0.29 |
0.48 |
|
Rent |
0.0 |
0.0 |
0.0 |
0.0 |
0.0 |
|
Advertising |
0.0 |
0.0 |
0.0 |
0.0 |
0.0 |
|
Interest Expense |
0.9 |
1.1 |
1.0 |
0.6 |
0.7 |
|
Depreciation |
1.1 |
2.2 |
1.1 |
0.7 |
1.0 |
|
Current Income Tax |
0.2 |
0.2 |
0.2 |
0.1 |
0.2 |
|
Current Tax - Total |
0.2 |
0.2 |
0.2 |
0.1 |
0.2 |
|
Deferred Income Tax |
-0.7 |
-0.2 |
0.0 |
0.1 |
0.1 |
|
Deferred Tax - Total |
-0.7 |
-0.2 |
0.0 |
0.1 |
0.1 |
|
Prior Years |
0.0 |
-0.1 |
-0.1 |
0.0 |
-0.1 |
|
Income Tax - Total |
-0.5 |
-0.2 |
0.1 |
0.2 |
0.2 |
|
Service Cost - Gratuity |
0.1 |
0.0 |
0.1 |
- |
- |
|
Interest Cost - Gratuity |
0.0 |
0.0 |
0.0 |
- |
- |
|
Acturial Gain Recognised |
0.0 |
0.0 |
- |
- |
- |
|
Domestic Pension Plan Expense |
0.1 |
0.0 |
0.1 |
- |
- |
|
Defined Benifit Obligation |
0.1 |
0.2 |
- |
- |
- |
|
Total Pension Expense |
0.2 |
0.2 |
0.1 |
- |
- |
|
Discount Rate - Gratuity |
12.00% |
9.00% |
9.00% |
- |
- |
|
Compensation Rate - Gratuity |
10.00% |
8.00% |
8.00% |
- |
- |
Annual Balance Sheet
Financials in: USD
(mil)
|
|
30-Jun-2008 |
30-Jun-2007 |
30-Jun-2006 |
30-Jun-2005 |
30-Sep-2004 |
|
UpdateType/Date |
Updated Normal |
Updated Normal |
Restated Normal |
Updated Normal |
Updated Normal |
|
Filed Currency |
PKR |
PKR |
PKR |
PKR |
PKR |
|
Exchange Rate |
68.45 |
60.47 |
60.21 |
59.61 |
59.26 |
|
Auditor |
|
Mushtaq &
Company Chartered Accountants |
HLB Ijaz
Tabussum & Co |
Khalid Majid
Rahman |
Khalid Majid
Rahman |
|
Auditor Opinion |
|
Unqualified |
Unqualified |
Unqualified |
Unqualified |
|
|
|
|
|
|
|
|
Stores |
1.1 |
1.0 |
0.7 |
0.6 |
0.5 |
|
Spare Parts |
0.1 |
0.1 |
0.1 |
0.1 |
0.1 |
|
Loose Tools |
0.0 |
0.0 |
0.0 |
- |
- |
|
Raw Materials |
4.1 |
3.4 |
3.0 |
3.1 |
4.0 |
|
Work in Progress |
0.4 |
0.5 |
0.3 |
0.2 |
0.3 |
|
Finished Goods |
0.6 |
0.5 |
0.3 |
0.3 |
0.3 |
|
Raw Materials in Transit |
- |
- |
- |
0.2 |
0.0 |
|
Trade Debtors |
2.4 |
1.6 |
1.5 |
1.6 |
2.5 |
|
LT Loans |
0.0 |
0.0 |
0.0 |
0.0 |
0.0 |
|
Letter of Credit |
0.0 |
0.0 |
0.9 |
0.3 |
0.0 |
|
Supplier Advance |
0.1 |
0.6 |
0.3 |
0.2 |
0.2 |
|
Due, Associates |
0.0 |
0.0 |
0.0 |
0.0 |
0.0 |
|
Prepayments |
0.0 |
0.0 |
0.0 |
0.0 |
0.0 |
|
Other Receivables |
0.0 |
0.1 |
0.0 |
0.0 |
0.0 |
|
Advance Income Tax |
0.6 |
0.5 |
0.9 |
0.4 |
0.3 |
|
Sales Tax Refund |
0.3 |
0.3 |
0.3 |
0.1 |
0.0 |
|
Income Tax Refundable |
0.2 |
0.2 |
0.1 |
0.1 |
0.1 |
|
Cash/Bank |
0.3 |
0.1 |
0.9 |
0.4 |
0.5 |
|
Total Current Assets |
10.3 |
8.9 |
9.4 |
7.8 |
8.9 |
|
|
|
|
|
|
|
|
Land |
6.3 |
7.1 |
6.9 |
0.8 |
0.8 |
|
Buildings |
4.9 |
5.3 |
5.3 |
1.7 |
1.7 |
|
Plant/Machinery |
17.0 |
18.8 |
15.5 |
15.3 |
14.4 |
|
Vehicles |
0.3 |
0.3 |
0.3 |
0.3 |
0.2 |
|
Furn./Fittings |
0.0 |
0.0 |
0.0 |
0.0 |
0.0 |
|
Office Computer |
0.0 |
0.0 |
0.0 |
0.0 |
0.0 |
|
Office Equip. |
0.0 |
0.0 |
0.0 |
0.0 |
0.0 |
|
Tools/Equipment |
0.0 |
0.0 |
0.0 |
0.0 |
0.0 |
|
Vehicles Under Lease |
0.2 |
0.2 |
0.2 |
0.0 |
- |
|
Capital Work in Progress |
0.4 |
0.2 |
0.2 |
0.1 |
0.1 |
|
Depreciation |
-3.2 |
-2.5 |
-0.3 |
-8.8 |
-8.2 |
|
Investment |
0.2 |
0.4 |
0.4 |
0.1 |
0.1 |
|
LT Loan |
0.0 |
0.0 |
0.0 |
0.0 |
0.0 |
|
LT Deposits |
0.1 |
0.1 |
0.1 |
0.0 |
0.0 |
|
Adjustment |
- |
- |
0.3 |
- |
- |
|
Total Assets |
36.5 |
38.9 |
38.2 |
17.4 |
18.1 |
|
|
|
|
|
|
|
|
Current Portion of LT Loans |
6.5 |
5.3 |
4.1 |
5.1 |
4.1 |
|
LT Liabilities |
0.8 |
1.1 |
1.3 |
1.2 |
0.9 |
|
Trade Creditors |
4.1 |
2.7 |
2.6 |
0.7 |
3.0 |
|
Advances from Customers |
0.0 |
0.0 |
0.1 |
0.1 |
0.1 |
|
Accrued Expenses |
0.2 |
0.2 |
0.4 |
0.2 |
0.2 |
|
LT Loan Interest |
0.1 |
0.1 |
0.1 |
0.1 |
0.1 |
|
ST Loan Interest |
0.2 |
0.2 |
0.1 |
0.1 |
0.1 |
|
Workers Profit |
- |
0.0 |
0.0 |
0.0 |
0.0 |
|
Workers Welfare |
0.0 |
0.0 |
0.1 |
0.1 |
0.0 |
|
Tax, Source |
0.0 |
0.0 |
0.0 |
0.0 |
0.0 |
|
Sales Tax Payable |
- |
- |
- |
0.0 |
0.1 |
|
Unclaimed Div. |
0.0 |
0.0 |
0.0 |
0.0 |
0.0 |
|
Taxation Prov. |
0.6 |
0.6 |
0.9 |
0.4 |
0.3 |
|
Total Current Liabilities |
12.6 |
10.2 |
9.7 |
7.9 |
9.0 |
|
|
|
|
|
|
|
|
Capital Lease |
0.1 |
0.1 |
0.1 |
0.0 |
- |
|
Mark-Up Finance |
3.4 |
4.5 |
3.2 |
2.4 |
2.5 |
|
Loans from Associate Undertakings |
0.6 |
0.3 |
0.3 |
0.3 |
0.3 |
|
Loans from Directors and Sponsors |
0.7 |
0.8 |
0.8 |
0.8 |
0.8 |
|
Total Long Term Debt |
4.8 |
5.7 |
4.3 |
3.4 |
3.5 |
|
|
|
|
|
|
|
|
Deferred Tax |
3.0 |
3.4 |
0.4 |
- |
- |
|
Retirement Benefit Obligations |
0.1 |
0.2 |
0.2 |
- |
- |
|
Defered Liabilities |
- |
- |
- |
0.6 |
0.4 |
|
Total Liabilities |
20.4 |
19.5 |
14.6 |
11.9 |
12.9 |
|
|
|
|
|
|
|
|
Share Capital |
0.2 |
0.2 |
0.2 |
0.2 |
0.2 |
|
Capital Reserves |
0.1 |
0.1 |
0.1 |
0.1 |
0.1 |
|
Special Reserves |
0.0 |
0.0 |
0.0 |
0.0 |
0.0 |
|
General Reserves |
1.0 |
1.2 |
1.2 |
1.2 |
1.2 |
|
Investment in Associate |
0.0 |
0.0 |
0.0 |
- |
- |
|
Profit/Loss |
2.9 |
3.4 |
3.5 |
3.2 |
2.9 |
|
Fix. Asset Surp. |
11.8 |
14.4 |
18.6 |
0.7 |
0.7 |
|
Total Equity |
16.1 |
19.4 |
23.6 |
5.5 |
5.1 |
|
|
|
|
|
|
|
|
Total Liabilities & Shareholders' Equity |
36.5 |
38.9 |
38.2 |
17.4 |
18.1 |
|
|
|
|
|
|
|
|
S/O-Ordinary Shares |
1.4 |
1.4 |
1.4 |
1.4 |
1.4 |
|
Total Common Shares Outstanding |
1.4 |
1.4 |
1.4 |
1.4 |
1.4 |
|
Advances Fom Customers |
0.0 |
0.0 |
0.1 |
0.1 |
0.1 |
|
Full-Time Employees |
- |
- |
1,919 |
1,701 |
1,615 |
|
Number of Common Shareholders |
85 |
85 |
85 |
85 |
- |
|
Lease Payments due within 1 Year |
0.0 |
0.0 |
0.0 |
- |
- |
|
Lease Payments due within 5 Years |
0.1 |
0.1 |
0.1 |
- |
- |
|
Lease Payments Thereafter |
- |
0.0 |
0.1 |
- |
- |
|
Total Capital Leases |
0.1 |
0.1 |
0.2 |
- |
- |
|
Projected Benefit Obligation - Gratuity |
0.1 |
0.2 |
0.2 |
- |
- |
|
Funded Status |
-0.1 |
-0.2 |
-0.2 |
- |
- |
|
Total Funded Status |
-0.1 |
-0.2 |
-0.2 |
- |
- |
|
Discount Rate - Gratuity |
12.00% |
9.00% |
9.00% |
- |
- |
|
Compensation Rate - Gratuity |
10.00% |
8.00% |
8.00% |
- |
- |
|
Accrued Benefit Liability - Gratuity |
-0.1 |
-0.2 |
-0.2 |
- |
- |
|
Net Assets Recognized on Balance Sheet |
-0.1 |
-0.2 |
-0.2 |
- |
- |
Annual Cash Flows
Financials in: USD (mil)
|
|
30-Jun-2008 |
30-Jun-2007 |
30-Jun-2006 |
30-Jun-2005 |
30-Sep-2004 |
|
Period Length |
12 Months |
12 Months |
12 Months |
9 Months |
12 Months |
|
UpdateType/Date |
Updated Normal |
Updated Normal |
Reclassified
Normal |
Updated Normal |
Updated Normal |
|
Filed Currency |
PKR |
PKR |
PKR |
PKR |
PKR |
|
Exchange Rate
(Period Average) |
62.550956 |
60.637036 |
59.865977 |
59.345369 |
57.788522 |
|
Auditor |
|
Mushtaq &
Company Chartered Accountants |
HLB Ijaz
Tabussum & Co |
Khalid Majid
Rahman |
Khalid Majid
Rahman |
|
Auditor Opinion |
|
Unqualified |
Unqualified |
Unqualified |
Unqualified |
|
|
|
|
|
|
|
|
Net Income |
-1.1 |
-1.0 |
0.3 |
0.7 |
0.8 |
|
Depreciation |
1.1 |
2.2 |
1.1 |
0.7 |
1.0 |
|
Gratuity Prov. |
0.1 |
0.0 |
0.1 |
0.1 |
0.1 |
|
Diposal Fixed Asset |
0.1 |
0.0 |
0.0 |
0.0 |
0.0 |
|
Financial Charges |
1.2 |
1.3 |
1.1 |
0.6 |
0.7 |
|
Share of Profit/ Loss of Associate |
0.1 |
0.1 |
0.0 |
- |
- |
|
Other Operating Expenses |
- |
0.0 |
0.0 |
- |
- |
|
Workers' Profit Fund |
- |
- |
- |
0.0 |
0.0 |
|
Workers Welfare Fund |
- |
- |
- |
0.0 |
0.0 |
|
Stores/Spares/Stock |
-0.3 |
-0.3 |
-0.1 |
-0.1 |
-0.2 |
|
Stock in Trade |
-1.5 |
-0.7 |
0.2 |
0.7 |
-2.5 |
|
Trade Debtors |
-1.1 |
0.0 |
0.1 |
0.9 |
-0.3 |
|
Loans and Advances |
0.4 |
0.6 |
-0.6 |
- |
- |
|
Adv./Dep./Prepayment |
0.0 |
0.0 |
0.0 |
-0.3 |
-0.2 |
|
Other Receivables |
0.1 |
-0.1 |
0.0 |
- |
- |
|
Tax refunds due from Govt |
0.0 |
0.0 |
-0.2 |
0.0 |
0.1 |
|
Short Term Borrowings |
2.0 |
1.2 |
-0.9 |
0.9 |
0.2 |
|
Creditors/Accrued |
2.0 |
-0.1 |
2.1 |
-2.5 |
2.3 |
|
Interest Paid |
-1.1 |
-1.2 |
-1.0 |
-0.6 |
-0.7 |
|
Gratuity Paid |
-0.1 |
-0.1 |
-0.1 |
-0.1 |
-0.1 |
|
Workers Profit Participation Fund |
- |
- |
- |
0.0 |
0.0 |
|
Other Operating Expenses Paid |
0.0 |
-0.1 |
0.0 |
- |
- |
|
Workers Welfare Fund Paid |
- |
- |
- |
0.0 |
-0.1 |
|
Taxes Paid |
-0.1 |
-0.1 |
-0.1 |
-0.1 |
-0.2 |
|
Adjustments |
- |
0.0 |
- |
- |
- |
|
Cash from Operating Activities |
1.8 |
1.5 |
1.8 |
0.9 |
1.1 |
|
|
|
|
|
|
|
|
Sale Fixed Assets |
0.1 |
0.0 |
0.0 |
0.0 |
0.0 |
|
Capital Expenditure |
-1.1 |
-3.5 |
-2.1 |
-1.2 |
-1.2 |
|
LT Deposits |
0.0 |
0.0 |
0.0 |
0.0 |
0.0 |
|
LT Loans |
0.0 |
0.0 |
0.0 |
0.0 |
0.0 |
|
Cash from Investing Activities |
-1.0 |
-3.5 |
-2.2 |
-1.2 |
-1.2 |
|
|
|
|
|
|
|
|
Long Term Loans Received |
0.3 |
2.2 |
1.4 |
1.0 |
0.9 |
|
Long Term Loans Repaid |
-1.1 |
-0.9 |
-0.6 |
-0.8 |
-0.9 |
|
Rcvd., Associate |
- |
- |
- |
0.0 |
0.0 |
|
Lease Payment |
0.0 |
0.0 |
0.0 |
0.0 |
- |
|
Loan from Associated Undertakings |
0.3 |
0.0 |
- |
- |
- |
|
Cash from Financing Activities |
-0.5 |
1.2 |
0.8 |
0.2 |
0.0 |
|
|
|
|
|
|
|
|
Net Change in Cash |
0.2 |
-0.8 |
0.4 |
0.0 |
-0.1 |
|
|
|
|
|
|
|
|
Net Cash - Beginning Balance |
0.1 |
0.9 |
0.4 |
0.5 |
0.6 |
|
Net Cash - Ending Balance |
0.3 |
0.1 |
0.9 |
0.4 |
0.5 |
|
Cash Interest Paid |
1.1 |
1.2 |
1.0 |
0.6 |
0.7 |
|
Cash Taxes Paid |
0.1 |
0.1 |
0.1 |
0.1 |
0.2 |
Financial Health
Financials in: USD (mil)
Except for share items (millions) and per share items (actual units)
|
|||||||||||||||||||||||||||||||||||||||||||||||||||||||||||||||||||||||||||||||||||||||||||||||||||||||||||||||||
|
|||||||||||||||||||||||||||||||||||||||||||||||||||||||||||||||||||||||||||||||||||||||||||||||||||||||||||||||||
|
|||||||||||||||||||||||||||||||||||||||||||||||||||||||||||||||||||||||||||||||||||||||||||||||||||||||||||||||||
Annual Ratios
Financials in: USD (mil)
Except for share items (millions) and per share items (actual units)
|
|||||||||||||||||||||||||||||||||||||||||||||||||||||||||||||||||||||||||||||||||||||||||||||||||||||||||||||||||||||||||||||||||||||||||||||||||||||||||||||||||||||||||||||||||||||||||||||||||||||||||||||||||||||||||||||||||||||||||||||||||||||||
Annual Income Statement
Standardized
Financials in: USD (mil)
Except for share items (millions) and per share items (actual units)
|
|
30-Jun-2008 |
30-Jun-2007 |
30-Jun-2006 |
30-Jun-2005 |
30-Sep-2004 |
|
Period Length |
12 Months |
12 Months |
12 Months |
9 Months |
12 Months |
|
UpdateType/Date |
Updated Normal |
Reclassified
Normal |
Restated Normal |
Updated Normal |
Updated Normal |
|
Filed Currency |
PKR |
PKR |
PKR |
PKR |
PKR |
|
Exchange Rate
(Period Average) |
62.550956 |
60.637036 |
59.865977 |
59.345369 |
57.788522 |
|
Auditor |
|
Mushtaq &
Company Chartered Accountants |
Mushtaq &
Company Chartered Accountants |
Khalid Majid
Rahman |
Khalid Majid
Rahman |
|
Auditor Opinion |
|
Unqualified |
Unqualified |
Unqualified |
Unqualified |
|
|
|
|
|
|
|
|
Net Sales |
- |
- |
- |
21.7 |
35.4 |
|
Gross Sales |
33.9 |
35.8 |
32.1 |
- |
- |
|
Sales Returns and Allowances |
-0.6 |
-1.1 |
-0.9 |
- |
- |
|
Sales |
33.3 |
34.8 |
31.2 |
21.7 |
35.4 |
|
Total Sales |
33.3 |
34.8 |
31.2 |
21.7 |
35.4 |
|
|
|
|
|
|
|
|
Cost of Sales |
32.5 |
34.1 |
29.3 |
20.1 |
33.4 |
|
Cost of Sales, Total |
32.5 |
34.1 |
29.3 |
20.1 |
33.4 |
|
Gross Profit |
0.8 |
0.7 |
1.9 |
1.6 |
2.1 |
|
|
|
|
|
|
|
|
Selling/General/Administrative Expense |
0.4 |
0.5 |
0.6 |
0.3 |
0.5 |
|
Advertising Expense |
0.0 |
0.0 |
- |
- |
- |
|
Total Selling/General/Administrative Expenses |
0.5 |
0.5 |
0.6 |
0.3 |
0.5 |
|
Depreciation |
0.0 |
0.0 |
- |
- |
- |
|
Depreciation/Amortization |
0.0 |
0.0 |
- |
- |
- |
|
Investment Income -
Operating |
0.1 |
0.0 |
0.0 |
- |
- |
|
Interest/Investment Income - Operating |
0.1 |
0.0 |
0.0 |
- |
- |
|
Interest Expense (Income) - Net Operating Total |
0.1 |
0.0 |
0.0 |
- |
- |
|
Loss (Gain) on Sale of Assets - Operating |
0.0 |
0.0 |
0.0 |
- |
- |
|
Other Unusual Expense (Income) |
0.1 |
0.0 |
- |
- |
- |
|
Unusual Expense (Income) |
0.1 |
0.0 |
0.0 |
- |
- |
|
Other Operating Expense |
0.0 |
0.0 |
0.0 |
- |
- |
|
Other, Net |
0.0 |
-0.3 |
0.0 |
0.0 |
0.0 |
|
Other Operating Expenses, Total |
0.0 |
-0.3 |
0.0 |
0.0 |
0.0 |
|
Total Operating Expense |
33.1 |
34.4 |
29.9 |
20.4 |
33.8 |
|
|
|
|
|
|
|
|
Operating Income |
0.2 |
0.4 |
1.3 |
1.3 |
1.6 |
|
|
|
|
|
|
|
|
Interest Expense -
Non-Operating |
-0.9 |
-1.1 |
-1.1 |
-0.6 |
-0.7 |
|
Interest Expense, Net Non-Operating |
-0.9 |
-1.1 |
-1.1 |
-0.6 |
-0.7 |
|
Investment Income -
Non-Operating |
-0.1 |
-0.1 |
0.0 |
0.0 |
0.0 |
|
Interest/Investment Income - Non-Operating |
-0.1 |
-0.1 |
0.0 |
0.0 |
0.0 |
|
Interest Income (Expense) - Net Non-Operating Total |
-1.0 |
-1.1 |
-1.1 |
-0.6 |
-0.7 |
|
Other Non-Operating Income (Expense) |
-0.3 |
-0.2 |
- |
0.0 |
-0.1 |
|
Other, Net |
-0.3 |
-0.2 |
- |
0.0 |
-0.1 |
|
Income Before Tax |
-1.1 |
-1.0 |
0.3 |
0.7 |
0.8 |
|
|
|
|
|
|
|
|
Total Income Tax |
-0.5 |
-0.2 |
0.1 |
0.2 |
0.2 |
|
Income After Tax |
-0.6 |
-0.8 |
0.1 |
0.4 |
0.7 |
|
|
|
|
|
|
|
|
Net Income Before Extraord Items |
-0.6 |
-0.8 |
0.1 |
0.4 |
0.7 |
|
Net Income |
-0.6 |
-0.8 |
0.1 |
0.4 |
0.7 |
|
|
|
|
|
|
|
|
Income Available to Common Excl Extraord Items |
-0.6 |
-0.8 |
0.1 |
0.4 |
0.7 |
|
|
|
|
|
|
|
|
Income Available to Common Incl Extraord Items |
-0.6 |
-0.8 |
0.1 |
0.4 |
0.7 |
|
|
|
|
|
|
|
|
Basic/Primary Weighted Average Shares |
1.4 |
1.4 |
1.4 |
1.4 |
1.4 |
|
Basic EPS Excl Extraord Items |
-0.39 |
-0.60 |
0.10 |
0.29 |
0.48 |
|
Basic/Primary EPS Incl Extraord Items |
-0.39 |
-0.60 |
0.10 |
0.29 |
0.48 |
|
Dilution Adjustment |
0.0 |
0.0 |
- |
0.0 |
0.0 |
|
Diluted Net Income |
-0.6 |
-0.8 |
0.1 |
0.4 |
0.7 |
|
Diluted Weighted Average Shares |
1.4 |
1.4 |
1.4 |
1.4 |
1.4 |
|
Diluted EPS Excl Extraord Items |
-0.39 |
-0.60 |
0.10 |
0.29 |
0.48 |
|
Diluted EPS Incl Extraord Items |
-0.39 |
-0.60 |
0.10 |
0.29 |
0.48 |
|
Dividends per Share - Common Stock Primary Issue |
0.00 |
0.00 |
0.00 |
0.00 |
0.00 |
|
Gross Dividends - Common Stock |
0.0 |
0.0 |
0.0 |
0.0 |
0.0 |
|
Interest Expense, Supplemental |
0.9 |
1.1 |
1.0 |
0.6 |
0.7 |
|
Depreciation, Supplemental |
1.1 |
2.2 |
1.1 |
0.7 |
1.0 |
|
Total Special Items |
0.1 |
0.0 |
0.0 |
- |
- |
|
Normalized Income Before Tax |
-1.0 |
-1.0 |
0.3 |
0.7 |
0.8 |
|
|
|
|
|
|
|
|
Effect of Special Items on Income Taxes |
0.0 |
0.0 |
0.0 |
- |
- |
|
Inc Tax Ex Impact of Sp Items |
-0.5 |
-0.2 |
0.1 |
0.2 |
0.2 |
|
Normalized Income After Tax |
-0.5 |
-0.8 |
0.1 |
0.4 |
0.7 |
|
|
|
|
|
|
|
|
Normalized Inc. Avail to Com. |
-0.5 |
-0.8 |
0.1 |
0.4 |
0.7 |
|
|
|
|
|
|
|
|
Basic Normalized EPS |
-0.36 |
-0.60 |
0.10 |
0.29 |
0.48 |
|
Diluted Normalized EPS |
-0.36 |
-0.60 |
0.10 |
0.29 |
0.48 |
|
Rental Expenses |
0.0 |
0.0 |
0.0 |
0.0 |
0.0 |
|
Advertising Expense, Supplemental |
0.0 |
0.0 |
0.0 |
0.0 |
0.0 |
|
Normalized EBIT |
0.4 |
0.3 |
1.3 |
1.3 |
1.6 |
|
Normalized EBITDA |
1.5 |
2.5 |
2.4 |
2.0 |
2.5 |
|
Current Tax - Total |
0.2 |
0.2 |
0.2 |
0.1 |
0.2 |
|
Current Tax - Total |
0.2 |
0.2 |
0.2 |
0.1 |
0.2 |
|
Deferred Tax - Total |
-0.7 |
-0.2 |
0.0 |
0.1 |
0.1 |
|
Deferred Tax - Total |
-0.7 |
-0.2 |
0.0 |
0.1 |
0.1 |
|
Other Tax |
0.0 |
-0.1 |
-0.1 |
0.0 |
-0.1 |
|
Income Tax - Total |
-0.5 |
-0.2 |
0.1 |
0.2 |
0.2 |
|
Interest Cost - Domestic |
0.0 |
0.0 |
0.0 |
- |
- |
|
Service Cost - Domestic |
0.1 |
0.0 |
0.1 |
- |
- |
|
Actuarial Gains and Losses - Domestic |
0.0 |
0.0 |
- |
- |
- |
|
Domestic Pension Plan Expense |
0.1 |
0.0 |
0.1 |
- |
- |
|
Defined Contribution Expense - Domestic |
0.1 |
0.2 |
- |
- |
- |
|
Total Pension Expense |
0.2 |
0.2 |
0.1 |
- |
- |
|
Discount Rate - Domestic |
12.00% |
9.00% |
9.00% |
- |
- |
|
Compensation Rate - Domestic |
10.00% |
8.00% |
8.00% |
- |
- |
|
Total Plan Interest Cost |
0.0 |
0.0 |
0.0 |
- |
- |
|
Total Plan Service Cost |
0.1 |
0.0 |
0.1 |
- |
- |
Interim Income Statement
Standardized
Financials in: USD (mil)
Except for share items (millions) and per share items (actual units)
|
|
31-Mar-2009 |
31-Dec-2008 |
30-Sep-2008 |
30-Jun-2008 |
31-Mar-2008 |
|
Period Length |
3 Months |
3 Months |
3 Months |
3 Months |
3 Months |
|
UpdateType/Date |
Updated Normal |
Updated Normal |
Updated Normal |
Updated Normal |
Reclassified
Normal |
|
Filed Currency |
PKR |
PKR |
PKR |
PKR |
PKR |
|
Exchange Rate
(Period Average) |
79.729396 |
79.797043 |
74.087124 |
66.109892 |
62.589368 |
|
|
|
|
|
|
|
|
Net Sales |
- |
- |
8.4 |
8.7 |
- |
|
Gross Sales |
4.9 |
5.4 |
- |
- |
8.2 |
|
Sales Returns and Allowances |
0.0 |
0.0 |
- |
- |
-0.1 |
|
Sales |
4.9 |
5.4 |
8.4 |
8.7 |
8.1 |
|
Total Sales |
4.9 |
5.4 |
8.4 |
8.7 |
8.1 |
|
|
|
|
|
|
|
|
Cost of Sales |
4.8 |
5.1 |
8.0 |
7.9 |
8.3 |
|
Cost of Sales, Total |
4.8 |
5.1 |
8.0 |
7.9 |
8.3 |
|
Gross Profit |
0.0 |
0.3 |
0.4 |
0.8 |
-0.2 |
|
|
|
|
|
|
|
|
Selling/General/Administrative Expense |
0.1 |
0.1 |
0.1 |
0.1 |
0.1 |
|
Total Selling/General/Administrative Expenses |
0.1 |
0.1 |
0.1 |
0.1 |
0.1 |
|
Other Operating Expense |
0.0 |
0.0 |
0.0 |
0.1 |
0.0 |
|
Other, Net |
0.0 |
0.0 |
0.0 |
0.0 |
0.0 |
|
Other Operating Expenses, Total |
0.0 |
0.0 |
0.0 |
0.2 |
0.0 |
|
Total Operating Expense |
4.9 |
5.2 |
8.1 |
8.2 |
8.4 |
|
|
|
|
|
|
|
|
Operating Income |
0.0 |
0.2 |
0.3 |
0.5 |
-0.3 |
|
|
|
|
|
|
|
|
Investment Income -
Non-Operating |
0.0 |
0.0 |
0.0 |
-0.1 |
0.0 |
|
Interest/Investment Income - Non-Operating |
0.0 |
0.0 |
0.0 |
-0.1 |
0.0 |
|
Interest Income (Expense) - Net Non-Operating |
-0.3 |
-0.4 |
-0.3 |
-0.3 |
-0.4 |
|
Interest Income (Expense) - Net Non-Operating Total |
-0.3 |
-0.4 |
-0.3 |
-0.4 |
-0.4 |
|
Income Before Tax |
-0.4 |
-0.2 |
-0.1 |
0.1 |
-0.7 |
|
|
|
|
|
|
|
|
Total Income Tax |
0.0 |
-0.1 |
0.0 |
-0.7 |
0.0 |
|
Income After Tax |
-0.4 |
-0.2 |
-0.1 |
0.7 |
-0.7 |
|
|
|
|
|
|
|
|
Net Income Before Extraord Items |
-0.4 |
-0.2 |
-0.1 |
0.7 |
-0.7 |
|
Net Income |
-0.4 |
-0.2 |
-0.1 |
0.7 |
-0.7 |
|
|
|
|
|
|
|
|
Income Available to Common Excl Extraord Items |
-0.4 |
-0.2 |
-0.1 |
0.7 |
-0.7 |
|
|
|
|
|
|
|
|
Income Available to Common Incl Extraord Items |
-0.4 |
-0.2 |
-0.1 |
0.7 |
-0.7 |
|
|
|
|
|
|
|
|
Basic/Primary Weighted Average Shares |
1.4 |
1.4 |
1.4 |
1.4 |
1.4 |
|
Basic EPS Excl Extraord Items |
-0.26 |
-0.12 |
-0.05 |
0.53 |
-0.50 |
|
Basic/Primary EPS Incl Extraord Items |
-0.26 |
-0.12 |
-0.05 |
0.53 |
-0.50 |
|
Dilution Adjustment |
0.0 |
0.0 |
0.0 |
0.0 |
0.0 |
|
Diluted Net Income |
-0.4 |
-0.2 |
-0.1 |
0.7 |
-0.7 |
|
Diluted Weighted Average Shares |
1.4 |
1.4 |
1.4 |
1.4 |
1.4 |
|
Diluted EPS Excl Extraord Items |
-0.26 |
-0.12 |
-0.05 |
0.53 |
-0.50 |
|
Diluted EPS Incl Extraord Items |
-0.26 |
-0.12 |
-0.05 |
0.53 |
-0.50 |
|
Dividends per Share - Common Stock Primary Issue |
0.00 |
0.00 |
0.00 |
0.00 |
0.00 |
|
Gross Dividends - Common Stock |
0.0 |
0.0 |
0.0 |
0.0 |
0.0 |
|
Depreciation, Supplemental |
0.2 |
0.2 |
0.2 |
- |
0.5 |
|
Normalized Income Before Tax |
-0.4 |
-0.2 |
-0.1 |
0.1 |
-0.7 |
|
|
|
|
|
|
|
|
Inc Tax Ex Impact of Sp Items |
0.0 |
-0.1 |
0.0 |
-0.7 |
0.0 |
|
Normalized Income After Tax |
-0.4 |
-0.2 |
-0.1 |
0.7 |
-0.7 |
|
|
|
|
|
|
|
|
Normalized Inc. Avail to Com. |
-0.4 |
-0.2 |
-0.1 |
0.7 |
-0.7 |
|
|
|
|
|
|
|
|
Basic Normalized EPS |
-0.26 |
-0.12 |
-0.05 |
0.53 |
-0.50 |
|
Diluted Normalized EPS |
-0.26 |
-0.12 |
-0.05 |
0.53 |
-0.50 |
|
Normalized EBIT |
0.0 |
0.2 |
0.3 |
0.5 |
-0.3 |
|
Normalized EBITDA |
0.2 |
0.3 |
0.5 |
0.5 |
0.3 |
Annual Balance Sheet
Standardized
Financials in: USD (mil)
Except for share items (millions) and per share items (actual units)
|
|
30-Jun-2008 |
30-Jun-2007 |
30-Jun-2006 |
30-Jun-2005 |
30-Sep-2004 |
|
UpdateType/Date |
Updated Normal |
Updated Normal |
Restated Normal |
Updated Normal |
Updated Normal |
|
Filed Currency |
PKR |
PKR |
PKR |
PKR |
PKR |
|
Exchange Rate |
68.45 |
60.47 |
60.21 |
59.61 |
59.26 |
|
Auditor |
|
Mushtaq &
Company Chartered Accountants |
Mushtaq &
Company Chartered Accountants |
Khalid Majid
Rahman |
Khalid Majid
Rahman |
|
Auditor Opinion |
|
Unqualified |
Unqualified |
Unqualified |
Unqualified |
|
|
|
|
|
|
|
|
Cash |
0.3 |
0.1 |
0.9 |
0.4 |
0.5 |
|
Cash and Short Term Investments |
0.3 |
0.1 |
0.9 |
0.4 |
0.5 |
|
Trade Accounts Receivable - Net |
2.4 |
1.6 |
1.5 |
1.6 |
2.5 |
|
Notes Receivable - Short Term |
0.1 |
0.0 |
0.9 |
0.3 |
0.1 |
|
Other Receivables |
0.2 |
0.3 |
0.2 |
0.1 |
0.1 |
|
Total Receivables, Net |
2.6 |
1.9 |
2.6 |
2.1 |
2.7 |
|
Inventories - Finished Goods |
0.6 |
0.5 |
0.3 |
0.3 |
0.3 |
|
Inventories - Work In Progress |
0.4 |
0.5 |
0.3 |
0.2 |
0.3 |
|
Inventories - Raw Materials |
4.1 |
3.4 |
3.0 |
3.3 |
4.0 |
|
Inventories - Other |
1.2 |
1.1 |
0.8 |
0.7 |
0.6 |
|
Total Inventory |
6.4 |
5.5 |
4.5 |
4.6 |
5.1 |
|
Prepaid Expenses |
0.0 |
0.0 |
0.0 |
0.0 |
0.0 |
|
Other Current Assets |
0.9 |
1.4 |
1.5 |
0.7 |
0.6 |
|
Other Current Assets, Total |
0.9 |
1.4 |
1.5 |
0.7 |
0.6 |
|
Total Current Assets |
10.3 |
8.9 |
9.4 |
7.8 |
8.9 |
|
|
|
|
|
|
|
|
Buildings |
4.9 |
5.3 |
5.3 |
1.7 |
1.7 |
|
Land/Improvements |
6.3 |
7.1 |
6.9 |
0.8 |
0.8 |
|
Machinery/Equipment |
17.4 |
19.2 |
15.9 |
15.7 |
14.7 |
|
Construction in
Progress |
0.4 |
0.2 |
0.2 |
0.1 |
0.1 |
|
Leases |
0.2 |
0.2 |
0.2 |
0.0 |
- |
|
Property/Plant/Equipment - Gross |
29.1 |
32.0 |
28.3 |
18.4 |
17.3 |
|
Accumulated Depreciation |
-3.2 |
-2.5 |
-0.3 |
-8.8 |
-8.2 |
|
Property/Plant/Equipment - Net |
25.9 |
29.5 |
28.0 |
9.5 |
9.1 |
|
LT Investment - Affiliate Companies |
0.2 |
0.4 |
0.4 |
0.1 |
0.1 |
|
LT Investments - Other |
0.1 |
0.1 |
0.1 |
0.0 |
0.0 |
|
Long Term Investments |
0.3 |
0.4 |
0.5 |
0.1 |
0.1 |
|
Note Receivable - Long Term |
0.0 |
0.0 |
0.0 |
0.0 |
0.0 |
|
Other Long Term Assets |
- |
- |
0.3 |
- |
- |
|
Other Long Term Assets, Total |
- |
- |
0.3 |
- |
- |
|
Total Assets |
36.5 |
38.9 |
38.2 |
17.4 |
18.1 |
|
|
|
|
|
|
|
|
Accounts Payable |
4.1 |
2.7 |
2.6 |
0.7 |
3.0 |
|
Accrued Expenses |
0.5 |
0.5 |
0.6 |
0.4 |
0.3 |
|
Notes Payable/Short Term Debt |
0.0 |
0.0 |
0.0 |
0.0 |
0.0 |
|
Current Portion - Long Term Debt/Capital Leases |
7.3 |
6.4 |
5.4 |
6.3 |
5.1 |
|
Customer Advances |
0.0 |
0.0 |
0.1 |
0.1 |
0.1 |
|
Income Taxes Payable |
0.6 |
0.6 |
0.9 |
0.4 |
0.3 |
|
Other Current Liabilities |
0.0 |
0.0 |
0.1 |
0.1 |
0.2 |
|
Other Current liabilities, Total |
0.7 |
0.6 |
1.1 |
0.5 |
0.6 |
|
Total Current Liabilities |
12.6 |
10.2 |
9.7 |
7.9 |
9.0 |
|
|
|
|
|
|
|
|
Long Term Debt |
4.7 |
5.6 |
4.2 |
3.4 |
3.5 |
|
Capital Lease Obligations |
0.1 |
0.1 |
0.1 |
0.0 |
- |
|
Total Long Term Debt |
4.8 |
5.7 |
4.3 |
3.4 |
3.5 |
|
Total Debt |
12.1 |
12.1 |
9.7 |
9.7 |
8.6 |
|
|
|
|
|
|
|
|
Deferred Income Tax - LT Liability |
3.0 |
3.4 |
0.4 |
- |
- |
|
Deferred Income Tax |
3.0 |
3.4 |
0.4 |
- |
- |
|
Pension Benefits - Underfunded |
0.1 |
0.2 |
0.2 |
- |
- |
|
Other Long Term Liabilities |
- |
- |
- |
0.6 |
0.4 |
|
Other Liabilities, Total |
0.1 |
0.2 |
0.2 |
0.6 |
0.4 |
|
Total Liabilities |
20.4 |
19.5 |
14.6 |
11.9 |
12.9 |
|
|
|
|
|
|
|
|
Common Stock |
0.2 |
0.2 |
0.2 |
0.2 |
0.2 |
|
Common Stock |
0.2 |
0.2 |
0.2 |
0.2 |
0.2 |
|
Additional Paid-In Capital |
0.1 |
0.1 |
0.1 |
0.1 |
0.1 |
|
Retained Earnings (Accumulated Deficit) |
4.0 |
4.6 |
4.7 |
4.4 |
4.0 |
|
Unrealized Gain (Loss) |
11.8 |
14.4 |
18.6 |
0.7 |
0.7 |
|
Total Equity |
16.1 |
19.4 |
23.6 |
5.5 |
5.1 |
|
|
|
|
|
|
|
|
Total Liabilities & Shareholders’ Equity |
36.5 |
38.9 |
38.2 |
17.4 |
18.1 |
|
|
|
|
|
|
|
|
Shares Outstanding - Common Stock Primary
Issue |
1.4 |
1.4 |
1.4 |
1.4 |
1.4 |
|
Total Common Shares Outstanding |
1.4 |
1.4 |
1.4 |
1.4 |
1.4 |
|
Employees |
- |
- |
1,919 |
1,701 |
1,615 |
|
Number of Common Shareholders |
85 |
85 |
85 |
85 |
- |
|
Deferred Sales - Current |
0.0 |
0.0 |
0.1 |
0.1 |
0.1 |
|
Total Capital Leases, Supplemental |
0.1 |
0.1 |
0.2 |
- |
- |
|
Capital Lease Payments Due in Year 1 |
0.0 |
0.0 |
0.0 |
- |
- |
|
Capital Lease Payments Due in Year 2 |
0.0 |
0.0 |
0.0 |
- |
- |
|
Capital Lease Payments Due in Year 3 |
0.0 |
0.0 |
0.0 |
- |
- |
|
Capital Lease Payments Due in Year 4 |
0.0 |
0.0 |
0.0 |
- |
- |
|
Capital Lease Payments Due in Year 5 |
0.0 |
0.0 |
0.0 |
- |
- |
|
Capital Lease Payments Due in 2-3 Years |
0.0 |
0.1 |
0.0 |
- |
- |
|
Capital Lease Payments Due in 4-5 Years |
0.0 |
0.1 |
0.0 |
- |
- |
|
Cap. Lease Pymts. Due in Year 6 & Beyond |
- |
0.0 |
0.1 |
- |
- |
|
Pension Obligation - Domestic |
0.1 |
0.2 |
0.2 |
- |
- |
|
Funded Status - Domestic |
-0.1 |
-0.2 |
-0.2 |
- |
- |
|
Total Funded Status |
-0.1 |
-0.2 |
-0.2 |
- |
- |
|
Discount Rate - Domestic |
12.00% |
9.00% |
9.00% |
- |
- |
|
Compensation Rate - Domestic |
10.00% |
8.00% |
8.00% |
- |
- |
|
Accrued Liabilities - Domestic |
-0.1 |
-0.2 |
-0.2 |
- |
- |
|
Net Assets Recognized on Balance Sheet |
-0.1 |
-0.2 |
-0.2 |
- |
- |
|
Total Plan Obligations |
0.1 |
0.2 |
0.2 |
- |
- |
Interim Balance Sheet
Standardized
Financials in: USD (mil)
Except for share items (millions) and per share items (actual units)
|
|
31-Mar-2009 |
31-Dec-2008 |
30-Sep-2008 |
30-Jun-2008 |
31-Mar-2008 |
|
UpdateType/Date |
Updated Normal |
Updated Normal |
Updated Normal |
Updated Normal |
Updated Normal |
|
Filed Currency |
PKR |
PKR |
PKR |
PKR |
PKR |
|
Exchange Rate |
80.51 |
79.125 |
78.25 |
68.45 |
62.695 |
|
|
|
|
|
|
|
|
Cash |
0.4 |
0.3 |
0.2 |
0.3 |
0.2 |
|
Cash and Short Term Investments |
0.4 |
0.3 |
0.2 |
0.3 |
0.2 |
|
Trade Accounts Receivable - Net |
1.5 |
2.0 |
1.8 |
2.4 |
1.8 |
|
Notes Receivable - Short Term |
0.9 |
0.1 |
0.6 |
0.2 |
0.5 |
|
Other Receivables |
0.0 |
0.0 |
0.9 |
0.0 |
1.1 |
|
Total Receivables, Net |
2.4 |
2.1 |
3.3 |
2.6 |
3.4 |
|
Inventories - Other |
3.8 |
4.7 |
4.3 |
6.4 |
9.7 |
|
Total Inventory |
3.8 |
4.7 |
4.3 |
6.4 |
9.7 |
|
Prepaid Expenses |
0.0 |
0.0 |
0.1 |
0.0 |
0.0 |
|
Other Current Assets |
0.9 |
0.9 |
- |
1.0 |
- |
|
Other Current Assets, Total |
0.9 |
0.9 |
- |
1.0 |
- |
|
Total Current Assets |
7.5 |
8.0 |
7.9 |
10.3 |
13.4 |
|
|
|
|
|
|
|
|
Construction in
Progress |
0.3 |
0.3 |
0.3 |
0.4 |
0.2 |
|
Property/Plant/Equipment - Gross |
0.3 |
0.3 |
0.3 |
0.4 |
0.2 |
|
Property/Plant/Equipment - Net |
22.3 |
22.7 |
22.5 |
25.9 |
27.5 |
|
LT Investment - Affiliate Companies |
0.2 |
0.2 |
0.2 |
0.2 |
0.3 |
|
LT Investments - Other |
0.0 |
0.0 |
0.1 |
0.1 |
0.1 |
|
Long Term Investments |
0.2 |
0.2 |
0.2 |
0.3 |
0.4 |
|
Note Receivable - Long Term |
0.0 |
0.0 |
0.0 |
0.0 |
0.0 |
|
Total Assets |
30.0 |
30.9 |
30.7 |
36.5 |
41.3 |
|
|
|
|
|
|
|
|
Accounts Payable |
1.9 |
2.6 |
2.8 |
4.4 |
5.3 |
|
Accrued Expenses |
0.4 |
0.4 |
0.3 |
0.3 |
0.3 |
|
Notes Payable/Short Term Debt |
6.4 |
6.0 |
5.8 |
6.5 |
8.2 |
|
Current Portion - Long Term Debt/Capital Leases |
0.9 |
0.8 |
0.6 |
0.8 |
0.7 |
|
Income Taxes Payable |
0.6 |
0.6 |
0.6 |
0.6 |
0.7 |
|
Other Current liabilities, Total |
0.6 |
0.6 |
0.6 |
0.6 |
0.7 |
|
Total Current Liabilities |
10.2 |
10.4 |
10.1 |
12.6 |
15.3 |
|
|
|
|
|
|
|
|
Long Term Debt |
4.2 |
4.3 |
3.8 |
4.7 |
5.2 |
|
Capital Lease Obligations |
0.1 |
0.1 |
0.1 |
0.1 |
0.1 |
|
Total Long Term Debt |
4.3 |
4.3 |
3.9 |
4.8 |
5.3 |
|
Total Debt |
11.6 |
11.2 |
10.3 |
12.1 |
14.2 |
|
|
|
|
|
|
|
|
Other Long Term Liabilities |
2.4 |
2.5 |
2.6 |
3.1 |
3.5 |
|
Other Liabilities, Total |
2.4 |
2.5 |
2.6 |
3.1 |
3.5 |
|
Total Liabilities |
16.9 |
17.2 |
16.6 |
20.4 |
24.0 |
|
|
|
|
|
|
|
|
Common Stock |
0.2 |
0.2 |
0.2 |
0.2 |
0.2 |
|
Common Stock |
0.2 |
0.2 |
0.2 |
0.2 |
0.2 |
|
Retained Earnings (Accumulated Deficit) |
3.1 |
3.4 |
3.6 |
4.1 |
3.8 |
|
Unrealized Gain (Loss) |
9.9 |
10.1 |
10.3 |
11.8 |
13.3 |
|
Total Equity |
13.1 |
13.7 |
14.0 |
16.1 |
17.3 |
|
|
|
|
|
|
|
|
Total Liabilities & Shareholders’ Equity |
30.0 |
30.9 |
30.7 |
36.5 |
41.3 |
|
|
|
|
|
|
|
|
Shares Outstanding - Common Stock Primary
Issue |
1.4 |
1.4 |
1.4 |
1.4 |
1.4 |
|
Total Common Shares Outstanding |
1.4 |
1.4 |
1.4 |
1.4 |
1.4 |
Annual Cash Flows
Standardized
Financials in: USD (mil)
Except for share items (millions) and per share items (actual units)
|
|
30-Jun-2008 |
30-Jun-2007 |
30-Jun-2006 |
30-Jun-2005 |
30-Sep-2004 |
|
Period Length |
12 Months |
12 Months |
12 Months |
9 Months |
12 Months |
|
UpdateType/Date |
Updated Normal |
Updated Normal |
Reclassified
Normal |
Updated Normal |
Updated Normal |
|
Filed Currency |
PKR |
PKR |
PKR |
PKR |
PKR |
|
Exchange Rate
(Period Average) |
62.550956 |
60.637036 |
59.865977 |
59.345369 |
57.788522 |
|
Auditor |
|
Mushtaq &
Company Chartered Accountants |
Mushtaq &
Company Chartered Accountants |
Khalid Majid
Rahman |
Khalid Majid
Rahman |
|
Auditor Opinion |
|
Unqualified |
Unqualified |
Unqualified |
Unqualified |
|
|
|
|
|
|
|
|
Net Income/Starting Line |
-1.1 |
-1.0 |
0.3 |
0.7 |
0.8 |
|
Depreciation |
1.1 |
2.2 |
1.1 |
0.7 |
1.0 |
|
Depreciation/Depletion |
1.1 |
2.2 |
1.1 |
0.7 |
1.0 |
|
Unusual Items |
0.1 |
0.0 |
0.0 |
0.0 |
0.0 |
|
Equity in Net Earnings (Loss) |
0.1 |
0.1 |
0.0 |
- |
- |
|
Other Non-Cash Items |
1.3 |
1.3 |
1.2 |
0.7 |
0.8 |
|
Non-Cash Items |
1.4 |
1.4 |
1.1 |
0.7 |
0.8 |
|
Accounts Receivable |
-1.1 |
0.0 |
0.1 |
0.9 |
-0.3 |
|
Inventories |
-1.7 |
-1.0 |
0.0 |
0.5 |
-2.7 |
|
Prepaid Expenses |
0.0 |
0.0 |
0.0 |
-0.3 |
-0.2 |
|
Other Assets |
0.5 |
0.5 |
-0.8 |
0.0 |
0.1 |
|
Accounts Payable |
2.0 |
-0.1 |
2.1 |
-2.5 |
2.3 |
|
Other Liabilities |
2.0 |
1.2 |
-0.9 |
0.9 |
0.2 |
|
Other Operating Cash Flow |
-1.4 |
-1.5 |
-1.3 |
-0.7 |
-1.0 |
|
Changes in Working Capital |
0.3 |
-1.0 |
-0.8 |
-1.1 |
-1.4 |
|
Cash from Operating Activities |
1.8 |
1.5 |
1.8 |
0.9 |
1.1 |
|
|
|
|
|
|
|
|
Purchase of Fixed Assets |
-1.1 |
-3.5 |
-2.1 |
-1.2 |
-1.2 |
|
Capital Expenditures |
-1.1 |
-3.5 |
-2.1 |
-1.2 |
-1.2 |
|
Sale of Fixed Assets |
0.1 |
0.0 |
0.0 |
0.0 |
0.0 |
|
Other Investing Cash Flow |
0.0 |
0.0 |
0.0 |
0.0 |
0.0 |
|
Other Investing Cash Flow Items, Total |
0.0 |
0.0 |
0.0 |
0.0 |
0.0 |
|
Cash from Investing Activities |
-1.0 |
-3.5 |
-2.2 |
-1.2 |
-1.2 |
|
|
|
|
|
|
|
|
Other Financing Cash Flow |
0.3 |
0.0 |
- |
0.0 |
0.0 |
|
Financing Cash Flow Items |
0.3 |
0.0 |
- |
0.0 |
0.0 |
|
Long Term Debt Issued |
0.3 |
2.2 |
1.4 |
1.0 |
0.9 |
|
Long Term Debt
Reduction |
-1.1 |
-1.0 |
-0.6 |
-0.8 |
-0.9 |
|
Long Term Debt, Net |
-0.8 |
1.2 |
0.8 |
0.2 |
0.0 |
|
Issuance (Retirement) of Debt, Net |
-0.8 |
1.2 |
0.8 |
0.2 |
0.0 |
|
Cash from Financing Activities |
-0.5 |
1.2 |
0.8 |
0.2 |
0.0 |
|
|
|
|
|
|
|
|
Net Change in Cash |
0.2 |
-0.8 |
0.4 |
0.0 |
-0.1 |
|
|
|
|
|
|
|
|
Net Cash - Beginning Balance |
0.1 |
0.9 |
0.4 |
0.5 |
0.6 |
|
Net Cash - Ending Balance |
0.3 |
0.1 |
0.9 |
0.4 |
0.5 |
|
Cash Interest Paid |
1.1 |
1.2 |
1.0 |
0.6 |
0.7 |
|
Cash Taxes Paid |
0.1 |
0.1 |
0.1 |
0.1 |
0.2 |
Interim Cash Flows
Standardized
Financials in: USD (mil)
Except for share items (millions) and per share items (actual units)
|
|
31-Mar-2009 |
31-Dec-2008 |
30-Sep-2008 |
30-Jun-2008 |
31-Mar-2008 |
|
Period Length |
9 Months |
6 Months |
3 Months |
12 Months |
9 Months |
|
UpdateType/Date |
Updated Normal |
Updated Normal |
Updated Normal |
Updated Normal |
Updated Normal |
|
Filed Currency |
PKR |
PKR |
PKR |
PKR |
PKR |
|
Exchange Rate (Period
Average) |
77.851736 |
76.935014 |
74.087124 |
62.550956 |
61.348709 |
|
|
|
|
|
|
|
|
Net Income/Starting Line |
-0.7 |
-0.3 |
-0.1 |
-1.1 |
-1.1 |
|
Depreciation |
0.6 |
0.4 |
0.2 |
1.1 |
1.7 |
|
Depreciation/Depletion |
0.6 |
0.4 |
0.2 |
1.1 |
1.7 |
|
Unusual Items |
0.0 |
0.0 |
0.0 |
0.1 |
0.0 |
|
Equity in Net Earnings (Loss) |
0.0 |
0.0 |
0.0 |
0.1 |
0.0 |
|
Other Non-Cash Items |
1.0 |
0.7 |
0.3 |
1.3 |
0.9 |
|
Non-Cash Items |
1.1 |
0.7 |
0.3 |
1.4 |
0.9 |
|
Accounts Receivable |
0.6 |
0.1 |
0.3 |
-1.1 |
-0.3 |
|
Inventories |
1.7 |
0.9 |
1.4 |
-1.7 |
-4.5 |
|
Prepaid Expenses |
0.0 |
0.0 |
-0.1 |
0.0 |
0.0 |
|
Other Assets |
-0.7 |
0.0 |
-0.5 |
0.5 |
0.1 |
|
Accounts Payable |
-1.9 |
-1.3 |
-1.1 |
2.0 |
2.6 |
|
Other Liabilities |
0.9 |
0.5 |
0.1 |
2.0 |
3.2 |
|
Other Operating Cash Flow |
-1.1 |
-0.7 |
-0.3 |
-1.4 |
-0.9 |
|
Changes in Working Capital |
-0.5 |
-0.5 |
-0.1 |
0.3 |
0.1 |
|
Cash from Operating Activities |
0.5 |
0.3 |
0.3 |
1.8 |
1.5 |
|
|
|
|
|
|
|
|
Purchase of Fixed Assets |
-0.9 |
-0.7 |
-0.1 |
-1.1 |
-0.8 |
|
Capital Expenditures |
-0.9 |
-0.7 |
-0.1 |
-1.1 |
-0.8 |
|
Sale of Fixed Assets |
0.0 |
0.0 |
0.0 |
0.1 |
0.1 |
|
Other Investing Cash Flow |
0.0 |
0.0 |
- |
0.0 |
0.0 |
|
Other Investing Cash Flow Items, Total |
0.0 |
0.0 |
0.0 |
0.0 |
0.0 |
|
Cash from Investing Activities |
-0.9 |
-0.7 |
-0.1 |
-1.0 |
-0.8 |
|
|
|
|
|
|
|
|
Other Financing Cash Flow |
0.2 |
0.1 |
-0.3 |
0.3 |
0.1 |
|
Financing Cash Flow Items |
0.2 |
0.1 |
-0.3 |
0.3 |
0.1 |
|
Long Term Debt Issued |
1.2 |
0.6 |
0.1 |
0.3 |
0.4 |
|
Long Term Debt
Reduction |
-0.8 |
-0.4 |
-0.2 |
-1.1 |
-1.1 |
|
Long Term Debt, Net |
0.3 |
0.2 |
-0.1 |
-0.8 |
-0.6 |
|
Issuance (Retirement) of Debt, Net |
0.3 |
0.2 |
-0.1 |
-0.8 |
-0.6 |
|
Cash from Financing Activities |
0.5 |
0.3 |
-0.4 |
-0.5 |
-0.6 |
|
|
|
|
|
|
|
|
Net Change in Cash |
0.1 |
0.0 |
-0.1 |
0.2 |
0.1 |
|
|
|
|
|
|
|
|
Net Cash - Beginning Balance |
0.3 |
0.3 |
0.3 |
0.1 |
0.1 |
|
Net Cash - Ending Balance |
0.4 |
0.3 |
0.2 |
0.3 |
0.2 |
|
Cash Interest Paid |
0.9 |
0.6 |
0.3 |
1.1 |
0.8 |
|
Cash Taxes Paid |
0.1 |
0.1 |
0.0 |
0.1 |
0.1 |
Annual Income Statement
As Reported
Financials in: USD (mil)
Except for share items (millions) and per share items (actual units)
|
|
30-Jun-2008 |
30-Jun-2007 |
30-Jun-2006 |
30-Jun-2005 |
30-Sep-2004 |
|
Period Length |
12 Months |
12 Months |
12 Months |
9 Months |
12 Months |
|
UpdateType/Date |
Updated Normal |
Reclassified
Normal |
Restated Normal |
Updated Normal |
Updated Normal |
|
Filed Currency |
PKR |
PKR |
PKR |
PKR |
PKR |
|
Exchange Rate
(Period Average) |
62.550956 |
60.637036 |
59.865977 |
59.345369 |
57.788522 |
|
Auditor |
|
Mushtaq &
Company Chartered Accountants |
HLB Ijaz
Tabussum & Co |
Khalid Majid
Rahman |
Khalid Majid
Rahman |
|
Auditor Opinion |
|
Unqualified |
Unqualified |
Unqualified |
Unqualified |
|
|
|
|
|
|
|
|
Sales |
33.9 |
35.8 |
32.1 |
- |
- |
|
Sales Returns |
-0.3 |
-0.7 |
-0.5 |
- |
- |
|
Commisions |
-0.2 |
-0.4 |
-0.3 |
- |
- |
|
Sales |
- |
- |
- |
21.7 |
35.4 |
|
Total Sales |
33.3 |
34.8 |
31.2 |
21.7 |
35.4 |
|
|
|
|
|
|
|
|
Cost of Sales |
32.5 |
34.1 |
29.3 |
20.1 |
33.4 |
|
Advertising |
0.0 |
0.0 |
- |
- |
- |
|
Depreciation |
0.0 |
0.0 |
- |
- |
- |
|
Administration |
0.2 |
0.3 |
0.3 |
0.2 |
0.2 |
|
Selling/Distribution |
0.2 |
0.3 |
0.3 |
0.1 |
0.2 |
|
Gain on Disposal of Fixed Assets |
0.0 |
0.0 |
0.0 |
- |
- |
|
Interest on Savings |
0.0 |
0.0 |
0.0 |
- |
- |
|
Exchange Gain |
0.0 |
0.0 |
0.0 |
- |
- |
|
Other Operating Income |
0.0 |
-0.3 |
0.0 |
0.0 |
0.0 |
|
Exchange Loss on Plant and Equipment |
0.1 |
0.0 |
- |
- |
- |
|
Loss on Disposal of Assets |
0.1 |
0.0 |
- |
- |
- |
|
Other Operating Expenses |
0.0 |
0.0 |
0.0 |
- |
- |
|
Total Operating Expense |
33.1 |
34.4 |
29.9 |
20.4 |
33.8 |
|
|
|
|
|
|
|
|
Interet on Workers Participate Fund |
0.0 |
0.0 |
- |
- |
- |
|
Bank Charges |
-0.3 |
-0.2 |
- |
- |
- |
|
Financial Exp. |
-0.9 |
-1.1 |
-1.1 |
-0.6 |
-0.7 |
|
Exchange Loss |
- |
- |
0.0 |
0.0 |
0.0 |
|
Share of Loss/Profit in Associate |
-0.1 |
-0.1 |
0.0 |
- |
- |
|
Workers Profit Fund |
- |
- |
- |
0.0 |
0.0 |
|
Work. Welfare Fund |
- |
- |
- |
0.0 |
0.0 |
|
Net Income Before Taxes |
-1.1 |
-1.0 |
0.3 |
0.7 |
0.8 |
|
|
|
|
|
|
|
|
Provision for Income Taxes |
-0.5 |
-0.2 |
0.1 |
0.2 |
0.2 |
|
Net Income After Taxes |
-0.6 |
-0.8 |
0.1 |
0.4 |
0.7 |
|
|
|
|
|
|
|
|
Net Income Before Extra. Items |
-0.6 |
-0.8 |
0.1 |
0.4 |
0.7 |
|
Net Income |
-0.6 |
-0.8 |
0.1 |
0.4 |
0.7 |
|
|
|
|
|
|
|
|
Income Available to Com Excl ExtraOrd |
-0.6 |
-0.8 |
0.1 |
0.4 |
0.7 |
|
|
|
|
|
|
|
|
Income Available to Com Incl ExtraOrd |
-0.6 |
-0.8 |
0.1 |
0.4 |
0.7 |
|
|
|
|
|
|
|
|
Basic Weighted Average Shares |
1.4 |
1.4 |
1.4 |
1.4 |
1.4 |
|
Basic EPS Excluding ExtraOrdinary Items |
-0.39 |
-0.60 |
0.10 |
0.29 |
0.48 |
|
Basic EPS Including ExtraOrdinary Item |
-0.39 |
-0.60 |
0.10 |
0.29 |
0.48 |
|
Dilution Adjustment |
0.0 |
0.0 |
- |
0.0 |
0.0 |
|
Diluted Net Income |
-0.6 |
-0.8 |
0.1 |
0.4 |
0.7 |
|
Diluted Weighted Average Shares |
1.4 |
1.4 |
1.4 |
1.4 |
1.4 |
|
Diluted EPS Excluding ExtraOrd Items |
-0.39 |
-0.60 |
0.10 |
0.29 |
0.48 |
|
Diluted EPS Including ExtraOrd Items |
-0.39 |
-0.60 |
0.10 |
0.29 |
0.48 |
|
DPS-Ordinary Shares |
0.00 |
0.00 |
0.00 |
0.00 |
0.00 |
|
Gross Dividends - Common Stock |
0.0 |
0.0 |
0.0 |
0.0 |
0.0 |
|
Normalized Income Before Taxes |
-1.0 |
-1.0 |
0.3 |
0.7 |
0.8 |
|
|
|
|
|
|
|
|
Inc Tax Ex Impact of Sp Items |
-0.5 |
-0.2 |
0.1 |
0.2 |
0.2 |
|
Normalized Income After Taxes |
-0.5 |
-0.8 |
0.1 |
0.4 |
0.7 |
|
|
|
|
|
|
|
|
Normalized Inc. Avail to Com. |
-0.5 |
-0.8 |
0.1 |
0.4 |
0.7 |
|
|
|
|
|
|
|
|
Basic Normalized EPS |
-0.36 |
-0.60 |
0.10 |
0.29 |
0.48 |
|
Diluted Normalized EPS |
-0.36 |
-0.60 |
0.10 |
0.29 |
0.48 |
|
Rent |
0.0 |
0.0 |
0.0 |
0.0 |
0.0 |
|
Advertising |
0.0 |
0.0 |
0.0 |
0.0 |
0.0 |
|
Interest Expense |
0.9 |
1.1 |
1.0 |
0.6 |
0.7 |
|
Depreciation |
1.1 |
2.2 |
1.1 |
0.7 |
1.0 |
|
Current Income Tax |
0.2 |
0.2 |
0.2 |
0.1 |
0.2 |
|
Current Tax - Total |
0.2 |
0.2 |
0.2 |
0.1 |
0.2 |
|
Deferred Income Tax |
-0.7 |
-0.2 |
0.0 |
0.1 |
0.1 |
|
Deferred Tax - Total |
-0.7 |
-0.2 |
0.0 |
0.1 |
0.1 |
|
Prior Years |
0.0 |
-0.1 |
-0.1 |
0.0 |
-0.1 |
|
Income Tax - Total |
-0.5 |
-0.2 |
0.1 |
0.2 |
0.2 |
|
Service Cost - Gratuity |
0.1 |
0.0 |
0.1 |
- |
- |
|
Interest Cost - Gratuity |
0.0 |
0.0 |
0.0 |
- |
- |
|
Acturial Gain Recognised |
0.0 |
0.0 |
- |
- |
- |
|
Domestic Pension Plan Expense |
0.1 |
0.0 |
0.1 |
- |
- |
|
Defined Benifit Obligation |
0.1 |
0.2 |
- |
- |
- |
|
Total Pension Expense |
0.2 |
0.2 |
0.1 |
- |
- |
|
Discount Rate - Gratuity |
12.00% |
9.00% |
9.00% |
- |
- |
|
Compensation Rate - Gratuity |
10.00% |
8.00% |
8.00% |
- |
- |
Interim
Income Statement
As Reported
Financials in: USD (mil)
Except for share items (millions) and per share items (actual units)
|
|
31-Mar-2009 |
31-Dec-2008 |
30-Sep-2008 |
30-Jun-2008 |
31-Mar-2008 |
|
Period Length |
3 Months |
3 Months |
3 Months |
3 Months |
3 Months |
|
UpdateType/Date |
Updated Normal |
Updated Normal |
Updated Normal |
Updated Normal |
Reclassified
Normal |
|
Filed Currency |
PKR |
PKR |
PKR |
PKR |
PKR |
|
Exchange Rate
(Period Average) |
79.729396 |
79.797043 |
74.087124 |
66.109892 |
62.589368 |
|
|
|
|
|
|
|
|
Sales |
- |
- |
8.4 |
8.7 |
- |
|
Saless |
4.9 |
5.4 |
- |
- |
8.2 |
|
Commission |
0.0 |
0.0 |
- |
- |
-0.1 |
|
Total Sales |
4.9 |
5.4 |
8.4 |
8.7 |
8.1 |
|
|
|
|
|
|
|
|
Cost of Sales |
4.8 |
5.1 |
8.0 |
7.9 |
8.3 |
|
Other Operating Income |
0.0 |
0.0 |
0.0 |
0.0 |
0.0 |
|
Selling/Distribution |
0.0 |
0.0 |
0.1 |
0.1 |
0.0 |
|
Administration |
0.0 |
0.1 |
0.1 |
0.1 |
0.1 |
|
Other Operating Expenses |
0.0 |
0.0 |
0.0 |
0.1 |
0.0 |
|
Total Operating Expense |
4.9 |
5.2 |
8.1 |
8.2 |
8.4 |
|
|
|
|
|
|
|
|
Financial Exp. |
-0.3 |
-0.4 |
-0.3 |
-0.3 |
-0.4 |
|
Share of Profit of Associate |
0.0 |
0.0 |
0.0 |
-0.1 |
0.0 |
|
Net Income Before Taxes |
-0.4 |
-0.2 |
-0.1 |
0.1 |
-0.7 |
|
|
|
|
|
|
|
|
Provision for Income Taxes |
0.0 |
-0.1 |
0.0 |
-0.7 |
0.0 |
|
Net Income After Taxes |
-0.4 |
-0.2 |
-0.1 |
0.7 |
-0.7 |
|
|
|
|
|
|
|
|
Net Income Before Extra. Items |
-0.4 |
-0.2 |
-0.1 |
0.7 |
-0.7 |
|
Net Income |
-0.4 |
-0.2 |
-0.1 |
0.7 |
-0.7 |
|
|
|
|
|
|
|
|
Income Available to Com Excl ExtraOrd |
-0.4 |
-0.2 |
-0.1 |
0.7 |
-0.7 |
|
|
|
|
|
|
|
|
Income Available to Com Incl ExtraOrd |
-0.4 |
-0.2 |
-0.1 |
0.7 |
-0.7 |
|
|
|
|
|
|
|
|
Basic Weighted Average Shares |
1.4 |
1.4 |
1.4 |
1.4 |
1.4 |
|
Basic EPS Excluding ExtraOrdinary Items |
-0.26 |
-0.12 |
-0.05 |
0.53 |
-0.50 |
|
Basic EPS Including ExtraOrdinary Item |
-0.26 |
-0.12 |
-0.05 |
0.53 |
-0.50 |
|
Dilution Adjustment |
0.0 |
0.0 |
0.0 |
0.0 |
0.0 |
|
Diluted Net Income |
-0.4 |
-0.2 |
-0.1 |
0.7 |
-0.7 |
|
Diluted Weighted Average Shares |
1.4 |
1.4 |
1.4 |
1.4 |
1.4 |
|
Diluted EPS Excluding ExtraOrd Items |
-0.26 |
-0.12 |
-0.05 |
0.53 |
-0.50 |
|
Diluted EPS Including ExtraOrd Items |
-0.26 |
-0.12 |
-0.05 |
0.53 |
-0.50 |
|
DPS-Ordinary Shares |
0.00 |
0.00 |
0.00 |
0.00 |
0.00 |
|
Gross Dividends - Common Stock |
0.0 |
0.0 |
0.0 |
0.0 |
0.0 |
|
Normalized Income Before Taxes |
-0.4 |
-0.2 |
-0.1 |
0.1 |
-0.7 |
|
|
|
|
|
|
|
|
Inc Tax Ex Impact of Sp Items |
0.0 |
-0.1 |
0.0 |
-0.7 |
0.0 |
|
Normalized Income After Taxes |
-0.4 |
-0.2 |
-0.1 |
0.7 |
-0.7 |
|
|
|
|
|
|
|
|
Normalized Inc. Avail to Com. |
-0.4 |
-0.2 |
-0.1 |
0.7 |
-0.7 |
|
|
|
|
|
|
|
|
Basic Normalized EPS |
-0.26 |
-0.12 |
-0.05 |
0.53 |
-0.50 |
|
Diluted Normalized EPS |
-0.26 |
-0.12 |
-0.05 |
0.53 |
-0.50 |
|
Depreciation |
0.2 |
0.2 |
0.2 |
- |
0.5 |
Annual Balance Sheet
As Reported
Financials in: USD (mil)
Except for share items (millions) and per share items (actual units)
|
|
30-Jun-2008 |
30-Jun-2007 |
30-Jun-2006 |
30-Jun-2005 |
30-Sep-2004 |
|
UpdateType/Date |
Updated Normal |
Updated Normal |
Restated Normal |
Updated Normal |
Updated Normal |
|
Filed Currency |
PKR |
PKR |
PKR |
PKR |
PKR |
|
Exchange Rate |
68.45 |
60.47 |
60.21 |
59.61 |
59.26 |
|
Auditor |
|
Mushtaq &
Company Chartered Accountants |
HLB Ijaz
Tabussum & Co |
Khalid Majid
Rahman |
Khalid Majid
Rahman |
|
Auditor Opinion |
|
Unqualified |
Unqualified |
Unqualified |
Unqualified |
|
|
|
|
|
|
|
|
Stores |
1.1 |
1.0 |
0.7 |
0.6 |
0.5 |
|
Spare Parts |
0.1 |
0.1 |
0.1 |
0.1 |
0.1 |
|
Loose Tools |
0.0 |
0.0 |
0.0 |
- |
- |
|
Raw Materials |
4.1 |
3.4 |
3.0 |
3.1 |
4.0 |
|
Work in Progress |
0.4 |
0.5 |
0.3 |
0.2 |
0.3 |
|
Finished Goods |
0.6 |
0.5 |
0.3 |
0.3 |
0.3 |
|
Raw Materials in Transit |
- |
- |
- |
0.2 |
0.0 |
|
Trade Debtors |
2.4 |
1.6 |
1.5 |
1.6 |
2.5 |
|
LT Loans |
0.0 |
0.0 |
0.0 |
0.0 |
0.0 |
|
Letter of Credit |
0.0 |
0.0 |
0.9 |
0.3 |
0.0 |
|
Supplier Advance |
0.1 |
0.6 |
0.3 |
0.2 |
0.2 |
|
Due, Associates |
0.0 |
0.0 |
0.0 |
0.0 |
0.0 |
|
Prepayments |
0.0 |
0.0 |
0.0 |
0.0 |
0.0 |
|
Other Receivables |
0.0 |
0.1 |
0.0 |
0.0 |
0.0 |
|
Advance Income Tax |
0.6 |
0.5 |
0.9 |
0.4 |
0.3 |
|
Sales Tax Refund |
0.3 |
0.3 |
0.3 |
0.1 |
0.0 |
|
Income Tax Refundable |
0.2 |
0.2 |
0.1 |
0.1 |
0.1 |
|
Cash/Bank |
0.3 |
0.1 |
0.9 |
0.4 |
0.5 |
|
Total Current Assets |
10.3 |
8.9 |
9.4 |
7.8 |
8.9 |
|
|
|
|
|
|
|
|
Land |
6.3 |
7.1 |
6.9 |
0.8 |
0.8 |
|
Buildings |
4.9 |
5.3 |
5.3 |
1.7 |
1.7 |
|
Plant/Machinery |
17.0 |
18.8 |
15.5 |
15.3 |
14.4 |
|
Vehicles |
0.3 |
0.3 |
0.3 |
0.3 |
0.2 |
|
Furn./Fittings |
0.0 |
0.0 |
0.0 |
0.0 |
0.0 |
|
Office Computer |
0.0 |
0.0 |
0.0 |
0.0 |
0.0 |
|
Office Equip. |
0.0 |
0.0 |
0.0 |
0.0 |
0.0 |
|
Tools/Equipment |
0.0 |
0.0 |
0.0 |
0.0 |
0.0 |
|
Vehicles Under Lease |
0.2 |
0.2 |
0.2 |
0.0 |
- |
|
Capital Work in Progress |
0.4 |
0.2 |
0.2 |
0.1 |
0.1 |
|
Depreciation |
-3.2 |
-2.5 |
-0.3 |
-8.8 |
-8.2 |
|
Investment |
0.2 |
0.4 |
0.4 |
0.1 |
0.1 |
|
LT Loan |
0.0 |
0.0 |
0.0 |
0.0 |
0.0 |
|
LT Deposits |
0.1 |
0.1 |
0.1 |
0.0 |
0.0 |
|
Adjustment |
- |
- |
0.3 |
- |
- |
|
Total Assets |
36.5 |
38.9 |
38.2 |
17.4 |
18.1 |
|
|
|
|
|
|
|
|
Current Portion of LT Loans |
6.5 |
5.3 |
4.1 |
5.1 |
4.1 |
|
LT Liabilities |
0.8 |
1.1 |
1.3 |
1.2 |
0.9 |
|
Trade Creditors |
4.1 |
2.7 |
2.6 |
0.7 |
3.0 |
|
Advances from Customers |
0.0 |
0.0 |
0.1 |
0.1 |
0.1 |
|
Accrued Expenses |
0.2 |
0.2 |
0.4 |
0.2 |
0.2 |
|
LT Loan Interest |
0.1 |
0.1 |
0.1 |
0.1 |
0.1 |
|
ST Loan Interest |
0.2 |
0.2 |
0.1 |
0.1 |
0.1 |
|
Workers Profit |
- |
0.0 |
0.0 |
0.0 |
0.0 |
|
Workers Welfare |
0.0 |
0.0 |
0.1 |
0.1 |
0.0 |
|
Tax, Source |
0.0 |
0.0 |
0.0 |
0.0 |
0.0 |
|
Sales Tax Payable |
- |
- |
- |
0.0 |
0.1 |
|
Unclaimed Div. |
0.0 |
0.0 |
0.0 |
0.0 |
0.0 |
|
Taxation Prov. |
0.6 |
0.6 |
0.9 |
0.4 |
0.3 |
|
Total Current Liabilities |
12.6 |
10.2 |
9.7 |
7.9 |
9.0 |
|
|
|
|
|
|
|
|
Capital Lease |
0.1 |
0.1 |
0.1 |
0.0 |
- |
|
Mark-Up Finance |
3.4 |
4.5 |
3.2 |
2.4 |
2.5 |
|
Loans from Associate Undertakings |
0.6 |
0.3 |
0.3 |
0.3 |
0.3 |
|
Loans from Directors and Sponsors |
0.7 |
0.8 |
0.8 |
0.8 |
0.8 |
|
Total Long Term Debt |
4.8 |
5.7 |
4.3 |
3.4 |
3.5 |
|
|
|
|
|
|
|
|
Deferred Tax |
3.0 |
3.4 |
0.4 |
- |
- |
|
Retirement Benefit Obligations |
0.1 |
0.2 |
0.2 |
- |
- |
|
Defered Liabilities |
- |
- |
- |
0.6 |
0.4 |
|
Total Liabilities |
20.4 |
19.5 |
14.6 |
11.9 |
12.9 |
|
|
|
|
|
|
|
|
Share Capital |
0.2 |
0.2 |
0.2 |
0.2 |
0.2 |
|
Capital Reserves |
0.1 |
0.1 |
0.1 |
0.1 |
0.1 |
|
Special Reserves |
0.0 |
0.0 |
0.0 |
0.0 |
0.0 |
|
General Reserves |
1.0 |
1.2 |
1.2 |
1.2 |
1.2 |
|
Investment in Associate |
0.0 |
0.0 |
0.0 |
- |
- |
|
Profit/Loss |
2.9 |
3.4 |
3.5 |
3.2 |
2.9 |
|
Fix. Asset Surp. |
11.8 |
14.4 |
18.6 |
0.7 |
0.7 |
|
Total Equity |
16.1 |
19.4 |
23.6 |
5.5 |
5.1 |
|
|
|
|
|
|
|
|
Total Liabilities & Shareholders' Equity |
36.5 |
38.9 |
38.2 |
17.4 |
18.1 |
|
|
|
|
|
|
|
|
S/O-Ordinary Shares |
1.4 |
1.4 |
1.4 |
1.4 |
1.4 |
|
Total Common Shares Outstanding |
1.4 |
1.4 |
1.4 |
1.4 |
1.4 |
|
Advances Fom Customers |
0.0 |
0.0 |
0.1 |
0.1 |
0.1 |
|
Full-Time Employees |
- |
- |
1,919 |
1,701 |
1,615 |
|
Number of Common Shareholders |
85 |
85 |
85 |
85 |
- |
|
Lease Payments due within 1 Year |
0.0 |
0.0 |
0.0 |
- |
- |
|
Lease Payments due within 5 Years |
0.1 |
0.1 |
0.1 |
- |
- |
|
Lease Payments Thereafter |
- |
0.0 |
0.1 |
- |
- |
|
Total Capital Leases |
0.1 |
0.1 |
0.2 |
- |
- |
|
Projected Benefit Obligation - Gratuity |
0.1 |
0.2 |
0.2 |
- |
- |
|
Funded Status |
-0.1 |
-0.2 |
-0.2 |
- |
- |
|
Total Funded Status |
-0.1 |
-0.2 |
-0.2 |
- |
- |
|
Discount Rate - Gratuity |
12.00% |
9.00% |
9.00% |
- |
- |
|
Compensation Rate - Gratuity |
10.00% |
8.00% |
8.00% |
- |
- |
|
Accrued Benefit Liability - Gratuity |
-0.1 |
-0.2 |
-0.2 |
- |
- |
|
Net Assets Recognized on Balance Sheet |
-0.1 |
-0.2 |
-0.2 |
- |
- |
Interim Balance Sheet
As Reported
Financials in: USD (mil)
Except for share items (millions) and per share items (actual units)
|
|
31-Mar-2009 |
31-Dec-2008 |
30-Sep-2008 |
30-Jun-2008 |
31-Mar-2008 |
|
UpdateType/Date |
Updated Normal |
Updated Normal |
Updated Normal |
Updated Normal |
Updated Normal |
|
Filed Currency |
PKR |
PKR |
PKR |
PKR |
PKR |
|
Exchange Rate |
80.51 |
79.125 |
78.25 |
68.45 |
62.695 |
|
|
|
|
|
|
|
|
Stores & Spares |
1.1 |
1.1 |
1.1 |
1.2 |
1.2 |
|
Stocks in Trade |
2.7 |
3.5 |
3.3 |
5.2 |
8.5 |
|
Trade Debtors |
1.5 |
2.0 |
1.8 |
2.4 |
1.8 |
|
Loan & Advances |
0.9 |
0.1 |
0.6 |
0.2 |
0.5 |
|
Trade Deposits & Prepayments |
0.0 |
0.0 |
0.1 |
0.0 |
0.0 |
|
Other Receivables |
0.0 |
0.0 |
0.9 |
0.0 |
1.1 |
|
Tax Refund Due from Government |
0.9 |
0.9 |
- |
1.0 |
- |
|
Cash/Bank |
0.4 |
0.3 |
0.2 |
0.3 |
0.2 |
|
Total Current Assets |
7.5 |
8.0 |
7.9 |
10.3 |
13.4 |
|
|
|
|
|
|
|
|
Property & Equipment, Net |
21.9 |
22.3 |
22.2 |
25.5 |
27.3 |
|
Capital Work in Progress |
0.3 |
0.3 |
0.3 |
0.4 |
0.2 |
|
LT Investment |
0.2 |
0.2 |
0.2 |
0.2 |
0.3 |
|
LT Loan |
0.0 |
0.0 |
0.0 |
0.0 |
0.0 |
|
LT Deposits |
0.0 |
0.0 |
0.1 |
0.1 |
0.1 |
|
Total Assets |
30.0 |
30.9 |
30.7 |
36.5 |
41.3 |
|
|
|
|
|
|
|
|
Trade & Other Payables |
1.9 |
2.6 |
2.8 |
4.4 |
5.3 |
|
Accrued Expenses |
0.4 |
0.4 |
0.3 |
0.3 |
0.3 |
|
Short Term Borrowings |
6.4 |
6.0 |
5.8 |
6.5 |
8.2 |
|
Current Portion of LT Loans |
0.9 |
0.8 |
0.6 |
0.8 |
0.7 |
|
Provision for Taxation |
0.6 |
0.6 |
0.6 |
0.6 |
0.7 |
|
Total Current Liabilities |
10.2 |
10.4 |
10.1 |
12.6 |
15.3 |
|
|
|
|
|
|
|
|
Long Term Loans |
3.0 |
3.1 |
3.0 |
3.4 |
4.1 |
|
Loans from Associate Undertakings |
0.6 |
0.6 |
0.2 |
0.6 |
0.3 |
|
Loans from Directors and Sponsors |
0.6 |
0.6 |
0.6 |
0.7 |
0.8 |
|
Finance Leases |
0.1 |
0.1 |
0.1 |
0.1 |
0.1 |
|
Total Long Term Debt |
4.3 |
4.3 |
3.9 |
4.8 |
5.3 |
|
|
|
|
|
|
|
|
Defered Liabilities |
2.4 |
2.5 |
2.6 |
3.1 |
3.5 |
|
Total Liabilities |
16.9 |
17.2 |
16.6 |
20.4 |
24.0 |
|
|
|
|
|
|
|
|
Share Capital |
0.2 |
0.2 |
0.2 |
0.2 |
0.2 |
|
Reserves |
1.0 |
1.0 |
1.0 |
1.1 |
1.2 |
|
Un-appropriated Profit |
2.1 |
2.4 |
2.6 |
2.9 |
2.5 |
|
Surplus on Revaluation of Assets |
9.9 |
10.1 |
10.3 |
11.8 |
13.3 |
|
Total Equity |
13.1 |
13.7 |
14.0 |
16.1 |
17.3 |
|
|
|
|
|
|
|
|
Total Liabilities & Shareholders' Equity |
30.0 |
30.9 |
30.7 |
36.5 |
41.3 |
|
|
|
|
|
|
|
|
S/O-Ordinary Shares |
1.4 |
1.4 |
1.4 |
1.4 |
1.4 |
|
Total Common Shares Outstanding |
1.4 |
1.4 |
1.4 |
1.4 |
1.4 |
Annual Cash Flows
As Reported
Financials in: USD (mil)
Except for share items (millions) and per share items (actual units)
|
|
30-Jun-2008 |
30-Jun-2007 |
30-Jun-2006 |
30-Jun-2005 |
30-Sep-2004 |
|
Period Length |
12 Months |
12 Months |
12 Months |
9 Months |
12 Months |
|
UpdateType/Date |
Updated Normal |
Updated Normal |
Reclassified
Normal |
Updated Normal |
Updated Normal |
|
Filed Currency |
PKR |
PKR |
PKR |
PKR |
PKR |
|
Exchange Rate
(Period Average) |
62.550956 |
60.637036 |
59.865977 |
59.345369 |
57.788522 |
|
Auditor |
|
Mushtaq &
Company Chartered Accountants |
HLB Ijaz
Tabussum & Co |
Khalid Majid
Rahman |
Khalid Majid Rahman |
|
Auditor Opinion |
|
Unqualified |
Unqualified |
Unqualified |
Unqualified |
|
|
|
|
|
|
|
|
Net Income |
-1.1 |
-1.0 |
0.3 |
0.7 |
0.8 |
|
Depreciation |
1.1 |
2.2 |
1.1 |
0.7 |
1.0 |
|
Gratuity Prov. |
0.1 |
0.0 |
0.1 |
0.1 |
0.1 |
|
Diposal Fixed Asset |
0.1 |
0.0 |
0.0 |
0.0 |
0.0 |
|
Financial Charges |
1.2 |
1.3 |
1.1 |
0.6 |
0.7 |
|
Share of Profit/ Loss of Associate |
0.1 |
0.1 |
0.0 |
- |
- |
|
Other Operating Expenses |
- |
0.0 |
0.0 |
- |
- |
|
Workers' Profit Fund |
- |
- |
- |
0.0 |
0.0 |
|
Workers Welfare Fund |
- |
- |
- |
0.0 |
0.0 |
|
Stores/Spares/Stock |
-0.3 |
-0.3 |
-0.1 |
-0.1 |
-0.2 |
|
Stock in Trade |
-1.5 |
-0.7 |
0.2 |
0.7 |
-2.5 |
|
Trade Debtors |
-1.1 |
0.0 |
0.1 |
0.9 |
-0.3 |
|
Loans and Advances |
0.4 |
0.6 |
-0.6 |
- |
- |
|
Adv./Dep./Prepayment |
0.0 |
0.0 |
0.0 |
-0.3 |
-0.2 |
|
Other Receivables |
0.1 |
-0.1 |
0.0 |
- |
- |
|
Tax refunds due from Govt |
0.0 |
0.0 |
-0.2 |
0.0 |
0.1 |
|
Short Term Borrowings |
2.0 |
1.2 |
-0.9 |
0.9 |
0.2 |
|
Creditors/Accrued |
2.0 |
-0.1 |
2.1 |
-2.5 |
2.3 |
|
Interest Paid |
-1.1 |
-1.2 |
-1.0 |
-0.6 |
-0.7 |
|
Gratuity Paid |
-0.1 |
-0.1 |
-0.1 |
-0.1 |
-0.1 |
|
Workers Profit Participation Fund |
- |
- |
- |
0.0 |
0.0 |
|
Other Operating Expenses Paid |
0.0 |
-0.1 |
0.0 |
- |
- |
|
Workers Welfare Fund Paid |
- |
- |
- |
0.0 |
-0.1 |
|
Taxes Paid |
-0.1 |
-0.1 |
-0.1 |
-0.1 |
-0.2 |
|
Adjustments |
- |
0.0 |
- |
- |
- |
|
Cash from Operating Activities |
1.8 |
1.5 |
1.8 |
0.9 |
1.1 |
|
|
|
|
|
|
|
|
Sale Fixed Assets |
0.1 |
0.0 |
0.0 |
0.0 |
0.0 |
|
Capital Expenditure |
-1.1 |
-3.5 |
-2.1 |
-1.2 |
-1.2 |
|
LT Deposits |
0.0 |
0.0 |
0.0 |
0.0 |
0.0 |
|
LT Loans |
0.0 |
0.0 |
0.0 |
0.0 |
0.0 |
|
Cash from Investing Activities |
-1.0 |
-3.5 |
-2.2 |
-1.2 |
-1.2 |
|
|
|
|
|
|
|
|
Long Term Loans Received |
0.3 |
2.2 |
1.4 |
1.0 |
0.9 |
|
Long Term Loans Repaid |
-1.1 |
-0.9 |
-0.6 |
-0.8 |
-0.9 |
|
Rcvd., Associate |
- |
- |
- |
0.0 |
0.0 |
|
Lease Payment |
0.0 |
0.0 |
0.0 |
0.0 |
- |
|
Loan from Associated Undertakings |
0.3 |
0.0 |
- |
- |
- |
|
Cash from Financing Activities |
-0.5 |
1.2 |
0.8 |
0.2 |
0.0 |
|
|
|
|
|
|
|
|
Net Change in Cash |
0.2 |
-0.8 |
0.4 |
0.0 |
-0.1 |
|
|
|
|
|
|
|
|
Net Cash - Beginning Balance |
0.1 |
0.9 |
0.4 |
0.5 |
0.6 |
|
Net Cash - Ending Balance |
0.3 |
0.1 |
0.9 |
0.4 |
0.5 |
|
Cash Interest Paid |
1.1 |
1.2 |
1.0 |
0.6 |
0.7 |
|
Cash Taxes Paid |
0.1 |
0.1 |
0.1 |
0.1 |
0.2 |
Interim Cash Flows
As Reported
Financials in: USD (mil)
Except for share items (millions) and per share items (actual units)
|
|
31-Mar-2009 |
31-Dec-2008 |
30-Sep-2008 |
30-Jun-2008 |
31-Mar-2008 |
|
Period Length |
9 Months |
6 Months |
3 Months |
12 Months |
9 Months |
|
UpdateType/Date |
Updated Normal |
Updated Normal |
Updated Normal |
Updated Normal |
Updated Normal |
|
Filed Currency |
PKR |
PKR |
PKR |
PKR |
PKR |
|
Exchange Rate
(Period Average) |
77.851736 |
76.935014 |
74.087124 |
62.550956 |
61.348709 |
|
|
|
|
|
|
|
|
Net Income |
-0.7 |
-0.3 |
-0.1 |
-1.1 |
-1.1 |
|
Depreciation |
0.6 |
0.4 |
0.2 |
1.1 |
1.7 |
|
Gratuity Prov. |
0.0 |
0.0 |
- |
0.1 |
0.0 |
|
Diposal Fixed Asset |
0.0 |
0.0 |
0.0 |
0.1 |
0.0 |
|
Financial Charges |
1.0 |
0.7 |
0.3 |
1.2 |
0.9 |
|
Share of Profit of Associate |
0.0 |
0.0 |
0.0 |
0.1 |
0.0 |
|
Stores/Spares/Stock |
0.0 |
-0.1 |
0.0 |
-0.3 |
-0.1 |
|
Stock in Trade |
1.7 |
1.0 |
1.4 |
-1.5 |
-4.4 |
|
Trade Debtors |
0.6 |
0.1 |
0.3 |
-1.1 |
-0.3 |
|
Loan & Advances |
-0.8 |
0.0 |
-0.5 |
0.4 |
0.1 |
|
Trade Deposits & Prepayments |
0.0 |
0.0 |
-0.1 |
0.0 |
0.0 |
|
Other Receivables |
0.0 |
0.0 |
0.0 |
0.1 |
0.1 |
|
Tax refunds due from Govt |
0.0 |
0.0 |
0.0 |
0.0 |
0.0 |
|
Short Term Borrowings |
0.9 |
0.5 |
0.1 |
2.0 |
3.2 |
|
Trade & Other Payables |
-1.9 |
-1.3 |
-1.1 |
2.0 |
2.6 |
|
Interest Paid |
-0.9 |
-0.6 |
-0.3 |
-1.1 |
-0.8 |
|
Gratuity Paid |
-0.1 |
-0.1 |
0.0 |
-0.1 |
-0.1 |
|
Taxes Paid |
-0.1 |
-0.1 |
0.0 |
-0.1 |
-0.1 |
|
Other Operating Expenses Paid |
- |
- |
- |
0.0 |
- |
|
Cash from Operating Activities |
0.5 |
0.3 |
0.3 |
1.8 |
1.5 |
|
|
|
|
|
|
|
|
Sale Fixed Assets |
0.0 |
0.0 |
0.0 |
0.1 |
0.1 |
|
Capital Expenditure |
-0.9 |
-0.7 |
-0.1 |
-1.1 |
-0.8 |
|
LT Deposits |
0.0 |
- |
- |
0.0 |
0.0 |
|
LT Loans |
0.0 |
0.0 |
- |
0.0 |
0.0 |
|
Cash from Investing Activities |
-0.9 |
-0.7 |
-0.1 |
-1.0 |
-0.8 |
|
|
|
|
|
|
|
|
Long Term Loans Received |
1.2 |
0.6 |
0.1 |
0.3 |
0.4 |
|
Long Term Loans Repaid |
-0.8 |
-0.4 |
-0.1 |
-1.1 |
-1.1 |
|
Repayment of Leases |
0.0 |
0.0 |
0.0 |
0.0 |
0.0 |
|
Loan from Associated Undertakings |
- |
0.1 |
- |
0.3 |
- |
|
Repayment of Due from Associates |
0.2 |
- |
-0.3 |
- |
0.1 |
|
Cash from Financing Activities |
0.5 |
0.3 |
-0.4 |
-0.5 |
-0.6 |
|
|
|
|
|
|
|
|
Net Change in Cash |
0.1 |
0.0 |
-0.1 |
0.2 |
0.1 |
|
|
|
|
|
|
|
|
Net Cash - Beginning Balance |
0.3 |
0.3 |
0.3 |
0.1 |
0.1 |
|
Net Cash - Ending Balance |
0.4 |
0.3 |
0.2 |
0.3 |
0.2 |
|
Cash Interest Paid |
0.9 |
0.6 |
0.3 |
1.1 |
0.8 |
|
Cash Taxes Paid |
0.1 |
0.1 |
0.0 |
0.1 |
0.1 |
FOREIGN EXCHANGE RATES
|
Currency |
Unit
|
Indian Rupees |
|
US Dollar |
1 |
Rs.50.28 |
|
UK Pound |
1 |
Rs.80.08 |
|
Euro |
1 |
Rs.68.45 |
RATING EXPLANATIONS
|
RATING |
STATUS |
PROPOSED CREDIT LINE |
|
|
>86 |
Aaa |
Possesses an extremely sound financial base with the strongest capability
for timely payment of interest and principal sums |
Unlimited |
|
71-85 |
Aa |
Possesses adequate working capital. No caution needed for credit
transaction. It has above average (strong) capability for payment of interest
and principal sums |
Large |
|
56-70 |
A |
Financial & operational base are regarded healthy. General
unfavourable factors will not cause fatal effect. Satisfactory capability for
payment of interest and principal sums |
Fairly Large |
|
41-55 |
Ba |
Overall operation is considered normal. Capable to meet normal
commitments. |
Satisfactory |
|
26-40 |
B |
Capability to overcome financial difficulties seems comparatively
below average. |
Small |
|
11-25 |
Ca |
Adverse factors are apparent. Repayment of interest and principal sums
in default or expected to be in default upon maturity |
Limited with
full security |
|
<10 |
C |
Absolute credit risk exists. Caution needed to be exercised |
Credit not
recommended |
|
---- |
NB |
New Business |
---- |
This score serves as a reference to assess SC’s credit risk
and to set the amount of credit to be extended. It is calculated from a
composite of weighted scores obtained from each of the major sections of this report.
The assessed factors and their relative weights (as indicated through %) are as
follows:
Financial
condition (40%) Ownership
background (20%) Payment
record (10%)
Credit history
(10%) Market trend
(10%) Operational
size (10%)
This report is issued at your request without any risk
and responsibility on the part of MIRA INFORM PRIVATE LIMITED (MIPL) or its
officials.