![]()
MIRA INFORM REPORT
|
Report Date : |
17.11.2011 |
IDENTIFICATION DETAILS
|
Name : |
GAMMA
INDUSTRIES COMPANY LIMITED |
|
|
|
|
Registered Office : |
192 Soi Petchkasem
28, Petchkasem Road, Pakklongpasicharoen, Pasicharoen, Bangkok 10160 |
|
|
|
|
Country : |
Thailand |
|
|
|
|
Financials (as on) : |
31.12.2010 |
|
|
|
|
Date of Incorporation : |
30.11.1982 |
|
|
|
|
Com. Reg. No.: |
0105525044012 |
|
|
|
|
Legal Form : |
Private Limited Company |
|
|
|
|
Line of Business : |
Manufacturer, Distributor
and Exporter of Weaving Mill |
RATING & COMMENTS
|
MIRA’s Rating : |
Ba |
|
RATING |
STATUS |
PROPOSED CREDIT LINE |
|
|
41-55 |
Ba |
Overall operation is considered normal. Capable to meet normal
commitments. |
Satisfactory |
|
Status : |
Satisfactory |
|
Payment
Behaviour : |
No Complaints |
|
Litigation : |
Clear |
NOTES :
Any query related to this report can be made
on e-mail : infodept@mirainform.com
while quoting report number, name and date.
ECGC Country Risk Classification List – September 30th, 2011
|
Country Name |
Previous Rating (30.06.2011) |
Current Rating (30.09.2011) |
|
Thailand |
b1 |
b1 |
|
Risk Category |
ECGC
Classification |
|
Insignificant |
A1 |
|
Low |
A2 |
|
Moderate |
B1 |
|
High |
B2 |
|
Very High |
C1 |
|
Restricted |
C2 |
|
Off-credit |
D |
Company name
GAMMA INDUSTRIES
COMPANY LIMITED
SUMMARY
BUSINESS
ADDRESS : 192
SOI PETCHKASEM 28,
PETCHKASEM ROAD,
PAKKLONGPASICHAROEN, PASICHAROEN,
BANGKOK 10160,
THAILAND
TELEPHONE : [66] 2868-5686
FAX :
[66] 2868-4675
E-MAIL
ADDRESS : sales@gamma.co.th
bkksales@gamma.co.th
REGISTRATION
ADDRESS : SAME
AS BUSINESS ADDRESS
ESTABLISHED
: 1982
REGISTRATION
NO. : 0105525044012
CAPITAL REGISTERED : BHT. 140,000,000
CAPITAL PAID-UP : BHT.
140,000,000
SHAREHOLDER’S PROPORTION : THAI : 86%
INDIAN : 14%
FISCAL YEAR CLOSING DATE : DECEMBER 31
LEGAL
STATUS : PRIVATE LIMITED
COMPANY
EXECUTIVE : MR.
ANILKUMAR SRISOTORNWONG, THAI
MANAGING DIRECTOR
NO.
OF STAFF : 700
LINES
OF BUSINESS : WEAVING MILL
MANUFACTURER, DISTRIBUTOR
AND EXPORTER
CORPORATE PROFILE
OPERATING
TREND : STABLE
PRESENT
SITUATION : OPERATING NORMALLY
REPUTATION : GOOD
WITH NORMAL BUSINESS
ENGAGEMENT
MANAGEMENT
STANDARD : MANAGEMENT WITH
FAIR PERFORMANCE
HISTORY
The
subject was established
on November 30,
1982 as a
private limited company under
the originally registered
name “Tajima Punching
Center Company Limited” by Thai
and Indian groups. On January 16, 1984, the registered name was changed to
GAMMA INDUSTRIES COMPANY LIMITED. Its objective is to be engaged in weaving business.
Subject currently employs
approximate 700 staff.
The
subject’s registered address
was initially located
at 73/65 Klongbangchak
Rd., Pakklongpasicharoen, Pasicharoen,
Bangkok 10160.
On
January 22, 2008,
its registered address
was relocated to 192 Soi
Petchkasem 28, Petchkasem Rd., Pakklongpasicharoen,
Pasicharoen, Bangkok 10160, and this
is the subject’s
current operation address.
THE BOARD OF DIRECTOR
|
Name |
|
Nationality |
Age |
|
|
|
|
|
|
Mr. Seksan Srichawala |
[x] |
Thai |
47 |
|
Mr. Pornthep Srichawala |
[x] |
Thai |
58 |
|
Mr. Anilkumar Srisotornwong |
|
Thai |
63 |
|
Mrs. Veena Srisotornwong |
|
Thai |
59 |
AUTHORIZED PERSON
One of the
mentioned directors [x] can jointly
sign with anyone
of the rest
directors on behalf
of the subject
with company’s affixed.
MANAGEMENT
Mr. Anilkumar Srisotornwong is
the Managing Director.
He is Thai
nationality with the
age of 63
years old.
Mr. Seksan Srichawala is
the Deputy Managing
Director and Factory
Manager.
He is Thai
nationality with the
age of 47
years old.
Mr. Prem
Srichawala is the
Deputy Managing Director and
Sales & Marketing Manager.
He is Indian
nationality.
BUSINESS OPERATIONS
The subject
is engaged in
manufacturing of embroidery
fabric for outerwear,
innerwear, upholstery, garment,
as well as
providing manufacturing service
of woven label
products, such as
satin/taffeta, zipper puller
and laser cut
labels. The products
are supplied to
garment, underwear &
lingerie, home furniture
industries and etc.
PURCHASE
Raw materials, nylon
yarn and cotton
yarn are purchased
from suppliers both domestic
and overseas in
Republic of China,
India and Australia.
MAJOR
SUPPLIERS
Jongstit
Co., Ltd. : Thailand
Indorama
Polyester Industries Public
Company Limited :
Thailand
SALES
80% of the products is
exported to U.S.A., Japan,
Hong Kong, Republic of
China, India, Canada,
European countries and
etc, the remaining
20% is sold
locally.
SUBSIDIARY AND AFFILIATED
COMPANY
The subject is
not found to
have any subsidiary
or affiliated company
here in Thailand.
LITIGATION
Bankruptcy and
Receivership
There are no
litigation on bankruptcy
and receivership cases
filed against the
subject found at
Legal Execution Department
for the past
five years.
Others
There are no legal suits
filed against the
subject for the
past two years.
CREDIT
Sales are by
cash or on
the credits term
of 30-60 days.
Local bills are
paid by cash
or on the
credits term of
30-60 days.
Imports are by
T/T.
Exports are against
T/T.
BANKING
Bangkok
Bank Public Co.,
Ltd.
EMPLOYMENT
The
subject employs approximately
700 staff.
LOCATION
DETAILS
The
premise is owned for administrative office, factory and warehouse at the heading
address. Premise is
located in commercial/residential area.
REMARK
CREDIT
OF US$ 125,000
AGAINST D/A IN
TERMS SHOULD BE
IN ORDER.
COMMENT
With more than
20 years of
manufacturing experience, the
subject offers a wide
range of fashionable
fabrics with the
finest standard. Consumption improvement
has potential for
textile waving. Demand of
textiles also looks on the rise,
which is essential
for the related industries.
Subject has good performance
in the past years
with rising sales
from export markets.
Note:
Please
be informed that
according to your
given address, the
correct company name
is “Gamma Industries
Company Limited” not “Gamma
Indsco Pvt. Ltd.”.
FINANCIAL INFORMATION
The
capital was registered
at Bht. 1,000,000 divided into 1,000
shares of Bht. 1,000
each with fully
paid.
The
capital was increased
later as follows:
Bht. 14,400,000
on June 19,
1987
Bht. 20,000,000
on July 23,
1991
Bht. 70,000,000
on March 11,
1994
Bht. 140,000,000
on November 13,
2000
The
latest registered capital
was increased to Bht. 140 million, divided into
140,000 shares of
Bht. 1,000 each with
fully paid.
THE SHAREHOLDERS
LISTED WERE :
[as at April
30, 2011]
|
NAME |
HOLDING |
% |
|
|
|
|
|
Mr. Anilkumar Srisotornwong Nationality: Thai Address : 111/13
Raqma 4 Rd.,
Thungmahamek,
Sathorn, Bangkok |
36,240 |
25.89 |
|
Mr. Seksan Srichawala Nationality: Thai Address : 361
Sukhumvit 71 Rd.,
Prakanongnua,
Wattana, Bangkok |
27,580 |
19.70 |
|
Mrs. Veena Srisotornwong Nationality: Thai Address : 192
Petchkasem 28 Rd.,
Pasicharoen, Bangkok |
21,360 |
15.26 |
|
Mr. Pornthep Srichawala Nationality: Thai Address : 361
Sukhumvit 71 Rd.,
Prakanongnua,
Wattana, Bangkok |
17,580 |
12.56 |
|
Mr. Prem Srichawala Nationality: Indian Address : 361
Sukhumvit 71 Rd.,
Prakanongnua,
Wattana, Bangkok |
10,000 |
7.14 |
|
Mr. Rujin Srisotornwong Nationality: Indian Address : 111/13
Rama 4 Rd.,
Thungmahamek, Sathorn, Bangkok |
9,600 |
6.87 |
|
Mrs. Sarjitgor Srichawala Nationality: Thai Address : 361
Sukhumvit 71 Rd.,
Prakanongnua,
Wattana, Bangkok |
8,820 |
6.29 |
|
Mrs. Charanjitgor Srichawala Nationality: Thai Address : 361
Sukhumvit 71 Rd.,
Prakanongnua,
Wattana, Bangkok |
8,820 |
6.29 |
Total Shareholders : 8
Share
Structure [as
at April 30,
2011]
|
Nationality |
Shareholders |
No. of Share |
% Shares |
|
|
|
|
|
|
Thai |
6 |
120,400 |
86.00 |
|
Indian |
2 |
19,600 |
14.00 |
|
Total |
8 |
140,000 |
100.00 |
NAME OF AUDITOR
& CERTIFIED PUBLIC
ACCOUNTANT NO. :
Ms. Nongnart Nothiprapha No.
0826
BALANCE SHEET
[BAHT]
The
latest financial figures
published for December
31, 2010 &
2009 were:
ASSETS
|
Current Assets |
2010 |
2009 |
|
|
|
|
|
Cash and Cash Equivalent |
639,057.78 |
983,768.59 |
|
Trade Accounts Receivable |
53,986,498.71 |
53,947,779.70 |
|
Inventories |
35,305,446.50 |
24,148,567.32 |
|
Other Current Assets |
10,155,211.66 |
3,888,779.00 |
|
|
|
|
|
Total Current Assets
|
100,086,214.65 |
82,968,894.61 |
|
|
|
|
|
Fixed Assets |
430,392,790.64 |
347,093,224.24 |
|
Other Assets |
6,411,554.08 |
5,275,065.92 |
|
Total Assets |
536,890,559.37 |
435,337,184.77 |
LIABILITIES & SHAREHOLDERS’
EQUITY [BAHT]
|
Current
Liabilities |
2010 |
2009 |
|
|
|
|
|
Bank Overdraft & Short-term
Loan from Financial Institution |
258,994,607.57 |
185,086,034.58 |
|
Trade Accounts Payable |
40,853,057.98 |
25,575,967.34 |
|
Other Current Liabilities |
12,093,070.19 |
6,806,439.71 |
|
|
|
|
|
Total Current Liabilities |
311,940,735.74 |
217,468,441.63 |
|
Total Liabilities |
311,940,735.74 |
217,468,441.63 |
|
|
|
|
|
Shareholders’ Equity |
|
|
|
|
|
|
|
Share capital : Baht 1,000
par value authorized, issued
and fully paid share
capital 140,000 shares |
140,000,000.00 |
140,000,000.00 |
|
|
|
|
|
Capital Paid |
140,000,000.00 |
140,000,000.00 |
|
Surplus on Revaluation
of Assets |
19,862,000.00 |
19,862,000.00 |
|
Retained Earning-
Unappropriated |
65,087,823.63 |
58,006,743.14 |
|
Total Shareholders' Equity |
224,949,823.63 |
217,868,743.14 |
|
Total Liabilities & Shareholders' Equity |
536,890,559.37 |
435,337,184.77 |
PROFIT & LOSs ACCOUNT
|
Sale |
2010 |
2009 |
|
|
|
|
|
Sales & Services
Income |
307,061,273.20 |
290,348,550.98 |
|
Other Income |
2,406,398.82 |
3,408,486.55 |
|
Total Sales |
309,467,672.02 |
293,757,037.53 |
|
Expenses |
|
|
|
|
|
|
|
Raw Materials &
Material Supplies |
98,871,999.06 |
92,178,016.25 |
|
Employees Expenses |
74,244,544.57 |
74,605,224.07 |
|
Depreciation & Amortization |
53,987,255.55 |
52,327,389.75 |
|
Other Expenses |
60,986,810.91 |
54,471,860.44 |
|
Total Expenses |
288,090,610.09 |
273,582,490.51 |
|
|
|
|
|
Profit / [Loss] before Financial Cost & Income Tax |
21,377,061.93 |
20,174,547.02 |
|
Financial Cost |
[10,760,914.22] |
[10,921,281.43] |
|
Profit / [Loss] before Income
Tax |
10,616,147.71 |
9,253,265.59 |
|
Income Tax |
[3,271,095.17] |
[2,859,964.36] |
|
|
|
|
|
Net Profit / [Loss] |
7,345,052.54 |
6,393,301.23 |
FINANCIAL ANALYSIS
|
ITEM |
UNIT |
2010 |
2009 |
|
|
|
|
|
|
LIQUIDITY RATIO |
|
|
|
|
CURRENT RATIO |
TIMES |
0.32 |
0.38 |
|
QUICK RATIO |
TIMES |
0.18 |
0.25 |
|
|
|
|
|
|
ACTIVITY RATIO |
|
|
|
|
FIXED ASSETS TURNOVER |
TIMES |
0.71 |
0.84 |
|
TOTAL ASSETS TURNOVER |
TIMES |
0.57 |
0.67 |
|
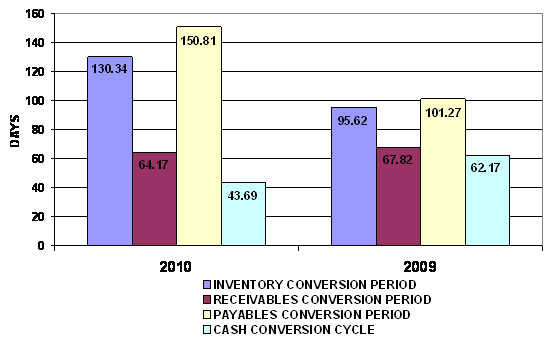
INVENTORY CONVERSION PERIOD |
DAYS |
130.34 |
95.62 |
|
INVENTORY TURNOVER |
TIMES |
2.80 |
3.82 |
|
RECEIVABLES CONVERSION PERIOD |
DAYS |
64.17 |
67.82 |
|
RECEIVABLES TURNOVER |
TIMES |
5.69 |
5.38 |
|
PAYABLES CONVERSION PERIOD |
DAYS |
150.81 |
101.27 |
|
CASH CONVERSION CYCLE |
DAYS |
43.69 |
62.17 |
|
|
|
|
|
|
PROFITABILITY
RATIO |
|
|
|
|
COST OF GOODS SOLD |
% |
32.20 |
31.75 |
|
SELLING & ADMINISTRATION |
% |
44.04 |
44.46 |
|
INTEREST |
% |
3.50 |
3.76 |
|
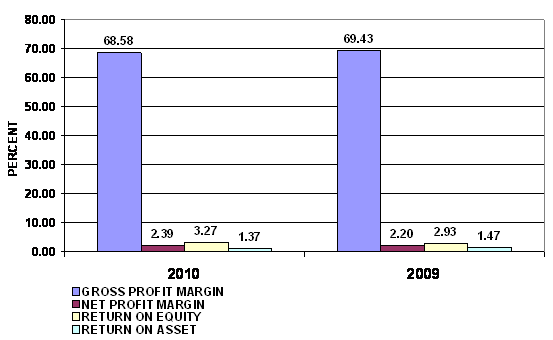
GROSS PROFIT MARGIN |
% |
68.58 |
69.43 |
|
NET PROFIT MARGIN BEFORE EX. ITEM |
% |
6.96 |
6.95 |
|
NET PROFIT MARGIN |
% |
2.39 |
2.20 |
|
RETURN ON EQUITY |
% |
3.27 |
2.93 |
|
RETURN ON ASSET |
% |
1.37 |
1.47 |
|
EARNING PER SHARE |
BAHT |
52.46 |
45.67 |
|
|
|
|
|
|
LEVERAGE RATIO |
|
|
|
|
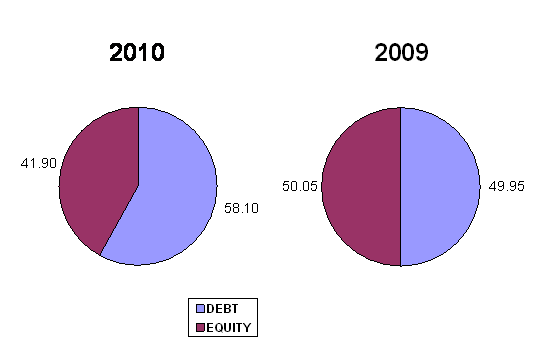
DEBT RATIO |
TIMES |
0.58 |
0.50 |
|
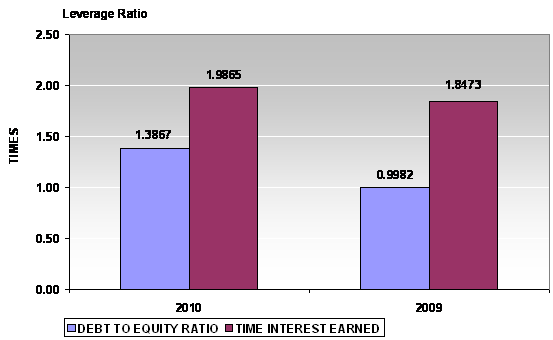
DEBT TO EQUITY RATIO |
TIMES |
1.39 |
1.00 |
|
TIME INTEREST EARNED |
TIMES |
1.99 |
1.85 |
|
|
|
|
|
|
ANNUAL GROWTH |
|
|
|
|
SALES GROWTH |
% |
5.76 |
|
|
OPERATING PROFIT |
% |
5.96 |
|
|
NET PROFIT |
% |
14.89 |
|
|
FIXED ASSETS |
% |
24.00 |
|
|
TOTAL ASSETS |
% |
23.33 |
|
PROFITABILITY RATIO
|
Gross Profit Margin |
68.58 |
Impressive |
Industrial Average |
17.01 |
|
Net Profit Margin |
2.39 |
Impressive |
Industrial Average |
(1.35) |
|
Return on Assets |
1.37 |
Impressive |
Industrial Average |
(1.27) |
|
Return on Equity |
3.27 |
Impressive |
Industrial Average |
(4.34) |
Gross Profit Margin used to assess a firm's financial health by
revealing the proportion of money left over from sales after accounting for the
cost of goods sold. Gross profit margin serves as the source for paying
additional expenses and future savings. Gross Profit Margin is 68.58%. When
compared with the industry average, the ratio of the company was higher. This
indicated that company was more profitable than the same industry.
Net Profit Margin is the indicator of the company's efficiency in that
net profit takes into consideration all expenses of the company. A low profit
margin indicates a low margin of safety, higher risk that a decline in sales
will erase profits and result in a net loss. Net Profit Margin ratio is 2.39%,
higher figure when compared with those of its average competitors in the same
industry, indicated that business was an efficient operator in a dominant
position within its industry.
Return on Assets measures how efficiently profits are being generated
from the assets employed in the business when compared with the ratios of firms
in a similar business. A low ratio in comparison with industry averages
indicates an inefficient use of business assets. Return on Assets ratio is
1.37%, higher figure when compared with those of its average competitors in the
same industry, indicated that business was an efficient profit in a dominant
position within its industry.
Return on Equity indicates how profitable a company is by comparing its
net income to its average shareholders' equity, ROE measures how much the
shareholders earned for their investment in the company. Return on Equity ratio
is 3.27%, higher figure when compared with those of its average competitors in
the same industry, indicated that business was an efficient profit in a
dominant position within its industry.
Trend of the
average competitors in the same industry for last 5 years
Return on Assets Downtrend
Return on Equity Downtrend
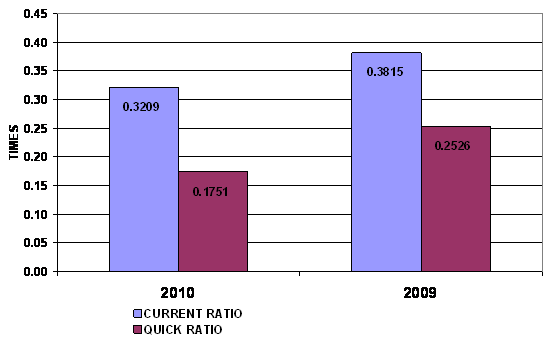
LIQUIDITY RATIO
|
Current Ratio |
0.32 |
Risky |
Industrial Average |
1.00 |
|
Quick Ratio |
0.18 |
|
|
|
|
Cash Conversion Cycle |
43.69 |
|
|
|
The Current Ratio is to ascertain whether a company's short-term assets
are readily available to pay off its short-term liabilities. The company's
figure is 0.32 times in 2010, decrease from 0.38 times, then the company may
not be efficiently using its current assets. When compared with the industry
average, the ratio of the company was lower.
The Quick Ratio is a liquidity indicator that further refines the
current ratio by measuring the amount of the most liquid current assets there
are to cover current liabilities. The company's figure is 0.18 times in 2010,
decrease from 0.25 times, then the company has not enough current assets that
presumably can be quickly converted to cash for pay financial obligations.
The Cash Conversion Cycle measures the number of days a company's cash
is tied up in the production and sales process of its operations and the
benefit from payment terms from its creditors. It meant the company could
survive when no cash inflow was received from sale for 44 days.
Trend of the average
competitors in the same industry for last 5 years
Current Ratio Uptrend
LEVERAGE RATIO
|
Debt Ratio |
0.58 |
Impressive |
Industrial Average |
0.69 |
|
Debt to Equity Ratio |
1.39 |
Satisfactory |
Industrial Average |
2.27 |
|
Times Interest Earned |
1.99 |
Impressive |
Industrial Average |
0.46 |
Debt to Equity Ratio a measurement of how much suppliers, lenders,
creditors and obligors have committed to the company versus what the
shareholders have committed. A lower the percentage means that the company is
using less leverage and has a stronger equity position.
Times Interest Earned measuring a company's ability to meet its debt
obligations. Ratio is 1.99 higher than 1, so the company can pay interest expenses
on outstanding debt.
Debt Ratio shows the proportion of a company's assets which are financed
through debt. The company's figure is 0.58 greater than 0.5, most of the
company's assets are financed through debt.
Trend of the
average competitors in the same industry for last 5 years
Debt Ratio Downtrend
Times Interest Earned Downtrend
ACTIVITY RATIO
|
Fixed Assets Turnover |
0.71 |
Deteriorated |
Industrial Average |
1.52 |
|
Total Assets Turnover |
0.57 |
Acceptable |
Industrial Average |
0.95 |
|
Inventory Conversion Period |
130.34 |
|
|
|
|
Inventory Turnover |
2.80 |
Deteriorated |
Industrial Average |
6.11 |
|
Receivables Conversion Period |
64.17 |
|
|
|
|
Receivables Turnover |
5.69 |
Impressive |
Industrial Average |
3.70 |
|
Payables Conversion Period |
150.81 |
|
|
|
Trend of the
average competitors in the same industry for last 5 years
Fixed Assets Turnover Uptrend
Total Assets Turnover Uptrend
Inventory Turnover Uptrend
Receivables Turnover Uptrend
FOREIGN EXCHANGE RATES
|
Currency |
Unit
|
Indian Rupees |
|
US Dollar |
1 |
Rs.50.90 |
|
UK Pound |
1 |
Rs.80.30 |
|
Euro |
1 |
Rs.68.48 |
RATING EXPLANATIONS
|
RATING |
STATUS |
PROPOSED CREDIT LINE |
|
|
>86 |
Aaa |
Possesses an extremely sound financial base with the strongest
capability for timely payment of interest and principal sums |
Unlimited |
|
71-85 |
Aa |
Possesses adequate working capital. No caution needed for credit
transaction. It has above average (strong) capability for payment of interest
and principal sums |
Large |
|
56-70 |
A |
Financial & operational base are regarded healthy. General
unfavourable factors will not cause fatal effect. Satisfactory capability for
payment of interest and principal sums |
Fairly Large |
|
41-55 |
Ba |
Overall operation is considered normal. Capable to meet normal
commitments. |
Satisfactory |
|
26-40 |
B |
Capability to overcome financial difficulties seems comparatively below
average. |
Small |
|
11-25 |
Ca |
Adverse factors are apparent. Repayment of interest and principal sums
in default or expected to be in default upon maturity |
Limited with
full security |
|
<10 |
C |
Absolute credit risk exists. Caution needed to be exercised |
Credit not
recommended |
|
---- |
NB |
New Business |
---- |
This score serves as a reference to assess SC’s credit risk and
to set the amount of credit to be extended. It is calculated from a composite
of weighted scores obtained from each of the major sections of this report. The
assessed factors and their relative weights (as indicated through %) are as
follows:
Financial
condition (40%) Ownership
background (20%) Payment
record (10%)
Credit history
(10%) Market trend
(10%) Operational
size (10%)
This report is issued at your request without any
risk and responsibility on the part of MIRA INFORM PRIVATE LIMITED (MIPL)
or its officials.