MIRA INFORM REPORT


Report Date :           

07.10.2011


IDENTIFICATION DETAILS


Correct Name :

DYES AND CHEMICALS MANUFACTURING


Registered Office :

147 Boulevard Moulay Slimane, Route de Zenata, Casablanca


Country :

Morocco


Financials (as on) :

31.12.2010


Date of Incorporation :

27.04.1994


Com. Reg. No.:

73901


Legal Form :

Societe A Responsibilite Limitee


Line of Business :

Wholesale of chemical products


RATING & COMMENTS


MIRA’s Rating :

Ba


RATING

STATUS

PROPOSED CREDIT LINE

41-55

Ba

Overall operation is considered normal. Capable to meet normal commitments.

Satisfactory


Maximum Credit Limit :

114,800 EUR


Status :

Satisfactory


Payment Behaviour :

No Complaints


Litigation :

Clear


NOTES :

Any query related to this report can be made on e-mail : infodept@mirainform.com while quoting report number, name and date.


ECGC Country Risk Classification List – March 31st, 2011


Country Name

Previous Rating

                   (31.12.2010)                  

Current Rating

(31.03.2011)

Morocco

a2

a2


Risk Category

ECGC Classification

Insignificant


A1

Low


A2

Moderate


B1

High


B2

Very High


C1

Restricted


C2

Off-credit


D


Company name


DYES AND CHEMICALS MANUFACTURING


Rating Briefing


Current Recommended Credit:              114,800 EUR


Payment Record:                                   NO COMPLAINTS


Registration Briefing


Registration Number:                             73901


Registration Date:                                  27/04/1994


Legal Form:                                           SOCIETE A RESPONSIBILITE LIMITEE


Latest Financials:                                  December 31, 2010


Financial Briefing


Nominal Capital:                                    7,000,000 Moroccan Dirham


Issued Capital:                                       N/A


Turnover:                                               56,984,740 Moroccan Dirham


Net Profit:                                               4,861,331 Moroccan Dirham


Net Worth:                                              30,087,758 Moroccan Dirham


Company Details


Company Name:                                          DYES AND CHEMICALS MANUFACTURING

Also trades as:                                            DYECHEM

Headquarter Address:                                   147 Route de Zenata,

Ain Sebaa,

Casablanca 20600,

Morocco


Telephone:                                                  +212522 309698

+212522 351717

+212522 351779

                                                                  +212522 451442

+212522 546850

+212661 191115

+212673 739210

+212673 739282


Fax:                                                            +212522 351869

+212522 543003


E‑Mail:                                                        m.elhilali@dychem‑colours.com


Company was originally started on 27/04/1994


Registration & Legal Details


Current Legal Form:                                   SOCIETE A RESPONSIBILITE LIMITEE

Registration Address:                                 147 Boulevard Moulay Slimane, Route de Zenata,

                                                                Casablanca

Registration Number:                                  73901

Registration Date:                                      27/04/1994

Year/Date Company Established:                27/04/1994

Registration Town:                                     Casablanca

Tax Registration Number:                           01640806


Capital


Currency:                                                                 Moroccan Dirham

Authorized Capital:                                                               7,000,000

Paid Up Capital:                                                                   7,000,000


Authorized Capital Breakdown


Number of Shares: 70,000          Type of Shares:  None Selected


Issued Shares: 70,000                Value per share: MDH 100.00     Value of this type: 7,000,000.00


Shareholders


Shareholders:


Name/Other Information                                                    Shares Held                              % of Voting/Non‑Voting capital

Mr. Hammad Taoudi Ben Chekroun,                             17,150                                      24.50% (VOTING)

22, Rue Zahraoui Andal,

Casablanca,

Morocco

Mr. Youssef Taoudi Ben Chekroun,                                3,500                                        5.00% (VOTING)

22, Rue Zahraoui Andal,

Casablanca,

Morocco

Mr. Hicham Taoudi Ben Chekroun,                                3,500                                        5.00% (VOTING)

22, Rue Zahraoui Andal,

Casablanca,

Morocco

Mr. Mohamed Ben Abdellah Taoudi Ben                       3,500                                        5.00% (VOTING)

Chekroun,

74, Lotissement Dr. Faraj,

Fes,

Morocco

Mr. Mohamed Ben Hammad Taoudi Ben                       10,500                                      15.00% (VOTING)

Chekroun,

34, Rue Normandie, Maarif,

Casablanca,

Morocco

Mr. Abdellatif Taoudi Ben Chekroun,                            18,550                                      26.50% (VOTING)

74, Lotissement Dr. Faraj,

Fes,

Morocco

Mr. Ali Taoudi Ben Chekroun,                                       13,300                                      19.00% (VOTING)

40, Résidence Des Oranges,

Fes,

Morocco


Principals


Name:                                                       Mr Hammad Taoudi Ben Chekroun

Position within the company:                      Managing director

Date of Birth:                                             1939

Town of Birth:                                            Fes

Country of Birth:                                         Morocco

Nationality:                                                Moroccan

Can fluently speak:                                    Arabic & French


Name:                                                       Mr Mohamed Taoudi Ben Chekroun

Position within the company:                      General Director

Additional Information:                                m.benchekroun@dyechem‑colours.com

Date of Birth:                                             13/04/1967

Town of Birth:                                            Casablanca

Country of Birth:                                         Morocco

Nationality:                                                Moroccan

Can fluently speak:                                    Arabic, French & English

Education:                                                 Degree in management sciences

Work Experience and History:                     3 years experience in United States of America as engineer researcher


Name:                                                       Mr Ali Taoudi Ben Chekroun

Position within the company:                      Administration Manager

Date of Birth:                                             29/02/1952

Town of Birth:                                            Fes

Country of Birth:                                         Morocco

Nationality:                                                Moroccan

Can fluently speak:                                    Arabic & French


Name:                                                       Mr Nabil Diouri

Position within the company:                      Commercial Manager

Country of Birth:                                         Morocco

Nationality:                                                Moroccan

Can fluently speak:                                    Arabic & French


Name:                                                       Mr Mustapha El Hilali

Position within the company:                      Accountant

Additional Information:                                m.elhilali@dyechem‑colours.com

Country of Birth:                                         Morocco

Nationality:                                                Moroccan

Can fluently speak:                                    Arabic & French


Company Activities


NACE Codes:          4675           Wholesale of chemical products ‑ 70%

                              2012           Manufacture of dyes and pigments ‑ 30%


DYECHEM is engaged in manufacture and marketing of dyes and chemicals.


Local Reporters consider the investigated company to be MEDIUM in their field of concern.


Operations


Employees                                               Company Employs: 22


HQ Premises                                            Operates from:     Owned Offices , Factory, Warehouse

Premises Size:                                          4000 square meters

Location:                                                   Industrial Area


Branches                                                 30 Bis Rue Moha Ou Hamou,

Casablanca,

Morocco

Branch is: Owned

Description of branch: Office


Imports


Imports Raw Materials, Imports Finished Goods


Imports From:                                          South East Asia, Europe

Importing Terms:                                      Letters of credit

Additional Information:                              Bank transfer


Exports


Export % and type of product:                   Subject does not export


Trading & Selling


Territory:                                                  100% Nationally

Type of Customer:                                    Industrial Companies & Resellers


Vehicles:                                                  Total number of vehicles: 5

2 trucks

3 cars


Related Companies


Subsidiaries

Affiliates

Information on Related Companies is not available/applicable


Bankers


Crédit Du Maroc,

Branch: Strasbourg

1 Rue de Strasbourg,

Casablanca,

Morocco

Account Number:                                         021780 0000 040 030 153374 63

Relationship with Bank:                                is reported to be good


Financial Information


Source:                                                     Mr. Mustapha El Hilali Accountant

Figures are:                                               Official Figures

Currency:                                                  Moroccan Dirham


Months                       Sales Figures         Sales                                   Gross Profit/Loss            Net

                                                                                                                                                  Profit/Loss

               12                31/12/2011              63,000,000 (Projection)

               12                31/12/2010              56,984,740                           6,829,537                        4,861,331

               12                31/12/2009              49,743,103                           5,514,298                        3,897,224

               12                31/12/2008              45,318,452                           3,732,118                        2,628,617

               12                31/12/2007              35,297,353                           2,956,683                        1,932,757

               12                31/12/2006              30,550,104                           2,616,442                        1,711,335

               12                31/12/2005              20,062,187                           1,997,094                        1,230,122


Balance Sheet & Profit & Loss


                                                                        31/12/2010        31/12/2009        31/12/2008

          Fixed Assets

            Land & Buildings

            Plant & Machinery                                 215,023 179,448 265,381

            Furniture & Equipment                            577,914 455,088 293,235

            Motor Vehicles                                      172,858 96,846              151,942

            Misc. Fixed Assets

            Total Fixed Assets                                             965,795                 731,382                 710,558


            Financial Assets

            Shares in Related Companies

            Loans to related companies

            Investments                                                          50,617                   2,917                      3,417

            Deposits              

            Misc. Financial Assets                                       2,000                      2,000                      2,000

            Total Financial Assets                                       52,617                   4,917                      5,417


            Intangibles

            Goodwill

            Organisational Expenses                                  82,141                   138,416                 194,691

            Patents                                                                  95,241                   17,301                   20,923

            Misc. Intangible Assets

            Total Intangible Assets                                     177,382                 155,717                 215,614


            Current Assets

            Stock                                                                      12,447,068           11,697,749           10,993,517

            Stock & Work in Progress                                  114,868                 150,085                 582,062

            Trade Debtors & receivables                            24,861,471           21,130,995           19,826,908

            Provision for bad debs

            Other receivables                                                                126,718                 122,521                 87,802

            Due from related companies

            Owed by shareholders

            Prepaid expenses                                               244,371                 34,466                   264,386

            Cash                                                                      2,729,185              3,151,429              744,492

            Tax recoverable                                                   1,447,121              1,410,512              948,233

            Marketable Securities

            Misc. Current Assets                                          21,827                   32,771                   32,813

            Total Current Assets                                         41,992,629           37,730,528           33,480,213

            Total Assets                                                        43,188,423           38,622,544           34,411,802

            Owner's Equity & Liabilities

            Issued and paid up capital                                                7,000,000              7,000,000              7,000,000

            Share premium account

            Retained earnings                                              17,315,105           13,612,743           11,115,557

            Net profit/Loss for the year                                                4,861,331              3,897,224              2,628,617

            Revaluation reserves

            Legal Reserves                                                   911,322                 716,460                 585,029

            Other reserves

            Net Worth                                                             30,087,758           25,226,427           21,329,203


Deffered Taxation

            Provisions/allowances

            Mortgages/Loans

            Hire purchase

            Due to group of companies

            Minority interest

            Misc. deferred liabilities

            Total Long Term Liabilities                                              0                              0                                              0


            Current Liabilities

            Creditors                                                               6,484,700              6,013,159                              6,213,625

            Other creditors                                                     4,500                      134,541                                 19,119

            Accruals                                                                                6,402                      6,402

            Bank overdrafts/Loans                                                                                                                       715,668

            Misc. Loans

            Directors accounts

            Owing to shareholders                                      2,912,160              2,912,160                              2,912,160

            Owing to related companies

            Proposed dividend

            Long Term‑due 1 year

            Hire Purchase‑under 1 year

            Taxation                                                                 3,493,406              3,654,898                              3,056,767

            Advance receipts                                                                                 501,575

            Misc. Current Liabilities                                     199,497                 173,382                                 165,260

            Total Current Liabilities                                    13,100,665           13,396,117                           13,082,599

            Owner's Equity & Liabilities                             43,188,423           38,622,544                           34,411,802


PROFIT & LOSS


            Figures are:                   Figures are:                               Figures are:

            Fiscal Year                    Fiscal Year                                Fiscal Year


                                                            01/01/2010

to 31/12/2010                01/01/2009

 to 31/12/2009                           01/01/2008 to

31/12/2008


            Total Income/Turnover                             56,984,740                    49,743,103                    45,318,452

            Cost of sales                                         33,117,160                    29,737,291                    28,367,984


            Gross Profit/(Loss)                                 23,867,580                    20,005,812                    16,950,468


            Admin/selling expenses                          10,719,307                    8,226,918                      7,706,894

            Services                                                2,631,176                      2,064,893                      1,968,287

            Salaries                                                3,532,221                      3,463,198                      3,275,951

            Auditors Fee                                          71,495                          85,626                          116,236

            Stock Depreciation                                 ‑9,931                           373,684             ‑348,928

            Depreciation                                          326,499             341,114             422,844

            Misc. Operating Expenses

            Misc. Operating Income                                                              15,324                          3,323

            Net Operating Profit/(Loss)                   6,596,813                      5,465,703                      3,812,507


            Interest Receivable/Finance Income

            Group related income

            Misc. Financial Income                           523,459 375,570 304,884

            Total Financial Income                                    523,459 375,570 304,884


            Interest Payable/Finance costs               4,440                63,110              149,711

            Misc. financial expenses                        286,295 263,865 235,562

            Total Financial Expenses                    290,735 326,975 385,273


            Profit/(Loss) before taxes                     6,829,537          5,514,298          3,732,118


            Income Tax                                           1,968,206          1,617,074          1,103,501

            Other Tax

            Profit/(Loss) after taxes                        4,861,331          3,897,224          2,628,617


            Extraordinary items

            Exceptional items

            Misc. Items


            Net Profit/(Loss)                                   4,861,331          3,897,224          2,628,617


            Previous years retained earnings

            Current years net income                        4,861,331          3,897,224          2,628,617

            Misc. additions in current year

            Current years net loss

            Dividends in current year

            Withdrawals in current year

            Misc. deductions in current year


            Retained earnings at end of                4,861,331          3,897,224          2,628,617

            financial period


            Average employees


            Directors fee

            Earnings per share

            Earnings per share‑previous year


Auditors Comments


Date accounts obtained:                          05/10/2011

Accounts obtained from:                          Companies registry


Auditors Opinion:                                     The audited financial statement gives a true and fair view of the state

                                                                of affairs of the subject Financial Statements have been prepared on

                                                                an on‑going basis.


                                                                Assuming support of: shareholders


FINANCIAL RATIOS / COMPARATIVE DATA


                                      Actual Company      Industrial Averages     Actual Company      Industrial Averages

                                        Results (2010)                   (2010)                   Results (2009)                   (2009)

  Liquidity Ratios

  Current Ratio                                      3.21                            1.43                           2.82                            1.43

  Acid Test Ratio                                   2.25                            0.95                           1.93                            0.90

  Accounts                                            0.11                            0.32                           0.12                            0.45

  Payable/Sales Ratio

  Current Liabilities/Net                          0.44                            4.52                           0.53                         ‑19.96

  Worth

  Current                                               1.04                            2.37                           1.13                            3.61

  Liabilities/Inventory

  Total Liabilities/Net                              0.44                            4.60                           0.53                         ‑19.69

  Worth

  Fixed Assets/Net                                3.21                          46.79                           2.90                          65.16

  Worth (%)


  Profitability Ratios

  Gross Profit Ratio (%)                        41.88                          26.98                          40.22                          22.76

  Return on Capital                               22.70                          21.88                          21.86                       ‑130.12

  Employed (ROCE)(%)

  Net Profit/Sales (%)                           11.98                            3.71                          11.09                            1.79

  Return on Assets (%)                        15.81                            5.33                          14.28                            3.96


  Efficiency Ratios

  Sales/Working Capital                         1.97                            6.89                           2.04                            6.42

  Assets/Sales(%)                               75.79                        100.77                          77.64                        128.91

  Shareholders                                     22.70                          23.38                          21.86                       ‑132.17

  Return(%)

  Average Inventory                             133.06                        157.80                        139.26                        168.90

  Period

  Average Collection                           147.30                        135.41                        150.27                        139.25

  Period

  Sales/Inventory                                   4.54                            4.32                           4.20                            5.16


  Leverage Ratios

  Capital Employed                                1.91                            7.99                           1.98                            7.89


  Number of                                                                             416                                                              416

  Companies within the

  industry (NACE G)

  Statistics based on                                       Wholesale and retail                                      Wholesale and retail

  NACE(G)                                                      trade;repair of motor                                      trade;repair of motor

                                                                     vehicles and                                                  vehicles and

                                                                     motorcycles                                                  motorcycles


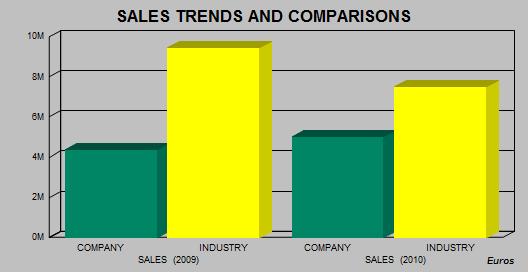
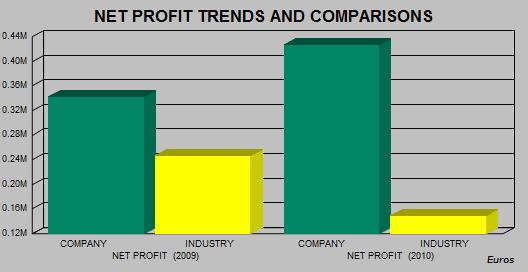
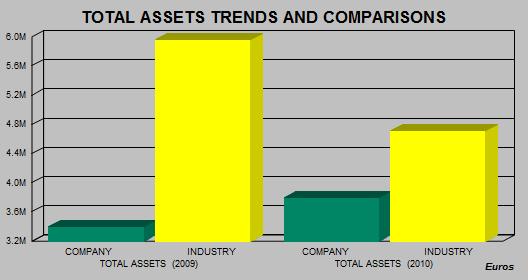
INDUSTRY SECTOR COMPARATIVE DATA


        Elements Taken              Result for specific                    RANKING                Total Companies Used

                                                      company

DATE OF REGISTRATION                        27/04/1994                                    471                                  1080

TOTAL EMPLOYEES                                            22                                    321                                    985

SALES (2010)                                            5,010,098                                      44                                    159

SALES (2009)                                            4,373,414                                      91                                    403

NET PROFIT (2010)                                      427,408                                      10                                    102

NET PROFIT (2009)                                      342,644                                      43                                    412

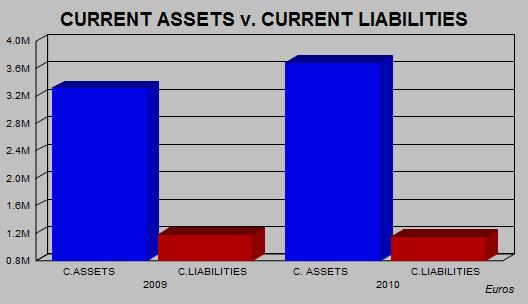
TOTAL ASSETS (2010)                              3,797,126                                      33                                    100

TOTAL ASSETS (2009)                              3,395,694                                    108                                    413
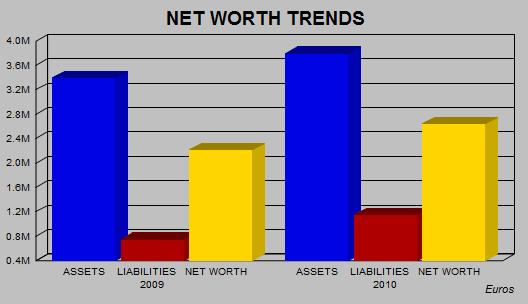
 

                                                                                                                                        Currency: EUROS


Charts of Financial Trends and Industry Comparisons


PLEASE NOTE THAT CHARTS ARE SHOWN IN EUROS FOR TREND AND COMPARISON PURPOSES


The statistical Industrial Average results are calculated against companies within the Rime database for the specific country.


Payments


Subject's payments reported to be:        NO COMPLAINTS


Representation


Auditors:                                                   REVISCONTROLE

Rue Ibn El Mouataz, Résidence le Joyau 4, First Floor

Tel:                                                           212522 242304


Other Comments


Other Comments:                                      Patent N° : 31504535


Interview & Reporter Comments


Name/Title:                                                Mr. Mustapha El Hilali Accountant


Comment:                                                 Subject has confirmed the general details shown in the report.


Expansion Plans:                                       The company plans to build a new plant in the industrial area of

                                                                OULAD SALEH, BOUSKOURA ‑ CASABLANCA.


Conclusions


Local Reputation:           The company being investigated is considered by local reporters to be a Fair / Normal

Trade Risk.


General Conclusion:       Local informants consider granting of credit to be a fair trade risk.


Owner/Shareholders

Comments:                   Some of the owners / shareholders have an active participation in the  running of the

business.


Financial Results Trend: Financial Information indicates that the business activities of the company are

showing an upward turn.


Age of Business:           The company is a long established family run business.


FOREIGN EXCHANGE RATES


Currency

Unit

Indian Rupees

US Dollar

1

Rs.49.19

UK Pound

1

Rs.75.92

Euro

1

Rs.65.44


RATING EXPLANATIONS


RATING

STATUS


PROPOSED CREDIT LINE

>86

Aaa

Possesses an extremely sound financial base with the strongest capability for timely payment of interest and principal sums


Unlimited

71-85

Aa

Possesses adequate working capital. No caution needed for credit transaction. It has above average (strong) capability for payment of interest and principal sums


Large

56-70

A

Financial & operational base are regarded healthy. General unfavourable factors will not cause fatal effect. Satisfactory capability for payment of interest and principal sums


Fairly Large

41-55

Ba

Overall operation is considered normal. Capable to meet normal commitments.


Satisfactory

26-40

B

Capability to overcome financial difficulties seems comparatively below average.


Small

11-25

Ca

Adverse factors are apparent. Repayment of interest and principal sums in default or expected to be in default upon maturity


Limited with full security

<10

C

Absolute credit risk exists. Caution needed to be exercised


Credit not recommended

----

NB

New Business

----


This score serves as a reference to assess SC’s credit risk and to set the amount of credit to be extended. It is calculated from a composite of weighted scores obtained from each of the major sections of this report. The assessed factors and their relative weights (as indicated through %) are as follows:


Financial condition (40%)            Ownership background (20%)                 Payment record (10%)

Credit history (10%)                    Market trend (10%)                                Operational size (10%)


PRIVATE & CONFIDENTIAL : This information is provided to you at your request, you having employed MIPL for such purpose. You will use the information as aid only in determining the propriety of giving credit and generally as an aid to your business and for no other purpose. You will hold the information in strict confidence, and shall not reveal it or make it known to the subject persons, firms or corporations or to any other. MIPL does not warrant the correctness of the information as you hold it free of any liability whatsoever. You will be liable to and indemnify MIPL for any loss, damage or expense, occasioned by your breach or non observance of any one, or more of these conditions

This report is issued at your request without any risk and responsibility on the part of MIRA INFORM PRIVATE LIMITED (MIPL) or its officials.