MIRA INFORM REPORT


Report Date :  

08.10.2011


IDENTIFICATION DETAILS


Correct Name :

PRODUCTION MARAICHERE ET HORTICOLE DU MASSA 


Registered Office :

Route de Tiznit, Km 39, Tin Mansour ‑ Chtouka Ait Baha, Agadir


Country :

Morocco


Financials (as on) :

30.06.2010


Date of Incorporation :

08.12.1988


Com. Reg. No.:

5965


Legal Form :

Societe Anonyme


Line of Business :

Growing of vegetables and melons, roots and tubers


RATING & COMMENTS


MIRA’s Rating :

Ba


RATING

STATUS

PROPOSED CREDIT LINE

41-55

Ba

Overall operation is considered normal. Capable to meet normal commitments.

Satisfactory


Maximum Credit Limit :

1,071,800 EUR


Status :

Satisfactory


Payment Behaviour :

No Complaints


Litigation :

Clear


NOTES :

Any query related to this report can be made on e-mail : infodept@mirainform.com while quoting report number, name and date.


ECGC Country Risk Classification List – March 31st, 2011


Country Name

Previous Rating

                   (31.12.2010)                  

Current Rating

(31.03.2011)

Morocco

a2

a2


Risk Category

ECGC Classification

Insignificant


A1

Low


A2

Moderate


B1

High


B2

Very High


C1

Restricted


C2

Off-credit


D


Company name


PRODUCTION MARAICHERE ET HORTICOLE DU MASSA


Rating Briefing


Current Recommended Credit:                1,071,800 EUR


Payment Record:                                   NO COMPLAINTS


This rating is based on available data. In the event of additional information a possibility for a different rating applies.


Registration Briefing


Registration Number:      5965


Registration Date:          08/12/1988


Legal Form:                   SOCIETE ANONYME


Latest Financials:          June 30, 2010


Financial Briefing


Nominal Capital:            50,000,000 Moroccan Dirham


Issued Capital:               N/A


Turnover:                       531,971,796 Moroccan Dirham


Net Loss:                      4,926,577


Net Worth:                    193,705,761 Moroccan Dirham


Company Details


Company Name:            PRODUCTION MARAICHERE ET HORTICOLE DU MASSA

Also trades as:              SOCIETE MARAISSA

Headquarter Address:     Route de Tiznit, Km 39, Tin Mansour,

Belfaa Chtouka Ait Baha,

Agadir,

Morocco


Telephone:                    +212528 303000

+212528 303011


Fax:                              +212528 303010


E‑Mail:                          secretariat@azura‑maroc.com

Web Site:                      www.azura‑group.com


Company was originally started on 12/05/1988


Registration & Legal Details


Current Legal Form:                   SOCIETE ANONYME

Registration Address:                 Route de Tiznit, Km 39, Tin Mansour ‑ Chtouka Ait Baha,

                                                Agadir

Registration Number:                  5965

Registration Date:                      08/12/1988

Year/Date Company Established:            12/05/1988

Registration Town:                     Inzegane

Tax Registration Number:           06901728


Capital


Currency:                      Moroccan Dirham

Authorized Capital:         50,000,000

Paid Up Capital: 50,000,000


Previous Capital amount:            21,000,000


Capital increase on 2007


Authorized Capital Breakdown


Number of Shares: 50,000          Type of Shares:  None Selected


Issued Shares: 50,000                Value per share: MDH 1,000.00   Value of this type: 50,000,000.00


Shareholders


Shareholders:


Name/Other Information                                                    Shares Held                              % of

                                                                                                                          Voting/Non‑Voting

                                                                                                                          capital

          STIDIA,                                                                25,000                                      50.00% (VOTING)

          18‑20 Rue Michel Rodande ‑ 25000,

          Luxembourg

          AU PORTEUR                                                       24,997                                      49.99% (VOTING)

          Mr. Mohamed Tazi,                                              1

          51, Boulevard La Gironde,

          Casablanca,

          Morocco

          Mrs. Fatima Rizk Tazi,                                         1

          51, Boulevard La Gironde,

          Casablanca,

          Morocco

          Ms Ghita Tazi,                                                      1

          51, Boulevard La Gironde,

          Casablanca,

          Morocco


Principals


Name:                                                       Mr Mohamed Tazi

Position within the company:                      President

Date of Birth:                                             05/06/1944

Country of Birth:                                         Morocco

Nationality:                                                Moroccan

Can fluently speak:                                    Arabic, French & English


Name:                                                       Mr Pierre Boniol

Position within the company:                      General Director

Date of Birth:                                             31/01/1958

Nationality:                                                French

Can fluently speak:                                    French


Name:                                                       Mr Hervé Chartin

Position within the company:                      Commercial Manager

Nationality:                                                French

Can fluently speak:                                    French


Name:                                                       Mr Lahoussine Baih

Position within the company:                      Chief Accountant

Country of Birth:                                         Morocco

Nationality:                                                Moroccan

Can fluently speak:                                    Arabic & French


Name:                                                       Ms Fatima Najah

Position within the company:                      Import Manager

Country of Birth:                                         Morocco

Nationality:                                                Moroccan

Can fluently speak:                                    Arabic & French


Company Activities


NACE Codes:    0113     Growing of vegetables and melons, roots and tubers


The company is specialised in production, packaging and exportation of vegetables specially tomatoes.


Local Reporters consider the investigated company to be LARGE in their field of concern.


Operations


  Employees                                             Company Employs: 2000


        HQ Premises                                    Operates from:     Owned Office , Factory, Warehouse

                                                                Location:             Rural Area


         Branches                                        Lotissement Attaoufik, N° 29 Rue 1,

                                                                Sidi Maarouf,

                                                                Casablanca,

                                                                Morocco

                                                                Description of branch: Office


  Imports


                                                              Import % and type of product:     80% Raw Materials

                                                              Imports From:                            Spain, France, Netherlands, Canada,

                                                                                                              Egypt

                                                              Importing Terms:                        Bank transfer


Exports


                                                              Export % and type of product:     98%

                                                              Exports To:                                France, Europe

                                                              Exporting Terms:                        bank transfer


Trading & Selling


                                                               Territory:                                   2% Nationally, 98% International

                                                              Type of Customer:                     Distributors


Related Companies


         Subsidiaries

                                  STE MAROCAINE DE

                                  PRODUCTION D'AGRUMES

                                  Lotissement Attaoufik N° 29 Rue 1 ‑   Owned 67% by subject

                                  Sidi Maarouf,

                                  Casablanca,

                                  Morocco

                                                                                        Start date: 2008

                                 Operates as: Agriculture


         Affiliates

                                  PRIMESUD

                                  Agadir,                                           Owned 33% by subject

                                  Morocco

                                  Operates as: Agriculture


Bankers


        Société Générale,

        Branch: Head office

        55 Boulevard Abdelmoumen,

        Casablanca,

        Morocco


Financial Information


        Source:                                             Companies Registry

        Figures are:                                       Official Figures

        Currency:                                          Moroccan Dirham


Months   Sales Figures                             Sales                                   Gross Profit/Loss            Net

                                                                                                                                                  Profit/Loss

               12                30/06/2010              531,971,796                         (4,926,577)                      (4,926,577)

               12                30/06/2009              551,588,326                         8,120,892                        8,120,892

               12                30/06/2007              356,177,669                         10,163,110                      10,163,110

               12                30/06/2006              238,517,780                         (864,653)                         (864,653)


Balance Sheet & Profit & Loss

                                                As at:   30‑Jun‑2010                   As at:   30‑Jun‑2009 As at:         30‑Jun‑2007

  Fixed Assets

Land & Buildings                        38,123,823                                41,402,281                                47,661,162

Plant & Machinery                     117,682,903                              110,260,918                              126,130,104

Furniture & Equipment                4,217,823                                  4,793,103                                  4,036,333

Motor Vehicles                          41,011                                      115,948                         713,547

Misc. Fixed Assets                    20,332,784                                24,782,539                                28,278,451

Total Fixed Assets                   180,398,344                              181,354,789                              206,819,597


Financial Assets

Shares in Related Companies     2,999,500                                  2,999,500

Loans to related companies

Investments                               163,200                         140,500                         3,549,180

Deposits

Misc. Financial Assets               198,400                         75,100                                      75,600

Total Financial Assets              3,361,100                                  3,215,100                                  3,624,780


Intangibles

Goodwill

Organisational Expenses            24,167                                      53,167                          111,167

Patents                                     479,627                         166,810             204,142

Misc. Intangible Assets

Total Intangible Assets            503,794                         219,977             315,309


Current Assets

Stock                                        34,686,171                                33,603,871                    25,931,301

Stock & Work in Progress          34,460,108                                25,677,371                    27,191,860

Trade Debtors & receivables        38,124,441                                55,756,798                    64,540,448

Provision for bad debs

Other receivables                       22,660,649                                23,530,618                    27,359,782

Due from related companies

Owed by shareholders   

Prepaid expenses                      4,920,765                                  4,151,913                      1,460,954

Cash                                         35,965,083                                61,275,002                    43,723,067

Tax recoverable                                                  28,387,921                    21,822,985                    16,734,994

Marketable Securities

Misc. Current Assets                                         8,878,920                      8,782,413                      30,170,930

Total Current Assets                                          208,084,058                  234,600,971                  237,113,336

Total Assets                                                      392,347,296                  419,390,837                  447,873,022

Owner's Equity & Liabilities

Issued and paid up capital                                  50,000,000                    50,000,000                    50,000,000

Share premium account

Retained earnings                                              145,215,860                  151,501,013                  148,202,774

Net profit/Loss for the year                                  ‑4,926,577                     8,120,892                      10,163,110

Revaluation reserves

Legal Reserves                                                  3,416,478                      3,010,434                      2,100,000

Other reserves

Net Worth                                                         193,705,761                  212,632,339                  210,465,884


Deffered Taxation

Provisions/allowances                                        2,519,821                      3,529,154                      550,000

Mortgages/Loans                                               41,096,381                    64,947,706                    107,952,611

Hire purchase

Due to group of companies

Minority interest

Misc. deferred liabilities


Total Long Term Liabilities                                  43,616,202                    68,476,860                    108,502,611


Current Liabilities

Creditors                                                           80,160,886                    114,330,383                  110,551,649

Other creditors                                                                                                   249,900 12,772,055

Accruals                                                           868,335                         577,035 1,934,409

Bank overdrafts/Loans                                        55,012,734                                6,978                11,031,177

Misc. Loans

Directors accounts

Owing to shareholders                                        14,020,615                        6,365,304                  986,797

Owing to related companies

Proposed dividend

Long Term‑due 1 year

Hire Purchase‑under 1 year

Taxation                                                            59,423                          46,090

Advance receipts                                                                                   36,917

Misc. Current Liabilities                                      4,653,440                      4,146,876                      4,400,495

Total Current Liabilities                                       155,025,333                  138,281,638                  128,904,527

Owner's Equity & Liabilities                                 392,347,296                  419,390,837                  447,873,022


PROFIT & LOSS


Figures are:                   Figures are:                               Figures are:

Fiscal Year                    Fiscal Year                                Fiscal Year


                                            01/07/2009 to 30/06/2010          01/07/2008 to 30/06/2009         01/07/2006 to 30/06/2007

Total Income/Turnover                             531,971,796                              551,588,326                  356,177,669

Cost of sales


Gross Profit/(Loss)                                 531,971,796                              551,588,326                  356,177,669


Admin/selling expenses                          311,675,943                              276,509,505                  152,306,598

Services                                                90,490,252                                124,597,842                  72,019,845

Salaries                                                80,151,026                                60,638,234                    94,791,071

Auditors Fee                                          776,345                         1,042,898                      879,229

Stock Depreciation                                 ‑8,782,737                                 2,368,555                      ‑19,453,768

Depreciation                                          58,437,549                                72,845,223                    56,624,650

Misc. Operating Expenses                                                                                                          4,486,598

Misc. Operating Income                          36,940                                      200,000             16,608

Net Operating Profit/(Loss)                   ‑739,642                                    13,786,069                    ‑5,459,946


Interest Receivable/Finance Income

Group related income

Misc. Financial Income                           2,068,236                                  1,556,919                      36,983,723

Total Financial Income                                    2,068,236                                  1,556,919                      36,983,723


Interest Payable/Finance costs               5,978,869                                  6,528,360                      9,430,969

Misc. financial expenses                        276,302                         693,736             11,929,698

Total Financial Expenses                    6,255,171                                  7,222,096                      21,360,667


Profit/(Loss) before taxes                     ‑4,926,577                                 8,120,892                      10,163,110


Income Tax

Other Tax

Profit/(Loss) after taxes                        ‑4,926,577                                 8,120,892                      10,163,110


Extraordinary items

Exceptional items

Misc. Items


Net Profit/(Loss)                                               ‑4,926,577                                 8,120,892          10,163,110


Previous years retained earnings

Current years net income                                                                                    8,120,892          10,163,110

Misc. additions in current year

Current years net loss                                            ‑4,926,577

Dividends in current year

Withdrawals in current year

Misc. deductions in current year


Retained earnings at end of                                        ‑4,926,577                     8,120,892          10,163,110

financial period


Average employees


Directors fee

Earnings per share

Earnings per share‑previous year


Auditors Comments


Accounts obtained from:             Companies registry


Auditors Opinion:                       The audited financial statement gives a true and fair view of the state of affairs of

the subject


Financial Statements have been prepared on an on‑going basis.


Assuming support of: shareholders


FINANCIAL RATIOS / COMPARATIVE DATA


                                      Actual Company      Industrial Averages     Actual Company      Industrial Averages

                                        Results (2010)                   (2010)                   Results (2009)                   (2009)

  Liquidity Ratios

  Current Ratio                                      1.34                            1.34                           1.70                            1.45

  Acid Test Ratio                                   0.90                            0.90                           1.27                            1.03

  Accounts                                            0.15                            0.15                           0.21                            0.36

  Payable/Sales Ratio

  Current Liabilities/Net                          0.80                            0.80                           0.65                            2.04

  Worth

  Current                                               2.24                            2.24                           2.33                            2.42

  Liabilities/Inventory

  Total Liabilities/Net                              1.03                            1.03                           0.97                            6.26

  Worth

  Fixed Assets/Net                              93.13                          93.13                          85.29                        464.95

  Worth (%)


  Profitability Ratios

  Gross Profit Ratio (%)                      100.00                        100.00                        100.00                        100.00

  Return on Capital                               ‑2.08                           ‑2.08                           2.89                            3.39

  Employed (ROCE)(%)

  Net Profit/Sales (%)                            ‑0.93                           ‑0.93                           1.47                            1.23

  Return on Assets (%)                         ‑1.26                           ‑1.26                           1.94                            1.15


  Efficiency Ratios

  Sales/Working Capital                       10.03                          10.03                           5.73                            6.23

  Assets/Sales(%)                               73.75                          73.75                          76.03                        173.45

  Shareholders                                     ‑2.54                           ‑2.54                           3.82                            4.18

  Return(%)

  Average Collection                             32.21                          32.21                                                           68.47

  Period

  Sales/Inventory                                   7.69                            7.69                           9.30                            6.34


  Leverage Ratios

  Capital Employed                                2.75                            2.75                           2.60                            3.62

  Capital Structure (%)                         18.38                          18.38                          24.36                          56.71


  Number of                                                                                 7                                                                  7

  Companies within the

  industry (NACE A)

  Statistics based on                                       Agriculture, forestry                                       Agriculture, forestry

  NACE(A)                                                      and fishing                                                    and fishing


The statistical Industrial Average results are calculated against  companies within the Rime database for the specific country.


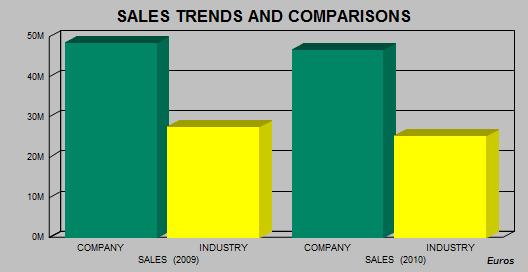
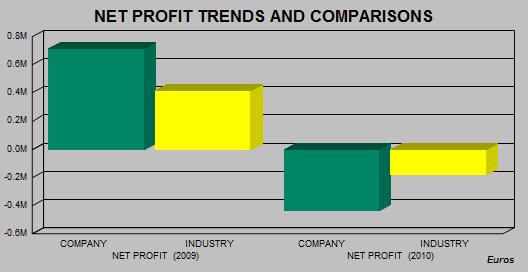
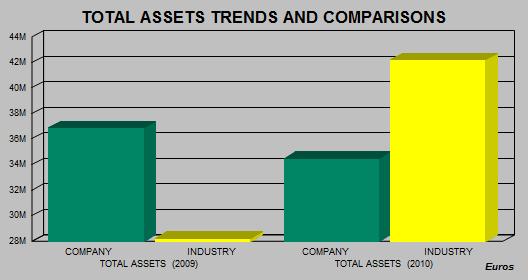
INDUSTRY SECTOR COMPARATIVE DATA


Elements Taken                      Result for specific                    RANKING                Total Companies Used

                                                      company

DATE OF REGISTRATION                        08/12/1988                                       4                                       9

TOTAL EMPLOYEES                                       2,000                                       2                                     10

SALES (2010)                                          46,770,960                                       1                                       4

SALES (2009)                                          48,495,646                                       1                                       6

NET PROFIT (2010)                                     ‑433,145                                       2                                       2

NET PROFIT (2009)                                      713,989                                       1                                       4

TOTAL ASSETS (2010)                             34,495,174                                       2                                       3

TOTAL ASSETS (2009)                             36,872,842                                       2                                       7


                                                                                                                                        Currency: EUROS

Rankings:

The results given below are calculated against companies with the Rime Database for the specific country.


Scale: 1 is the highest result found in our database.

Example: Ranking 5: Total Companies used to generate the Ranking : 20


This means that this company is the 5th largest company out of 20 found in our database in the specific industry


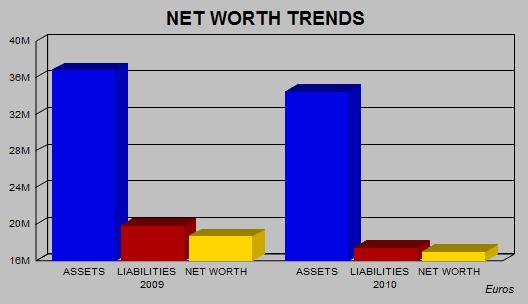
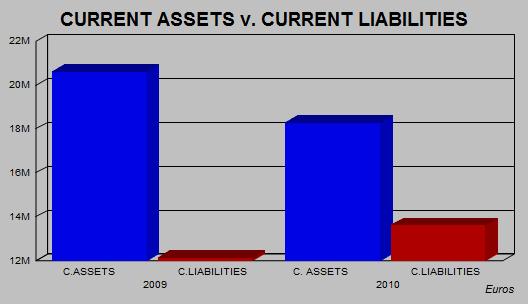
Charts of Financial Trends and Industry Comparisons


PLEASE NOTE THAT CHARTS ARE SHOWN IN EUROS FOR TREND AND COMPARISON PURPOSES


The statistical Industrial Average results are calculated against companies within the Rime database for the  specific country.


Payments


Subject's payments reported to be:        NO COMPLAINTS


Representation


Other Comments

Other Comments:                                      Patent N° : 48882355


Interview & Reporter Comments

Comment:                                                 Subject has confirmed the general details shown in the report.


Conclusions

Local Reputation:                                       The company being investigated is considered by local reporters to be

                                                                a Fair / Normal Trade Risk.


Owner/Shareholders Comments:                 Some of the owners / shareholders have an active participation in the

                                                                running of the business.


Financial Results Trend:                             Financial Information indicates that the business activities of the

                                                                company are declining in strength.


Age of Business:                                       The company is long established in the local market.


FOREIGN EXCHANGE RATES


Currency

Unit

Indian Rupees

US Dollar

1

Rs.49.14

UK Pound

1

Rs.75.97

Euro

1

Rs.65.99


RATING EXPLANATIONS


RATING

STATUS


PROPOSED CREDIT LINE

>86

Aaa

Possesses an extremely sound financial base with the strongest capability for timely payment of interest and principal sums


Unlimited

71-85

Aa

Possesses adequate working capital. No caution needed for credit transaction. It has above average (strong) capability for payment of interest and principal sums


Large

56-70

A

Financial & operational base are regarded healthy. General unfavourable factors will not cause fatal effect. Satisfactory capability for payment of interest and principal sums


Fairly Large

41-55

Ba

Overall operation is considered normal. Capable to meet normal commitments.


Satisfactory

26-40

B

Capability to overcome financial difficulties seems comparatively below average.


Small

11-25

Ca

Adverse factors are apparent. Repayment of interest and principal sums in default or expected to be in default upon maturity


Limited with full security

<10

C

Absolute credit risk exists. Caution needed to be exercised


Credit not recommended

----

NB

New Business

----


This score serves as a reference to assess SC’s credit risk and to set the amount of credit to be extended. It is calculated from a composite of weighted scores obtained from each of the major sections of this report. The assessed factors and their relative weights (as indicated through %) are as follows:


Financial condition (40%)            Ownership background (20%)                 Payment record (10%)

Credit history (10%)                    Market trend (10%)                                Operational size (10%)


PRIVATE & CONFIDENTIAL : This information is provided to you at your request, you having employed MIPL for such purpose. You will use the information as aid only in determining the propriety of giving credit and generally as an aid to your business and for no other purpose. You will hold the information in strict confidence, and shall not reveal it or make it known to the subject persons, firms or corporations or to any other. MIPL does not warrant the correctness of the information as you hold it free of any liability whatsoever. You will be liable to and indemnify MIPL for any loss, damage or expense, occasioned by your breach or non observance of any one, or more of these conditions

This report is issued at your request without any risk and responsibility on the part of MIRA INFORM PRIVATE LIMITED (MIPL) or its officials.