![]()
MIRA INFORM REPORT
|
Report Date : |
19.10.2011 |
IDENTIFICATION DETAILS
|
Name : |
KOBE STEEL, LTD. |
|
|
|
|
Registered Office : |
2-10-26 Wakihama-cho, Chuo-ku, Kobe-shi, 651-8585 |
|
|
|
|
Country : |
Japan |
|
|
|
|
Financials (as on) : |
31.03.2011 |
|
|
|
|
Date of Incorporation : |
28.06.1911 |
|
|
|
|
Legal Form : |
Public Parent Company |
|
|
|
|
Line of Business : |
Subject is engaged in Iron and Steel segment, Welding segment, Aluminum and Copper segment, Machinery segment, Resources and Engineering and Kobelco Crane segment |
RATING & COMMENTS
|
MIRA’s Rating : |
Ba |
|
RATING |
STATUS |
PROPOSED CREDIT LINE |
|
|
41-55 |
Ba |
Overall operation is considered normal. Capable to meet normal
commitments. |
Satisfactory |
|
Status : |
Satisfactory |
|
|
|
|
Payment
Behaviour : |
No Complaints |
|
|
|
|
Litigation : |
Clear |
NOTES :
Any query related to this report can be made
on e-mail : infodept@mirainform.com
while quoting report number, name and date.
ECGC Country Risk Classification List – September 30th, 2011
|
Country Name |
Previous Rating (30.06.2011) |
Current Rating (30.09.2011) |
|
Japan |
a1 |
a1 |
|
Risk Category |
ECGC
Classification |
|
Insignificant |
A1 |
|
Low |
A2 |
|
Moderate |
B1 |
|
High |
B2 |
|
Very High |
C1 |
|
Restricted |
C2 |
|
Off-credit |
D |
Company name & address
Kobe Steel, Ltd.
2-10-26 Wakihama-cho
Chuo-ku
Kobe-shi, 651-8585
Japan
Tel: 81-78-2615183
Fax: 81-78-2614123
Web: www.kobelco.co.jp
Synthesis
Employees: 34,772
Company Type: Public Parent
Corporate Family: 33 Companies
Traded: Tokyo Stock Exchange: 5406
Over The Counter: KBSTY
Incorporation Date: 28-Jun-1911
Auditor: KPMG LLP
Financials in: USD
(Millions) ![]()
Fiscal Year End: 31-Mar-2011
Reporting Currency: Japanese Yen
Annual Sales: 21,689.1 1
Net Income: 617.8
Total Assets: 26,924.8 2
Market Value: 5,294.1
(30-Sep-2011)
Business Description
Kobe Steel, Ltd. is a steel manufacturer with nine business segments. The Iron and Steel segment manufactures and sells steel bars, stainless-steel products and titanium products. The Welding segment offers welding materials, welding robots, and conducts welding-related consulting business. The Aluminum and Copper segment offers rolled aluminum products, rolled copper products, aluminum alloy products, magnesium alloy products and aluminum-processed products. The Machinery segment manufactures and sells various plants, energy, chemical and nuclear power-related equipment. The Resources and Engineering segment conducts engineering works and provides new transportation systems. The Kobelco Eco-Solutions provides water treatment plants, chemical and food-related equipment. The Kobelco Construction Machinery segment offers hydraulic excavators and mini excavators. The Kobelco Crane segment provides crawler cranes and rough terrain cranes. The Others segment develops and leases real estate. For the three months ended 30 June 2011 , Kobe Steel, Ltd.'s revenues increased 3% to Y471.41B. The Company's net income decreased 51% to Y9.84B. Revenues reflect higher sales due to recovering market environment and increased demand from China market. Net income was offset by higher percentage of cost of sales, the absence of gains on sale of investment securities, as well as decreased allotted income from operations.
Industry
|
Industry |
Iron and Steel |
|
ANZSIC 2006: |
2121 - Iron and
Steel Casting |
|
NACE 2002: |
2752 - Casting
of steel |
|
NAICS 2002: |
331111 - Iron
and Steel Mills |
|
UK SIC 2003: |
2752 - Casting
of steel |
|
US SIC 1987: |
3325 - Steel
Foundries, Not Elsewhere Classified |
Key Executives
|
Name |
Title |
|
Hiroshi Sato |
President |
|
Yoriyuki Shibata |
Executive Officer, Director of Steel Board Sales |
|
Takashi Matsutani |
Vice President, Manager of Resources and Engineering Business
Division, Representative Director |
|
Koji Fujii |
Executive Officer, Senior Director of Technology |
|
Toru Asaoka |
Co-Auditor |
Significant Developments
|
Topic |
#* |
Most Recent Headline |
Date |
|
Divestitures / Spin-offs |
4 |
Temp Hldg Co Ltd's Subsidiary to Acquire Kobe Steel, Ltd.'s Subsidiary |
8-Aug-2011 |
|
Restructuring / Reorganization |
2 |
Kobe Steel, Ltd. to Merge Subsidiary |
3-Feb-2011 |
|
Strategic Combinations |
6 |
Kobe Steel, Ltd. Considers Automotive Steel Joint Venture In China-DJ |
27-Sep-2011 |
|
New Business / Unit / Subsidiary |
2 |
Kobe Steel, Ltd. To Build Second Low Cost Mill In U.S.-DJ |
30-Aug-2011 |
|
Other Pre-Announcement |
2 |
Kobe Steel, Ltd. Amends Consolidated Mid-year and Full-year Guidance
for FY 2012; Amends Mid-year Dividend Forecast for FY 2012 |
28-Jul-2011 |
* number of significant developments within the last 12 months
news
|
Title |
Date |
|
JAPAN'S
KOBE STEEL WEIGHS MAKING COMPRESSORS IN BRAZIL, EUROPE |
18-Oct-2011 |
|
Tokyo
Closing Stock Prices(1) |
18-Oct-2011 |
|
Tokyo Stock
Exchange: closing price list -4- |
18-Oct-2011 |
|
Tokyo Stock
Exchange: morning price list -4- |
17-Oct-2011 |
|
Kyodo
Industry Brief (Oct. 18) -1- |
|
Financial summary
|
As of
30-Jun-2011 |
||||||||||||||||||||||||
|
Stock snapshot
|
1 - Profit &
Loss Item Exchange Rate: USD 1 = JPY 85.69144
2 - Balance Sheet Item Exchange Rate:
USD 1 = JPY 82.88
|
|
||||||||||||||||||||||||||||||||||||||||||||||||||||||||||||||||||||||||||||||||||||||||||||||||||||||||||||||||||||||||||||||||||||||||||||||||||||||||||||||||||||||||||||||||||||||||||||||||||||||||||||||||||||||||||||||||||||||||||||||||||||||||||||||||||||||||||||||||||||||||||||||||||||||||||||||||||||||||||||||||||||||||||||||||||||||||||||||||||||||||||||||||||||||||||||||||||||||||||||||||||||||||||||||||||||||||||||||||||||||||||||||||||||||||||||||||||||||||||||||||||||||||||||||||||||||||||||||||||||||||||||
|
|
|
|
Recently, the material research laboratory (MRL) of the company
developed a new technique to join dissimilar metals following the process
commonly used for vehicle assembly. This new innovation by the company
achieved bonding strengths between two dissimilar metals. The company's
mechanical engineering research laboratory (MERL) developed a compact
hydrogen production and storage process in collaboration
with the University of Tsukuba. Moreover, production systems research
laboratory (PSRL) of the company, Kobelco Cranes Co., Ltd. |
|
|
In May 2010, Nippon Steel Corporation and Kobe, formed a joint venture
to construct a plant to recycle steel mill dust (a byproduct from the
steelmaking process) into direct reduced iron. This new joint venture helps
the company in insulating the business from uncertain environment of unstable
raw material prices and availability. Besides, the company and India's Steel
Authority of India Limited (SAIL), signed a memorandum of understanding for
comprehensive strategic collaboration
covering technologies, projects and other areas. This cooperative
relationship covering a wide range of fields, from upstream to downstream
processes, enables to mutually explore collaborative efforts and ventures in
the Indian and global market. In addition, recently Hitachi Metals, Ltd. |
|
|
In 2010, Kobe Steel, Ltd. announces that it has completed the
construction of a 10,000-metric-ton forging press line at its Takasago Works
in Hyogo Prefecture in western Japan. The company also signed a memorandum of
understanding (MOU) with Steel Authority of India Limited (SAIL), for
comprehensive strategic collaboration
covering technologies, projects and other areas. The company also entered
into agreement with United States Steel Corporation for their equal
partnership joint venture, PRO-TEC Coating Company, to build a continuous
annealing line to produce high-strength steel for use in automobiles. Kobe
Steel’s wholly owned subsidiary Midrex Technologies Inc. terminated their
alliance agreement with ZincOx Resources plc, pursuant to which the parties were
to collaborate on the process, equipment design and engineering for electric
arc furnace dust (EAFD) recycling plans using the FASTMET and FASTMELT
Process jointly owned by Kobe Steel and Midrex. |
|
|
|
|
|
The company operates under the trade name KOBELCO. Kobe Steel, Japan’s
fourth-largest steel maker has 10% market share of the world market, and it
aims to increase to 20% in fiscal 2012. It also plans to increase its market share of
large-capacity screw and reciprocating compressors. Kobe Steel’s new
large-capacity compressor test facility went into operation in February 2010
at the company’s Takasago Works. The facility, the biggest in Japan, is able
to test process gas compressors with variable-speed motors rated up to 20,000
kilowatts. |
|
|
Recently, the company restructured its business segments into Iron and
Steel, Welding, Aluminum and Copper, Machinery, Natural Resources and
Engineering, Kobelco Eco-Solutions, Kobelco Construction Machinery, Kobelco
Cranes, and Other businesses. In Iron and Steel segment, the company is
focused on manufacturing sophisticated and higher value-added steel products.
The company plans to expand sales of its
products, such as wire rod for engine valve springs and high strength steel
sheet for automobiles. This segments product portfolio includes steel
products, steel castings and forgings, titanium products, steel powder,
steel-frame houses and power. It has two power plants at the Shinko Kobe
Power Station with a combined maximum power generation capacity of 1.4 GW. |
|
|
|
Helpful |
Harmful |
|
Internal Origin |
Strengths |
Weaknesses |
|
External Origin |
Opportunities ·
Accelerating
Demand for Energy |
Threats |
Overview
Kobe Steel, Ltd. (Kobe) is engaged in both the manufacturing and
services sectors. The products manufactured by Kobe include steel products,
hydraulic excavators, mini excavators, wheel loaders, crawler cranes, rough
terrain cranes, work vessels, electric mining shovels and other products. Kobe
has diversified business operations, which mitigate the business risk of the
company. Its focus on research and development and leading position in the
market provides competitive advantage. However, the company’s heavy dependence
on the Japanese region and its decreasing cash position remains major concerns
for the company. In addition, volatile raw material prices, stringent
government regulations and changes in steel supply and demand may impact its
performance. Nevertheless, the company could capitalize on its strategic
expansion of operation, joint ventures and collaborations and accelerating
demand for energy which offer new avenues of growth for the company.
Strengths
Leading Position
Kobe Steel’s leading position provides competitive edge over its peers.
The company operates under the trade name KOBELCO. Kobe Steel, Japan’s
fourth-largest steel maker has 10% market share of the world market, and it
aims to increase to 20% in fiscal 2012. It also plans to increase its market
share of large-capacity screw and reciprocating compressors. Kobe Steel’s new
large-capacity compressor test facility went into operation in February 2010 at
the company’s Takasago Works. The facility, the biggest in Japan, is able to
test process gas compressors with variable-speed motors rated up to 20,000
kilowatts. Currently, Kobe Steel has the largest market share of leadframes in
Asia, where demand is expected to grow, as well as in Japan. Kobe Steel has the
biggest world's market share in the field of polymer processing equipment and
is the maker of the largest capacity extruder in the world. Kobelco is Japan's
top manufacturer of crawler cranes, with a roughly 50% share of the domestic
market. In the world, Kobelco is a leading manufacturer with an estimated 17%
share.
Focus on
Research and Development
The company’s laboratories works closely with the development
departments in the business segments and help to create products, using
technologies in the fields of materials, machinery, the environment, energy and
electronics that effectively meet the customers’ needs. The company
laboratories include material research laboratory, mechanical engineering
research laboratory, production systems research laboratory, electronics
research laboratory, and coal and energy technology department. Recently, the
material research laboratory (MRL) of the company developed a new technique to
join dissimilar metals following the process commonly used for vehicle assembly.
This new innovation by the company achieved bonding strengths between two
dissimilar metals. The company's mechanical engineering research laboratory
(MERL) developed a compact hydrogen production and storage process in
collaboration with the University of Tsukuba. Moreover, production systems
research laboratory (PSRL) of the company, Kobelco Cranes Co., Ltd. and the
welding systems department of the company's Welding Business developed an
automatic welding system for crane boom. The company’s newly developed pipeline
products provide enough opportunities for the company to improve its market
share.
Diversified Business Operations
Kobe’s diversified business portfolio is instrumental in creating brand
value and goodwill for the company. Up to and including fiscal 2009-2010, Kobe
operated seven segments, namely, Iron and Steel, Wholesale Power Supply,
Aluminum and Copper, Machinery, Construction Machinery, Real Estate and
Electronic Materials and Other Businesses. From fiscal 2010-11, the company divided
its Iron and Steel segment into Iron and Steel segment and Welding segment; and
its Construction Machinery segment into Kobelco Construction Machinery segment
and Kobelco Cranes segment. This changed the total number of business segments
of the company from seven to nine. Thus, the company’s restructured business
segments include Iron and Steel, Welding, Aluminum and Copper, Machinery,
Natural Resources and Engineering, Kobelco Eco-Solutions, Kobelco Construction
Machinery, Kobelco Cranes, and Other businesses. Its Iron and Steel segment
focuses on manufacturing sophisticated and higher value-added steel products.
The company’s Welding business segment involves in providing welding solutions.
Its Aluminum and Copper segment includes copper rolled products, copper strip
for electronic materials, aluminum blanks and substrates for hard disk drives,
and aluminum castings and forgings. Under the Machinery segment, the company
offers rotating machinery and compressors, tire and rubber machinery, plastic
processing machinery, advanced technology equipment, ultra high pressure
equipment, air separation plants, rolling mills, LNG vaporizers, pressure
vessels. The company’s Natural Resources and Engineering segment focuses on
providing engineering products and services in the energy, oil, refining, and
chemical sectors. Kobelco Eco-Solutions engages in the development of advanced
technology to environment-related fields such as waste water treatment, waste
disposal and recycling. Its Kobelco Construction Machinery segment manufactures
hydraulic excavators, mini excavators, recycling machines, and wheel loaders
and Kobelco Cranes segment involves in offering cranes. During nine months
ended December 2010, its Iron and Steel segment contributed 43.96% of total
revenue, followed by Kobelco Construction (17.73%), Aluminum and Copper
(16.77%), Machinery segment (7.42%), Welding segment (5%), Kobelco
Eco-Solutions (3.22%), Other Businesses (2.6%), Natural Resources and
Engineering (2.09%), and Kobelco Cranes (1.9%). Diversified operations of the
company give it a wide customer base and mitigate the business risk of the
company.
Weaknesses
Over Dependence on Japanese Market
Kobe's operations are highly dependent on Japan which could have a
negative effect on its operations. Even though the company’s operations are
spread across the globe, it generates a majority of its revenues from the
Japanese market. It has three geographical segments, namely, Japan, Asia and
Other areas. During the fiscal year ended March 2010, the company earned 86.4%
of its revenue from Japanese market followed by Asia (10.5%) and Others areas
(3.1%). Geographic concentration makes Kobe vulnerable to potential risks on
the Japanese economy, the company's major market.
Kobe Steel recorded a significant decrease in its cash and short term
investments. The company’s cash and short term investments as of March 2010
were JPY131,939m, a decrease of 29.9% over 2009. Also, it recorded net change
in cash of JPY23,559m in fiscal 2010, compared to a net change in cash of
JPY121,060m in 2009. The decreasing cash position limits the company’s ability
to get additional debt to finance acquisitions, business opportunities, capital
expenditures or other capital requirements in the future. The company's current
ratio was 1.2 at the end of fiscal year 2010. This was below the Construction
Equipment sector average* of 1.92. A lower than sector average* current ratio
indicates that the company is in a weaker financial position than other
companies in the sector.
Opportunities
Accelerating Demand for Energy
The accelerating global demand for energy, creating large requirements
for power generation and supply services is expected to provide new
opportunities for the wholesale energy supply division. According to
International Energy Agency (IEA), global energy requirements will increase
about 50% by 2030. Energy needs in the Middle East, Africa, and Central and
South America should rise by 60%, while doubling in China and India. To fulfill
the rising need for power, China is investing $65 billion to expand its
existing power infrastructure and India will spend about $13 billion on nuclear
power in the next 10 years. Kobe could use its experience to expand its energy
supply operations in Asian nations like China and India.
Strategic Expansion of Operations
The company focused on strategic capital investment avenues to expand
its operations and capture market share in untapped areas. In July 2010, Kobe
announced its investment towards constructing a crawler cranes plant in India.
In February 2010, the company established its subsidiary, Kobe Welding of
Shanghai Co., Ltd. (KWSH) in Shanghai, China for marketing of welding systems
and parts in Chinese market. This new plant commenced its business operations
during April 2010. Its subsidiary, Kobe Welding of Qingdao Co., Ltd. (KWQ)
initiated its sales operation in Chinese market during March 2010. Moreover, in
June 2009, the company established its subsidiary Kobelco Machinery India
Private Limited in Kolkata, West Bengal, India for marketing its steel
production. Kobe Steel’s new large-capacity compressor test facility has begun
operations at the company's Takasago Works in Hyogo Prefecture in western
Japan.The company’s wholly owned subsidiary Kobelco Cranes Co., Ltd. planned to
manufacture crawler cranes in China. Kobelco aims to produce 80 crawler cranes
a year to meet around 7% of the total demand in China.Kobe Steel completed the
construction of a 10,000-metric-ton forging press line at its Takasago Works in
Hyogo Prefecture in western Japan. It invested about JPY22 billion to enlarge
the Forging Section's South Plant to house an entire production line.
Additionally, the company and United States Steel Corporation reached agreement
for their equal partnership joint venture, PRO-TEC Coating Company, to build a
continuous annealing line to produce high-strength steel for use in
automobiles. Kobe Steel also formed a joint venture with India's Larsen &
Toubro Limited to manufacture and sell rubber processing machinery. These
expansion efforts of the company will strengthen its presence in emerging
economies of China and India and offer new growth opportunities for the
company.
Joint Ventures and Collaborations
Kobe entered into a number of joint ventures and merger activities to
strengthen its product offerings and market reach. In May 2010, Kobe, Mitsui
& Co., Ltd. and Toyota Tsusho Corporation entered into a joint venture
agreement to manufacture and market aluminum forgings for automotive
suspensions. This new joint venture named as Kobe Aluminum Automotive Products
(China) Co. was established to meet the growing orders from automakers in
China. In May 2010, Nippon Steel Corporation and Kobe, formed a joint venture
to construct a plant to recycle steel mill dust (a byproduct from the
steelmaking process) into direct reduced iron. This new joint venture helps the
company in insulating the business from uncertain environment of unstable raw
material prices and availability. Besides, the company and India's Steel
Authority of India Limited (SAIL), signed a memorandum of understanding for
comprehensive strategic collaboration covering technologies, projects and other
areas. This cooperative relationship covering a wide range of fields, from
upstream to downstream processes, enables to mutually explore collaborative
efforts and ventures in the Indian and global market. In addition, recently
Hitachi Metals, Ltd., Kobe Steel, Ltd., IHI Corporation, and Kawasaki Heavy
Industries, Ltd. jointly established a joint venture called Japan Aeroforge,
Ltd. to manufacture large forgings for use in aircraft and power plants. Japan
Aeroforge installs Japan's first 50,000 metric ton forging press to manufacture
large forgings for the aircraft industry, which is growing worldwide. Such
joint ventures and collaborations enables the company to cater to the growing
needs of its customers.
Threats
Stringent Regulations
The company’s design and manufacturing processes are subject to industry
and governmental agency standards that may apply to its entire line of
products, including all domestic and foreign environmental, structural,
electrical and safety codes. Any changes by state and local regulatory
authorities in environmental regulations could require major changes in the
manufacturing process or product features. This would involve huge investments
for the implementation of the changes, leading to an increase in the cost
overheads. Non compliance withsuch changing regulations could lead to heavy
penalties and fines, thereby putting additional financial burden on the
company.
Changes in Steel Supply and Demand
The changes in supply or demand in the global steel market may affect
the performance of the company. It also faces intense competition from other
steelmakers in Japan and other countries. As a result, any decline in the
competitiveness of its technologies, cost structure, product quality and other
aspects of performance relative to competitors could have an impact on the
company's operating results. Also, most of the company's customers in the
Steelmaking and Steel Fabrication segment regularly purchase large quantities
of steel. Any change in purchasing policies of its major customers could
negatively impact the company's operating results.
Volatile Raw Material Prices
The volatile raw material prices could have a material impact on the
operational costs of the company. The primary raw materials used in the steel
production include Iron Ore and coking coal. During the period January–October
2008, the price of iron ore was 72% higher as compared to the same period in
2007. Similarly, the coking coal prices also increased by 81% during the same
periods. The higher raw material costs increases the production costs for
companies, which forces them to either raise the prices of its products by
placing the burden on the consumer, or to take the burden themselves by
absorbing the higher costs and decreasing profit margins. Further, the
production plants and its machines are powered by oil and natural gas, whose
price is also volatile in nature. Thus, the price fluctuations may have a
material impact on the product cost and further the operations of the company.
|
Corporate Family
|
Corporate
Structure News: |
|
Total Corporate Family Members: 33 (Available via export) |
|
|
Company Name |
Company Type |
Location |
Country |
Industry |
Sales |
Employees |
|
Parent |
Kobe-shi |
Japan |
Iron and Steel |
21,689.1 |
34,772 |
|
|
Subsidiary |
Kobe |
Japan |
Waste Management Services |
812.3 |
1,510 |
|
|
Subsidiary |
Chiyoda-ku |
Japan |
Iron and Steel |
464.7 |
1,088 |
|
|
Subsidiary |
Tokyo |
Japan |
Construction and Agriculture Machinery |
2,957.8 |
750 |
|
|
Subsidiary |
Calhoun, GA |
United States |
Miscellaneous Capital Goods |
270.0 |
210 |
|
|
Branch |
Carol Stream, IL |
United States |
Construction and Agriculture Machinery |
57.1 |
70 |
|
|
Subsidiary |
Singapore |
Singapore |
Construction and Agriculture Machinery |
314.1 |
124 |
|
|
Subsidiary |
Bayan Lepas, Penang |
Malaysia |
Audio and Video Equipment |
114.8 |
750 |
|
|
Subsidiary |
Praeksa, Samut Prakan |
Thailand |
Miscellaneous Capital Goods |
8.0 |
200 |
|
|
Joint Venture |
Praeksa Muang, Samut Prakan |
Thailand |
Electronic Instruments and Controls |
2.0 |
200 |
|
|
Subsidiary |
Samutprakan |
Thailand |
Miscellaneous Fabricated Products |
1.0 |
200 |
|
|
Subsidiary |
Singapore |
Singapore |
Miscellaneous Fabricated Products |
86.7 |
190 |
|
|
Subsidiary |
Charlotte, NC |
United States |
Engineering Consultants |
|
180 |
|
|
Subsidiary |
Kyongsangnam-Do |
Korea, Republic of |
Miscellaneous Fabricated Products |
96.0 |
145 |
|
|
Subsidiary |
Shinagawa-ku, Tokyo |
Japan |
Engineering Consultants |
|
104 |
|
|
Branch |
Chaoyang District, Beijing |
China |
Iron and Steel |
56.0 |
100 |
|
|
Subsidiary |
Hudson, OH |
United States |
Miscellaneous Capital Goods |
30.8 |
85 |
|
|
Subsidiary |
Sakai-Shi, Osaka |
Japan |
Miscellaneous Fabricated Products |
|
60 |
|
|
Subsidiary |
Singapore |
Singapore |
Electronic Instruments and Controls |
66.0 |
45 |
|
|
Subsidiary |
New York, NY |
United States |
Miscellaneous Fabricated Products |
|
8 |
|
|
Subsidiary |
Leipsic, OH |
United States |
Iron and Steel |
50.0 |
125 |
|
|
Subsidiary |
Elkhart, IN |
United States |
Miscellaneous Capital Goods |
|
38 |
|
|
Subsidiary |
Stafford, TX |
United States |
Miscellaneous Capital Goods |
|
18 |
|
|
Subsidiary |
New York, NY |
United States |
Consumer Financial Services |
|
|
|
|
Subsidiary |
New York, NY |
United States |
Real Estate Operations |
|
|
|
|
Subsidiary |
Singapore |
Singapore |
Business Services |
66.0 |
4 |
|
|
Subsidiary |
Ohgaki |
Japan |
Miscellaneous Capital Goods |
149.0 |
|
|
|
Subsidiary |
Hunan |
China |
Miscellaneous Capital Goods |
1.0 |
|
|
|
Subsidiary |
Nongjok, Bangkok |
Thailand |
Construction Services |
|
|
|
|
Subsidiary |
Heerlen |
Netherlands |
Construction - Supplies and Fixtures |
|
|
Competitors
Report
|
CompanyName |
Location |
Employees |
Ownership |
|
AK Steel Holding Corporation |
West Chester, Ohio, United States |
6,600 |
Public |
|
ArcelorMittal |
Luxembourg, Luxembourg |
265,000 |
Public |
|
JFE Holdings, Inc. |
Chiyoda-ku, Japan |
54,400 |
Public |
|
Nippon Steel Corporation |
Chiyoda-ku, Japan |
59,183 |
Public |
|
POSCO |
Pohang-Si, Kyongsangbuk-Do, Korea,
Republic of |
17,435 |
Public |
|
Sumitomo Metal Mining Co., Ltd. |
Minato-ku, Japan |
9,189 |
Public |
|
ThyssenKrupp AG |
Essen, Germany |
182,425 |
Public |
|
United States Steel Corporation |
Pittsburgh, Pennsylvania, United States |
42,000 |
Public |
Executive report
|
Board of
Directors |
|
|
|
|
|||||
|
Director |
Director/Board Member |
|
|||||
|
Vice President, Representative Director |
Director/Board Member |
|
|||||
|
||||||||
|
Senior Managing Director, Manager of
Welding Business Division, President of Subsidiary |
Director/Board Member |
|
|
||||
|
||||||||
|
Vice President, President of Subsidiary,
Representative Director |
Director/Board Member |
|
|
||||
|
||||||||
|
Non-Executive Independent Director |
Director/Board Member |
|
|
||||
|
||||||||
|
Vice President, Manager of Resources and
Engineering Business Division, Representative Director |
Director/Board Member |
|
|
||||
|
||||||||
|
Director |
Director/Board Member |
|
|
||||
|
Senior Managing Director, Chief Director
of Technology Development |
Director/Board Member |
|
|
||||
|
||||||||
|
Vice President, Manager of Machinery
Business Division, Representative Director |
Director/Board Member |
|
|
||||
|
||||||||
|
Senior Managing Director, Manager of
Aluminum and Copper Business Division |
Director/Board Member |
|
|
||||
|
||||||||
|
Vice President, Manager of Iron and Steel
Business Division, Representative Director |
Director/Board Member |
|
|
||||
|
||||||||
|
Independent Director |
Director/Board Member |
|
|
||||
|
||||||||
|
Executives |
|
|
|
|
|||||
|
President |
President |
|
|||||
|
||||||||
|
Executive Officer-Steel Wire |
Division Head Executive |
|
|
||||
|
Vice President, Manager of Resources and
Engineering Business Division, Representative Director |
Division Head Executive |
|
|
||||
|
||||||||
|
Managing Executive Officer-Compressor |
Division Head Executive |
|
|
||||
|
Vice President, Manager of Machinery
Business Division, Representative Director |
Division Head Executive |
|
|
||||
|
||||||||
|
Vice President, Manager of Iron and Steel
Business Division, Representative Director |
Division Head Executive |
|
|
||||
|
||||||||
|
Senior Managing Director, Manager of
Welding Business Division, President of Subsidiary |
Managing Director |
|
|
||||
|
||||||||
|
Managing Executive Officer |
Managing Director |
|
|
||||
|
||||||||
|
Managing Executive Officer-Development |
Managing Director |
|
|
||||
|
Senior Managing Executive
Officer-Administration & Purchasing |
Managing Director |
|
|
||||
|
Managing Exec Officer |
Managing Director |
|
|
||||
|
||||||||
|
Senior Managing Director, Chief Director
of Technology Development |
Managing Director |
|
|
||||
|
||||||||
|
Senior Managing Director, Manager of
Aluminum and Copper Business Division |
Managing Director |
|
|
||||
|
||||||||
|
Officer |
Administration Executive |
|
|
||||
|
Senior Officer |
Administration Executive |
|
|
||||
|
Executive Officer-Secretariat &
Publicity |
Company Secretary |
|
|
||||
|
Co-Auditor |
Finance Executive |
|
|
||||
|
Co-Auditor |
Finance Executive |
|
|
||||
|
Co-Auditor |
Finance Executive |
|
|
||||
|
Co-Auditor |
Finance Executive |
|
|
||||
|
Co-Auditor |
Finance Executive |
|
|
||||
|
Corporate Auditor |
Accounting Executive |
|
|
||||
|
Executive Officer, Director of Steel Board
Sales |
Sales Executive |
|
|
||||
|
Executive Officer, Senior Director of
Technology |
Other |
|
|
||||
|
||||||||
|
Executive Officer |
Other |
|
|
||||
|
Managing Executive Officer, President of
Osaka Office |
Other |
|
|
||||
|
||||||||
|
Executive Officer |
Other |
|
|
||||
|
||||||||
|
Managing Executive Officer |
Other |
|
|
||||
|
||||||||
|
Executive Officer, Manager of Kobe Steel
Manufacturing Plant |
Other |
|
|
||||
|
||||||||
|
Executive Vice President and
Representative Director |
Other |
|
|
||||
|
Executive Vice President and
Representative Director |
Other |
|
|
||||
|
Managing Executive Officer, Chief Director
of New Iron Source, Chief Director of Coal Energy |
Other |
|
|
||||
|
||||||||
|
Executive Officer |
Other |
|
|
||||
|
||||||||
|
Managing Executive Officer |
Other |
|
|
||||
|
||||||||
|
Executive Officer |
Other |
|
|
||||
|
Executive Officer |
Other |
|
|
||||
|
Senior Officer |
Other |
|
|
||||
|
Managing Executive Officer, Assistant
Manager of Machinery Business Division, Director of Industrial Machinery
Business |
Other |
|
|
||||
|
||||||||
|
Executive Officer, Dir of Compressor Biz
in Machinery Business Division, Manager of Development Center in Machinery
Business Division |
Other |
|
|
||||
|
||||||||
|
Senior Officer |
Other |
|
|
||||
|
Managing Executive Officer, Manager of
Kakogawa Steel Manufacturing Plant |
Other |
|
|
||||
|
||||||||
|
Executive Officer, Manager of Moka
Manufacturing Plant in Aluminum and Copper Business Division, Director of
Facility in Moka Manufacturing Plant |
Other |
|
|
||||
|
||||||||
|
Senior Managing Executive Officer |
Other |
|
|
||||
|
||||||||
|
Executive Officer, Director of Development
Planning |
Other |
|
|
||||
|
Senior Officer |
Other |
|
|
||||
|
Managing Executive Officer, Assistant
Manager of Weldig Business Division |
Other |
|
|
||||
|
||||||||
|
Senior Managing Executive Officer,
Assistant Manager of Resources and Engineering Business Division |
Other |
|
|
||||
|
||||||||
|
Managing Executive Officer, Director of
Casting & Forging Steel Business |
Other |
|
|
||||
|
||||||||
|
Managing Executive Officer |
Other |
|
|
||||
|
||||||||
|
Executive Officer Director of Business
Planning |
Other |
|
|
||||
Significant developments
|
Press clippings
Kabushiki Kaisha Kobe Seiko Sho (Kobe Steel Ltd) Receives Patent for a
Mixing Rotor for a Batch Mixer and a Batch Mixer
Indian Patent News
29 September 2011
What follows is the full text of the article.]
New Delhi, Sept. 29 -- Kabushiki Kaisha Kobe Seiko Sho (Kobe Steel Ltd) received patent for a mixing rotor for a batch mixer and a batch mixer on April 25, 2008. The patent number issued by the Indian Patent Office is 216634.
Kabushiki Kaisha Kobe Seiko Sho (Kobe Steel Ltd) had filed patent application number 336/MAS/2001 for a mixing rotor for a batch mixer and a batch mixer on April 24, 2001. The inventors of the patent are Akio Koro, Yajun Zhang, Takuzo Iwata, Toru Nishikawa, Kimio Inoue, Norifumi Yamada and Ko Takakura.
The International classification number is B29B7/18.
According to the Controller General of Patents, Designs & Trade Marks, "Each mixing rotor for a batch mixer is rotatably insertable into a mixing chamber such that tip clearances are defined between tips of mixing blades and an inner surface of a mixing chamber and is provided on its outer circumferential surface with a plurality of mixing blades for imparting shearing forces to a material to be mixed by causing the material to pass through the tip clearances. The plurality of mixing blades include a nonlinear blade which is substantially nonlinear from a start point to a terminal point in a development of the mixing rotor developed into a plane about its longitudinal axis, and other linear blades which are linear in the development and whose helix angle to the longitudinal axis of the mixing rotor is set at 15 to 35. An appropriate mixing control capable of realizing both sufficient mixing and sufficient dispersion can be executed by mixing and dispersing the material in a well-balanced manner by means of the mixing rotor."
About the Company
Kobe Steel, Ltd. (Kabushiki-gaisha Kobe Seiko-sho, TYO: 5406), operating worldwide under the brand Kobelco, is a major Japanese steel manufacturer headquartered in Kobe. Kobe Steel also has a stake in Osaka Titanium Technologies. It was formed in 1905. Its location in a major city port was useful for importing and exporting iron ore and coal.
CHINA: Kobe Steel and Anshan Steel to establish JV to make automotive steel sheet
just-auto.com
28 September 2011
[What follows is the full text of the article.]
Kobe Steel announced that it had signed a nonbinding letter of intent with China's Anshan Iron and Steel Group Corporation to begin a joint study to explore the possibility of establishing a joint venture (JV) in China to make cold-rolled advanced high strength steel sheet used in automobiles.
From now, the two companies will hold discussions on the manufacturing equipment, production capacity, location, the role of each company in the project, and other aspects.
Kobe Steel plans to consider the use of a continuous annealing line to make cold-rolled advanced high strength steel sheet. Cold-rolled high strength steel generally has a tensile strength of 340 MPa or more. Advanced high strength steel, noted for its outstanding formability, has a tensile strength of 590 MPa or higher. A continuous annealing line is primarily used to make advanced high strength steel sheet.
To meet growing demand for high-end steel from China's car industry, Kobe Steel decided to consider setting up a production base in that country to supply automotive cold-rolled steel sheet.
The JV will enable Kobe Steel to supply its high strength steel sheet locally to meet the growing demand for lighter vehicles in China.
This article was originally published by just-auto.com on 28 September 2011. For authoritative and timely auto business information visit http://www.just-auto.com.
Kabushiki Kaisha Kobe
Seiko Sho (Kobe Steel Ltd) Files Patent Application for Method for Producing Briquette,
Method for Producing Reduced Metal and Method for Separating Zinc or Lead
Indian Patent News
25 September 2011
[What follows is
the full text of the article.]
New Delhi, Sept. 25 -- Japan based Kabushiki Kaisha Kobe Seiko Sho (Kobe Steel Ltd) filed patent application for method for producing briquette, method for producing reduced metal, and method for separating zinc or lead. The inventors are Tetsumoto Masahiko, Miyakawa Yutaka and Mizutani Noriaki.
Kabushiki Kaisha Kobe Seiko Sho (Kobe Steel Ltd) filed the patent application on Jan. 7, 2011. The patent application number is 125/CHENP/2011 A. The international classification number is C22B1/243.
According to the Controller General of Patents, Designs & Trade Marks, "An object of the present invention is to produce briquettes that have high strength even when the amounts of binder and water used are decreased as much as possible. A method for producing briquettes that achieve this object includes a step of forming primary granules by using a powder containing a metal oxide and at least one of zinc oxide, lead oxide, and titanium oxide and a step of compressing the primary granules still containing the at least one of zinc oxide, lead oxide, and titanium oxide so as to mold the primary granules into secondary granules."
About the Company
Kobe Steel, Ltd. (Kabushiki-gaisha Kobe Seiko-sho, TYO: 5406), operating worldwide under the brand Kobelco, is a major Japanese steel manufacturer headquartered in Kobe. Kobe Steel also has a stake in Osaka Titanium Technologies. It was formed in 1905. Its location in a major city port was useful for importing and exporting iron ore and coal.
|
|
|
|
Kabushiki Kaisha Kobe
Seiko-Sho (Kobe Steel Ltd) Receives Patent for Method and Apparatus for
Supplying Granular Raw Material for Reduced Iron
Indian Patent News
21 September 2011
[What follows is the full text of the article.]
New Delhi, Sept. 21 -- Kabushiki Kaisha Kobe Seiko-Sho (Kobe Steel Ltd) received patent for method and apparatus for supplying granular raw material for reduced iron on March 31, 2008. The patent number issued by the Indian Patent Office is 214477.
Kabushiki Kaisha Kobe Seiko-Sho (Kobe Steel Ltd) had filed patent application number 682/MAS/2000 for method and apparatus for supplying granular raw material for reduced iron on Aug. 24, 2000. The inventor of the patent is Takao Harada.
The International
classification number is C21B7/18.
According to the Controller General of Patents, Designs & Trade Marks, "A method for supplying a granular raw material for reduced iron, comprising the steps of feeding a granular raw material for reduced iron into a material receiving hopper, supplying the material from the material receiving hopper through a material supply means onto a hearth of a movable hearth furnace, and vertically moving the material supply means so as to adjust the gap between a lower end of the material supply means and the hearth to thereby adjust the supply amount of the material."
About the Company
Kobe Steel, Ltd. (Kabushiki-gaisha Kobe Seiko-sho, TYO: 5406), operating worldwide under the brand Kobelco, is a major Japanese steel manufacturer headquartered in Kobe. Kobe Steel also has a stake in Osaka Titanium Technologies. It was formed in 1905. Its location in a major city port was useful for importing and exporting iron ore and coal.
Kabushiki Kaisha Kobe Seiko Sho (Kobe Steel Ltd) Receives Patent for a Method for Producing Gaseous Oxygen from Air
Indian Patent News
21 September 2011
[What follows is the
full text of the article.]
New Delhi, Sept. 21 -- Kabushiki Kaisha Kobe Seiko Sho (Kobe Steel Ltd) received patent for a method for producing gaseous oxygen from air on March 31, 2008. The patent number issued by the Indian Patent Office is 214407.
Kabushiki Kaisha Kobe Seiko Sho (Kobe Steel Ltd) had filed patent application number 371/MAS/2000 for a method for producing gaseous oxygen from air on May 12, 2000. The inventors of the patent are Seiichi Yamamoto, Kazuhiko Asahara and Masayuki Tanaka.
The International classification number is F25J3/00.
According to the Controller General of Patents, Designs & Trade Marks, "Liquid oxygen, which is extracted from the bottom of a lower pressure rectifier and compressed by a liquid oxygen pump to a predetermined supply pressure, is evaporated in a main heat exchanger to prepare an oxygen gas product, while oxygen gas is circulated in the main heat exchanger at a linear velocity which is equal to or higher than the terminal velocity, calculated depending on the supply pressure, of an oxygen droplet having a diameter of 200 ~tm. This process effectively prevents precipitation of heavy impurities in the heat exchanger and produces higher pressure oxygen gas at reduced operational costs."
About the Company
Kobe Steel, Ltd. (Kabushiki-gaisha Kobe Seiko-sho, TYO: 5406), operating worldwide under the brand Kobelco, is a major Japanese steel manufacturer headquartered in Kobe. Kobe Steel also has a stake in Osaka Titanium Technologies. It was formed in 1905. Its location in a major city port was useful for importing and exporting iron ore and coal.
Kabushiki Kaisha Kobe
Seiko Sho (Kobe Steel, Ltd.) Files Patent Application for Screw Compression
Apparatus
Indian Patent News
25 August 2011
[What follows is the
full text of the article.]
New Delhi, Aug. 25 -- Japan based Kabushiki Kaisha Kobe Seiko Sho (Kobe Steel, Ltd.) filed patent application for screw compression apparatus. The inventors are Kakiuchi Tetsuya and Amano Yasushi.
Kabushiki Kaisha Kobe Seiko Sho (Kobe Steel, Ltd.) filed the patent application on Dec. 10, 2010. The patent application number is 8022/CHENP/2010 A. The international classifications are F04C29/02 and F04C18/16.
According to the Controller General of Patents, Designs & Trade Marks, "A screw compression apparatus in which the bearing lifespan is unaffected by the properties of the target gas being compressed comprises: a screw compressor in which a rotor shaft of a screw rotor that is rotatably housed to compress a target gas together with a rotor lubricating fluid in a male/female interlocking arrangement in a rotor chamber formed in a housing is held by bearings arranged in bearing spaces formed in a housing adjacently to a rotor chamber, and which includes shaft sealing members that isolate the bearing space from the rotor chamber a lubricating fluid separating collector that separates the rotor lubricating fluid from the target gas discharged by the screw compressor; a rotor lubricating flow channel through which the rotor lubricating fluid separated by the lubricating fluid separating collector is introduced into the rotor chamber and a bearing lubricating system for supplying a bearing lubricating fluid to the bearing space and cooling the bearing lubricating fluid flowing out from the bearing space and returning the fluid to the bearing space."
Kabushiki Kaisha Kobe
Seiko Sho (Kobe Steel Ltd) Files Patent Application for a Method for Producing
Gaseous Oxygen from Air
Indian Patent News
22 August 2011
[What follows is the
full text of the article.]
New Delhi, Aug. 22 -- Japan based Kabushiki Kaisha Kobe Seiko Sho (Kobe Steel Ltd) filed patent application for a method for producing gaseous oxygen from air. The inventors are Seiichi Yamamoto, Kazuhiko Asahara and Masayuki Tanaka.
Kabushiki Kaisha Kobe Seiko Sho (Kobe Steel Ltd) filed the patent application on May 12, 2000. The patent application number is 371/MAS/2000 A. The international classification number is F25J3/00.
According to the Controller General of Patents, Designs & Trade Marks, "Liquid oxygen, which is extracted from the bottom of a lower pressure rectifier and compressed by a liquid oxygen pump to a predetermined supply pressure, is evaporated in a main heat exchanger to prepare an oxygen gas product, while oxygen gas is circulated in the main heat exchanger at a linear velocity which is equal to or higher than the terminal velocity, calculated depending on the supply pressure, of an oxygen droplet having a diameter of 200 m. This process effectively prevents precipitation of heavy impurities in the heat exchanger and produces higher pressure oxygen gas at reduced operational costs."
About the Company
Kobe Steel, Ltd. operates in the materials, machinery, wholesale power supply, and real estate businesses in Japan and internationally. The company's Iron and Steel segment offers wire rods, steel bars, specialty steel bars, steel plates and sheets, steel castings and forgings, titanium and titanium alloys, steel powder, pig iron, slag products, stainless steel tubes, building materials, specialty steel products, steel wire, covered welding electrodes and wire, flux, welding power sources, and welding robot systems. Its Wholesale Power Supply segment engages in the supply of electric power. The company's Aluminum and Copper segment provides aluminum extrusions, disk blanks, aluminum foil, copper sheets and strips, lead frames, condenser pipes, copper tubes, aluminum alloys and magnesium alloy castings and forgings, and processed aluminum products. Its Machinery segment offers iron and steel-making plant engineering services, equipment for energy and chemical fields, and nuclear power plants.
MoU with Kobe Steel of Japan is intact: SAIL
India Public Sector
News
18 August 2011
[What follows is the
full text of the article.]
Mumbai: Maharatna firm Steel Authority of India (SAIL) said that its memoranda of understanding (MoUs) with Kobe Steel Ltd of Japan have not been scrapped and one of the two pacts is in the advanced stage of being finalized, the daily News & Analysis reported.
C S Verma, Chairman and Managing Director, SAIL said, "The detailed project report for using Kobe's patented technology for setting up a modular plant in India is ready and now we are working on finalizing a joint venture agreement with them."
C S Verma said that once the process is done, SAIL will start work based on the technology from Kobe for setting up a modular 0.5 million tonne per annum plant at Durgapur in West Bengal.
SAIL (BOM:500113) had signed two MoUs with the Japanese company in the last two years, though one of the two pacts has been not been implemented due to non-availability of gas. Under one of the MOU, the two companies had planned to revive the Jagdishpur steel unit in Uttar Pradesh, which the state-run firm SAIL had bought from the ailing Malvika Steel.
SAIL had plans to set up a 10,000 million tonne per annum cold forming line and a 13,000 tonne per annum corrugation line and a 475 megawatt power plant at the site. All of this would be gas-based.
Annual Income Statement
Financials in: USD (mil)
Except for share items (millions) and per share items (actual units)
|
|
31-Mar-2011 |
31-Mar-2010 |
31-Mar-2009 |
31-Mar-2008 |
31-Mar-2007 |
|
Period Length |
12 Months |
12 Months |
12 Months |
12 Months |
12 Months |
|
UpdateType/Date |
Updated Normal |
Updated Normal |
Updated Normal |
Updated Normal |
Updated Normal |
|
Filed Currency |
JPY |
JPY |
JPY |
JPY |
JPY |
|
Exchange Rate
(Period Average) |
85.691434 |
92.941082 |
100.484331 |
114.302336 |
116.944303 |
|
Auditor |
KPMG LLP |
KPMG LLP |
KPMG LLP |
KPMG LLP |
Azsa Audit Corp. |
|
Auditor Opinion |
Unqualified |
Unqualified |
Unqualified with
Explanation |
Unqualified |
Unqualified with
Explanation |
|
|
|
|
|
|
|
|
Net Sales |
21,689.1 |
17,979.4 |
21,667.9 |
18,655.8 |
16,335.1 |
|
Revenue |
21,689.1 |
17,979.4 |
21,667.9 |
18,655.8 |
16,335.1 |
|
Total Revenue |
21,689.1 |
17,979.4 |
21,667.9 |
18,655.8 |
16,335.1 |
|
|
|
|
|
|
|
|
Cost of Revenue |
18,330.6 |
15,875.2 |
18,812.1 |
15,374.5 |
13,195.7 |
|
Cost of Revenue, Total |
18,330.6 |
15,875.2 |
18,812.1 |
15,374.5 |
13,195.7 |
|
Gross Profit |
3,358.5 |
2,104.1 |
2,855.9 |
3,281.3 |
3,139.4 |
|
|
|
|
|
|
|
|
Selling/General/Administrative Expense |
1,318.4 |
1,072.1 |
1,125.6 |
1,006.5 |
900.6 |
|
Labor & Related Expense |
410.9 |
382.0 |
425.1 |
380.1 |
340.7 |
|
Total Selling/General/Administrative Expenses |
1,729.3 |
1,454.2 |
1,550.8 |
1,386.6 |
1,241.3 |
|
Research & Development |
124.4 |
112.3 |
106.5 |
95.7 |
87.6 |
|
Depreciation |
51.3 |
42.5 |
34.9 |
28.2 |
26.6 |
|
Depreciation/Amortization |
51.3 |
42.5 |
34.9 |
28.2 |
26.6 |
|
Impairment-Assets Held for Use |
0.0 |
38.5 |
157.7 |
0.0 |
40.8 |
|
Impairment-Assets Held for Sale |
- |
0.0 |
171.4 |
0.0 |
- |
|
Other Unusual Expense (Income) |
27.8 |
-79.8 |
0.0 |
0.0 |
26.7 |
|
Unusual Expense (Income) |
27.8 |
-41.3 |
329.1 |
0.0 |
67.6 |
|
Total Operating Expense |
20,263.4 |
17,442.9 |
20,833.4 |
16,885.1 |
14,618.7 |
|
|
|
|
|
|
|
|
Operating Income |
1,425.7 |
536.5 |
834.6 |
1,770.7 |
1,716.4 |
|
|
|
|
|
|
|
|
Interest Expense -
Non-Operating |
-241.4 |
-229.4 |
-199.1 |
-183.1 |
-176.1 |
|
Interest Expense, Net Non-Operating |
-241.4 |
-229.4 |
-199.1 |
-183.1 |
-176.1 |
|
Interest Income -
Non-Operating |
36.5 |
25.0 |
22.2 |
18.9 |
16.8 |
|
Investment Income -
Non-Operating |
88.9 |
40.9 |
115.0 |
156.4 |
147.3 |
|
Interest/Investment Income - Non-Operating |
125.4 |
65.9 |
137.2 |
175.3 |
164.0 |
|
Interest Income (Expense) - Net Non-Operating Total |
-116.0 |
-163.5 |
-61.8 |
-7.8 |
-12.1 |
|
Gain (Loss) on Sale of Assets |
- |
- |
0.0 |
-58.4 |
0.0 |
|
Other Non-Operating Income (Expense) |
-272.7 |
-221.2 |
-496.1 |
-362.7 |
-204.7 |
|
Other, Net |
-272.7 |
-221.2 |
-496.1 |
-362.7 |
-204.7 |
|
Income Before Tax |
1,037.1 |
151.7 |
276.7 |
1,341.8 |
1,499.7 |
|
|
|
|
|
|
|
|
Total Income Tax |
226.1 |
10.8 |
595.6 |
523.5 |
524.9 |
|
Income After Tax |
810.9 |
140.9 |
-319.0 |
818.3 |
974.7 |
|
|
|
|
|
|
|
|
Minority Interest |
-193.1 |
-73.0 |
6.1 |
-40.3 |
-36.9 |
|
Net Income Before Extraord Items |
617.8 |
67.9 |
-312.9 |
778.0 |
937.8 |
|
Net Income |
617.8 |
67.9 |
-312.9 |
778.0 |
937.8 |
|
|
|
|
|
|
|
|
Miscellaneous Earnings Adjustment |
0.0 |
0.0 |
- |
0.0 |
0.0 |
|
Total Adjustments to Net Income |
0.0 |
0.0 |
- |
0.0 |
0.0 |
|
Income Available to Common Excl Extraord Items |
617.8 |
67.8 |
-312.9 |
778.0 |
937.8 |
|
|
|
|
|
|
|
|
Income Available to Common Incl Extraord Items |
617.8 |
67.8 |
-312.9 |
778.0 |
937.8 |
|
|
|
|
|
|
|
|
Basic/Primary Weighted Average Shares |
3,002.1 |
3,002.5 |
3,002.5 |
3,001.4 |
3,100.7 |
|
Basic EPS Excl Extraord Items |
0.21 |
0.02 |
-0.10 |
0.26 |
0.30 |
|
Basic/Primary EPS Incl Extraord Items |
0.21 |
0.02 |
-0.10 |
0.26 |
0.30 |
|
Dilution Adjustment |
0.0 |
0.0 |
0.0 |
0.0 |
0.0 |
|
Diluted Net Income |
617.8 |
67.8 |
-312.9 |
778.0 |
937.8 |
|
Diluted Weighted Average Shares |
3,002.1 |
3,002.5 |
3,002.5 |
3,001.4 |
3,100.7 |
|
Diluted EPS Excl Extraord Items |
0.21 |
0.02 |
-0.10 |
0.26 |
0.30 |
|
Diluted EPS Incl Extraord Items |
0.21 |
0.02 |
-0.10 |
0.26 |
0.30 |
|
Dividends per Share - Common Stock Primary Issue |
0.04 |
0.02 |
0.03 |
0.06 |
0.06 |
|
Gross Dividends - Common Stock |
105.3 |
48.5 |
104.7 |
184.2 |
184.2 |
|
Interest Expense, Supplemental |
241.4 |
229.4 |
199.1 |
183.1 |
176.1 |
|
Depreciation, Supplemental |
1,339.9 |
1,278.6 |
1,280.8 |
975.6 |
741.3 |
|
Total Special Items |
27.8 |
-41.3 |
329.1 |
58.4 |
67.6 |
|
Normalized Income Before Tax |
1,064.9 |
110.4 |
605.8 |
1,400.2 |
1,567.2 |
|
|
|
|
|
|
|
|
Effect of Special Items on Income Taxes |
6.1 |
-2.9 |
115.2 |
22.8 |
23.7 |
|
Inc Tax Ex Impact of Sp Items |
232.2 |
7.9 |
710.8 |
546.3 |
548.6 |
|
Normalized Income After Tax |
832.7 |
102.5 |
-105.0 |
853.9 |
1,018.6 |
|
|
|
|
|
|
|
|
Normalized Inc. Avail to Com. |
639.5 |
29.4 |
-98.9 |
813.6 |
981.7 |
|
|
|
|
|
|
|
|
Basic Normalized EPS |
0.21 |
0.01 |
-0.03 |
0.27 |
0.32 |
|
Diluted Normalized EPS |
0.21 |
0.01 |
-0.03 |
0.27 |
0.32 |
|
Research & Development Exp, Supplemental |
472.5 |
416.3 |
415.2 |
359.4 |
87.6 |
|
Reported Operating Profit |
1,453.5 |
495.1 |
1,163.7 |
1,770.7 |
1,784.0 |
|
Reported Ordinary Profit |
1,039.6 |
110.4 |
605.8 |
1,381.6 |
1,567.2 |
|
Normalized EBIT |
1,453.5 |
495.1 |
1,163.7 |
1,770.7 |
1,784.0 |
|
Normalized EBITDA |
2,793.4 |
1,773.7 |
2,444.5 |
2,746.3 |
2,525.2 |
|
Interest Cost - Domestic |
39.2 |
38.6 |
38.7 |
34.1 |
34.8 |
|
Service Cost - Domestic |
74.5 |
70.6 |
72.3 |
66.1 |
59.3 |
|
Expected Return on Assets - Domestic |
-3.0 |
-2.7 |
-31.6 |
-23.7 |
-22.4 |
|
Actuarial Gains and Losses - Domestic |
25.9 |
33.6 |
13.6 |
-17.6 |
-9.1 |
|
Transition Costs - Domestic |
2.0 |
1.0 |
1.1 |
1.1 |
1.1 |
|
Domestic Pension Plan Expense |
138.6 |
141.1 |
94.2 |
60.0 |
63.7 |
|
Total Pension Expense |
138.6 |
141.1 |
94.2 |
60.0 |
63.7 |
|
Discount Rate - Domestic |
2.00% |
2.00% |
2.00% |
2.00% |
2.00% |
|
Expected Rate of Return - Domestic |
0.10% |
0.10% |
2.90% |
2.10% |
2.10% |
|
Total Plan Interest Cost |
39.2 |
38.6 |
38.7 |
34.1 |
34.8 |
|
Total Plan Service Cost |
74.5 |
70.6 |
72.3 |
66.1 |
59.3 |
|
Total Plan Expected Return |
-3.0 |
-2.7 |
-31.6 |
-23.7 |
-22.4 |
Annual Balance Sheet
Financials in: USD
(mil)
|
|
31-Mar-2011 |
31-Mar-2010 |
31-Mar-2009 |
31-Mar-2008 |
31-Mar-2007 |
|
UpdateType/Date |
Updated Normal |
Updated Normal |
Updated Normal |
Updated Normal |
Updated Normal |
|
Filed Currency |
JPY |
JPY |
JPY |
JPY |
JPY |
|
Exchange Rate |
82.88 |
93.44 |
98.77 |
99.535 |
118.075 |
|
Auditor |
KPMG LLP |
KPMG LLP |
KPMG LLP |
KPMG LLP |
Azsa Audit Corp. |
|
Auditor Opinion |
Unqualified |
Unqualified |
Unqualified with
Explanation |
Unqualified |
Unqualified with
Explanation |
|
|
|
|
|
|
|
|
Cash & Equivalents |
1,760.1 |
1,412.0 |
1,906.7 |
690.6 |
844.1 |
|
Cash and Short Term Investments |
1,760.1 |
1,412.0 |
1,906.7 |
690.6 |
844.1 |
|
Accounts Receivable -
Trade, Gross |
3,654.0 |
3,035.3 |
2,873.2 |
3,818.2 |
2,813.5 |
|
Provision for Doubtful
Accounts |
-6.9 |
-8.8 |
-6.8 |
-9.9 |
-7.0 |
|
Trade Accounts Receivable - Net |
3,647.1 |
3,026.6 |
2,866.4 |
3,808.3 |
2,806.5 |
|
Total Receivables, Net |
3,647.1 |
3,026.6 |
2,866.4 |
3,808.3 |
2,806.5 |
|
Inventories - Finished Goods |
1,582.3 |
1,357.1 |
1,640.2 |
1,356.7 |
- |
|
Inventories - Work In Progress |
1,538.5 |
1,477.6 |
1,651.8 |
1,556.4 |
- |
|
Inventories - Raw Materials |
1,480.4 |
1,093.5 |
1,389.0 |
1,200.2 |
- |
|
Total Inventory |
4,601.2 |
3,928.3 |
4,681.0 |
4,113.4 |
3,111.0 |
|
Deferred Income Tax - Current Asset |
260.4 |
344.5 |
101.4 |
226.2 |
175.3 |
|
Other Current Assets |
1,757.7 |
1,697.5 |
980.5 |
777.1 |
545.5 |
|
Other Current Assets, Total |
2,018.1 |
2,042.0 |
1,081.8 |
1,003.3 |
720.8 |
|
Total Current Assets |
12,026.5 |
10,408.9 |
10,535.9 |
9,615.5 |
7,482.3 |
|
|
|
|
|
|
|
|
Property/Plant/Equipment - Net |
11,261.3 |
10,360.3 |
9,826.2 |
10,320.1 |
8,509.6 |
|
Goodwill, Net |
- |
- |
0.0 |
5.5 |
0.0 |
|
Intangibles, Net |
268.2 |
228.9 |
207.3 |
175.5 |
142.2 |
|
LT Investment - Affiliate Companies |
800.6 |
551.3 |
- |
- |
- |
|
LT Investments - Other |
1,705.1 |
1,562.2 |
1,679.2 |
2,334.6 |
2,088.6 |
|
Long Term Investments |
2,505.7 |
2,113.6 |
1,679.2 |
2,334.6 |
2,088.6 |
|
Note Receivable - Long Term |
78.9 |
96.5 |
68.2 |
71.5 |
53.7 |
|
Deferred Income Tax - Long Term Asset |
211.0 |
176.2 |
216.7 |
230.4 |
178.6 |
|
Other Long Term Assets |
573.2 |
688.2 |
707.2 |
645.7 |
529.3 |
|
Other Long Term Assets, Total |
784.2 |
864.4 |
923.9 |
876.1 |
707.9 |
|
Total Assets |
26,924.8 |
24,072.5 |
23,240.7 |
23,398.8 |
18,984.2 |
|
|
|
|
|
|
|
|
Accounts Payable |
5,775.5 |
4,653.5 |
4,856.2 |
4,905.3 |
4,175.0 |
|
Accrued Expenses |
242.2 |
176.6 |
215.7 |
0.0 |
- |
|
Notes Payable/Short Term Debt |
970.6 |
1,160.9 |
1,774.9 |
2,037.3 |
746.2 |
|
Current Portion - Long Term Debt/Capital Leases |
1,598.1 |
703.8 |
910.4 |
1,400.3 |
893.1 |
|
Income Taxes Payable |
109.3 |
69.8 |
52.2 |
268.9 |
183.6 |
|
Other Payables |
542.7 |
532.2 |
504.1 |
599.4 |
432.3 |
|
Deferred Income Tax - Current Liability |
27.5 |
22.0 |
15.6 |
31.4 |
28.8 |
|
Other Current Liabilities |
1,453.0 |
1,330.3 |
1,538.6 |
1,678.9 |
1,336.5 |
|
Other Current liabilities, Total |
2,132.5 |
1,954.2 |
2,110.5 |
2,578.6 |
1,981.1 |
|
Total Current Liabilities |
10,718.8 |
8,649.0 |
9,867.7 |
10,921.5 |
7,795.4 |
|
|
|
|
|
|
|
|
Long Term Debt |
7,462.0 |
7,901.9 |
6,999.9 |
4,834.9 |
4,645.6 |
|
Capital Lease Obligations |
439.8 |
449.2 |
256.9 |
0.0 |
- |
|
Total Long Term Debt |
7,901.8 |
8,351.1 |
7,256.8 |
4,834.9 |
4,645.6 |
|
Total Debt |
10,470.5 |
10,215.8 |
9,942.1 |
8,272.5 |
6,284.8 |
|
|
|
|
|
|
|
|
Deferred Income Tax - LT Liability |
252.9 |
314.9 |
119.1 |
222.7 |
358.0 |
|
Deferred Income Tax |
252.9 |
314.9 |
119.1 |
222.7 |
358.0 |
|
Minority Interest |
588.0 |
431.6 |
347.5 |
480.7 |
375.6 |
|
Reserves |
30.1 |
29.8 |
42.5 |
44.4 |
36.0 |
|
Pension Benefits - Underfunded |
354.1 |
355.8 |
386.2 |
449.6 |
397.4 |
|
Other Long Term Liabilities |
459.5 |
410.9 |
369.9 |
417.5 |
361.9 |
|
Other Liabilities, Total |
843.7 |
796.4 |
798.6 |
911.5 |
795.3 |
|
Total Liabilities |
20,305.2 |
18,543.1 |
18,389.6 |
17,371.3 |
13,969.8 |
|
|
|
|
|
|
|
|
Common Stock |
2,815.1 |
2,496.9 |
2,362.2 |
2,344.0 |
1,976.0 |
|
Common Stock |
2,815.1 |
2,496.9 |
2,362.2 |
2,344.0 |
1,976.0 |
|
Additional Paid-In Capital |
1,003.0 |
889.6 |
841.6 |
836.5 |
705.3 |
|
Retained Earnings (Accumulated Deficit) |
3,648.4 |
2,770.3 |
2,556.5 |
3,067.6 |
2,025.7 |
|
Treasury Stock - Common |
-622.9 |
-549.9 |
-520.7 |
-517.5 |
-266.9 |
|
Unrealized Gain (Loss) |
187.9 |
198.5 |
-107.9 |
349.2 |
616.9 |
|
Translation Adjustment |
-411.8 |
-276.0 |
-280.6 |
-52.3 |
-42.5 |
|
Other Equity, Total |
-411.8 |
-276.0 |
-280.6 |
-52.3 |
-42.5 |
|
Total Equity |
6,619.6 |
5,529.4 |
4,851.1 |
6,027.5 |
5,014.5 |
|
|
|
|
|
|
|
|
Total Liabilities & Shareholders’ Equity |
26,924.8 |
24,072.5 |
23,240.7 |
23,398.8 |
18,984.2 |
|
|
|
|
|
|
|
|
Shares Outstanding - Common Stock Primary
Issue |
3,001.0 |
3,002.4 |
3,002.5 |
3,002.6 |
3,044.6 |
|
Total Common Shares Outstanding |
3,001.0 |
3,002.4 |
3,002.5 |
3,002.6 |
3,044.6 |
|
Treasury Shares - Common Stock Primary Issue |
114.0 |
112.7 |
112.6 |
112.5 |
70.4 |
|
Employees |
34,772 |
33,629 |
33,526 |
33,657 |
31,828 |
|
Number of Common Shareholders |
162,224 |
168,145 |
177,171 |
171,868 |
171,609 |
|
Total Long Term Debt, Supplemental |
9,427.4 |
8,929.3 |
7,879.7 |
6,235.2 |
5,538.6 |
|
Long Term Debt Maturing within 1 Year |
1,818.7 |
638.2 |
879.8 |
1,400.3 |
893.1 |
|
Long Term Debt Maturing in Year 2 |
1,207.4 |
1,372.4 |
783.2 |
855.1 |
1,179.6 |
|
Long Term Debt Maturing in Year 3 |
2,284.5 |
1,046.1 |
1,266.8 |
669.8 |
717.1 |
|
Long Term Debt Maturing in Year 4 |
895.8 |
1,940.5 |
826.3 |
714.2 |
548.5 |
|
Long Term Debt Maturing in Year 5 |
860.7 |
787.3 |
1,709.2 |
648.5 |
594.1 |
|
Long Term Debt Maturing in 2-3 Years |
3,491.9 |
2,418.5 |
2,049.9 |
1,524.9 |
1,896.7 |
|
Long Term Debt Maturing in 4-5 Years |
1,756.5 |
2,727.7 |
2,535.4 |
1,362.7 |
1,142.6 |
|
Long Term Debt Matur. in Year 6 & Beyond |
2,360.3 |
3,144.8 |
2,414.5 |
1,947.2 |
1,606.2 |
|
Total Capital Leases, Supplemental |
517.0 |
514.7 |
287.5 |
- |
- |
|
Capital Lease Payments Due in Year 1 |
77.2 |
65.6 |
30.6 |
- |
- |
|
Capital Lease Payments Due in Year 2 |
106.0 |
66.9 |
31.4 |
- |
- |
|
Capital Lease Payments Due in Year 3 |
74.9 |
92.7 |
32.2 |
- |
- |
|
Capital Lease Payments Due in Year 4 |
142.3 |
65.3 |
55.8 |
- |
- |
|
Capital Lease Payments Due in Year 5 |
106.4 |
125.4 |
134.2 |
- |
- |
|
Capital Lease Payments Due in 2-3 Years |
180.9 |
159.5 |
63.5 |
- |
- |
|
Capital Lease Payments Due in 4-5 Years |
248.7 |
190.7 |
190.0 |
- |
- |
|
Cap. Lease Pymts. Due in Year 6 & Beyond |
10.2 |
98.9 |
3.4 |
- |
- |
|
Pension Obligation - Domestic |
1,973.8 |
1,867.9 |
1,886.1 |
2,000.9 |
1,756.2 |
|
Plan Assets - Domestic |
1,723.0 |
1,569.4 |
1,447.6 |
1,768.5 |
1,859.5 |
|
Funded Status - Domestic |
-250.9 |
-298.5 |
-438.5 |
-232.4 |
103.2 |
|
Total Funded Status |
-250.9 |
-298.5 |
-438.5 |
-232.4 |
103.2 |
|
Discount Rate - Domestic |
2.00% |
2.00% |
2.00% |
2.00% |
2.00% |
|
Expected Rate of Return - Domestic |
0.10% |
0.10% |
2.90% |
2.10% |
2.10% |
|
Prepaid Benefits - Domestic |
310.7 |
304.4 |
328.5 |
317.3 |
234.9 |
|
Accrued Liabilities - Domestic |
-354.1 |
-355.8 |
-386.2 |
-449.6 |
-397.4 |
|
Other Assets, Net - Domestic |
207.5 |
247.1 |
380.8 |
100.1 |
-265.7 |
|
Net Assets Recognized on Balance Sheet |
164.2 |
195.7 |
323.0 |
-32.2 |
-428.2 |
|
Total Plan Obligations |
1,973.8 |
1,867.9 |
1,886.1 |
2,000.9 |
1,756.2 |
|
Total Plan Assets |
1,723.0 |
1,569.4 |
1,447.6 |
1,768.5 |
1,859.5 |
Annual Cash Flows
Financials in: USD
(mil)
|
|
31-Mar-2011 |
31-Mar-2010 |
31-Mar-2009 |
31-Mar-2008 |
31-Mar-2007 |
|
Period Length |
12 Months |
12 Months |
12 Months |
12 Months |
12 Months |
|
UpdateType/Date |
Updated Normal |
Updated Normal |
Updated Normal |
Updated Normal |
Updated Normal |
|
Filed Currency |
JPY |
JPY |
JPY |
JPY |
JPY |
|
Exchange Rate
(Period Average) |
85.691434 |
92.941082 |
100.484331 |
114.302336 |
116.944303 |
|
Auditor |
KPMG LLP |
KPMG LLP |
KPMG LLP |
KPMG LLP |
Azsa Audit Corp. |
|
Auditor Opinion |
Unqualified |
Unqualified |
Unqualified with
Explanation |
Unqualified |
Unqualified with
Explanation |
|
|
|
|
|
|
|
|
Net Income/Starting Line |
1,037.1 |
151.7 |
276.7 |
1,341.8 |
1,499.6 |
|
Depreciation |
1,339.9 |
1,278.6 |
1,280.8 |
975.6 |
741.3 |
|
Depreciation/Depletion |
1,339.9 |
1,278.6 |
1,280.8 |
975.6 |
741.3 |
|
Unusual Items |
47.3 |
69.7 |
344.9 |
62.3 |
53.2 |
|
Equity in Net Earnings (Loss) |
-35.9 |
-19.5 |
-79.0 |
-111.9 |
-120.2 |
|
Other Non-Cash Items |
177.1 |
183.0 |
140.8 |
138.3 |
166.0 |
|
Non-Cash Items |
188.5 |
233.2 |
406.7 |
88.7 |
99.0 |
|
Accounts Receivable |
-458.6 |
-97.7 |
739.7 |
-282.0 |
198.4 |
|
Inventories |
-206.1 |
1,060.5 |
-672.0 |
-350.4 |
-464.0 |
|
Other Assets |
-180.8 |
0.0 |
- |
- |
- |
|
Accounts Payable |
636.7 |
-439.8 |
162.7 |
-137.0 |
339.3 |
|
Other Operating Cash Flow |
-281.9 |
-326.2 |
-1,018.5 |
-549.1 |
-881.7 |
|
Changes in Working Capital |
-490.7 |
196.7 |
-787.9 |
-1,318.5 |
-807.9 |
|
Cash from Operating Activities |
2,074.8 |
1,860.2 |
1,176.3 |
1,087.6 |
1,532.0 |
|
|
|
|
|
|
|
|
Purchase of Fixed Assets |
-1,127.4 |
-1,379.6 |
-1,230.4 |
-1,287.1 |
-1,057.6 |
|
Capital Expenditures |
-1,127.4 |
-1,379.6 |
-1,230.4 |
-1,287.1 |
-1,057.6 |
|
Sale of Fixed Assets |
20.6 |
55.3 |
23.5 |
67.9 |
12.8 |
|
Sale/Maturity of Investment |
44.5 |
16.1 |
52.2 |
132.9 |
52.9 |
|
Purchase of Investments |
-64.1 |
-19.0 |
-135.8 |
-550.7 |
-85.7 |
|
Other Investing Cash Flow |
-1.8 |
32.6 |
22.6 |
-2.3 |
-21.7 |
|
Other Investing Cash Flow Items, Total |
-0.9 |
85.0 |
-37.5 |
-352.2 |
-41.7 |
|
Cash from Investing Activities |
-1,128.3 |
-1,294.6 |
-1,267.9 |
-1,639.3 |
-1,099.3 |
|
|
|
|
|
|
|
|
Other Financing Cash Flow |
-60.6 |
-38.4 |
-29.6 |
-52.6 |
-91.5 |
|
Financing Cash Flow Items |
-60.6 |
-38.4 |
-29.6 |
-52.6 |
-91.5 |
|
Cash Dividends Paid - Common |
-104.6 |
-0.8 |
-208.6 |
-197.8 |
-237.4 |
|
Total Cash Dividends Paid |
-104.6 |
-0.8 |
-208.6 |
-197.8 |
-237.4 |
|
Repurchase/Retirement
of Common |
- |
- |
0.0 |
-177.8 |
-258.8 |
|
Common Stock, Net |
- |
- |
0.0 |
-177.8 |
-258.8 |
|
Issuance (Retirement) of Stock, Net |
- |
- |
0.0 |
-177.8 |
-258.8 |
|
Short Term Debt, Net |
-298.9 |
-695.8 |
-210.4 |
996.9 |
-282.3 |
|
Long Term Debt Issued |
114.4 |
1,612.4 |
3,095.3 |
652.1 |
1,552.3 |
|
Long Term Debt
Reduction |
-796.1 |
-1,196.3 |
-1,266.4 |
-948.2 |
-1,099.8 |
|
Long Term Debt, Net |
-681.7 |
416.1 |
1,828.9 |
-296.1 |
452.4 |
|
Issuance (Retirement) of Debt, Net |
-980.6 |
-279.7 |
1,618.5 |
700.8 |
170.2 |
|
Cash from Financing Activities |
-1,145.9 |
-318.9 |
1,380.3 |
272.6 |
-417.5 |
|
|
|
|
|
|
|
|
Foreign Exchange Effects |
-57.2 |
6.8 |
-83.9 |
3.8 |
7.6 |
|
Net Change in Cash |
-256.6 |
253.5 |
1,204.8 |
-275.4 |
22.9 |
|
|
|
|
|
|
|
|
Net Cash - Beginning Balance |
2,470.5 |
2,024.3 |
663.6 |
858.8 |
816.5 |
|
Net Cash - Ending Balance |
2,213.8 |
2,277.8 |
1,868.4 |
583.4 |
839.4 |
|
Cash Interest Paid |
241.5 |
229.8 |
192.3 |
183.4 |
174.2 |
|
Cash Taxes Paid |
81.8 |
162.3 |
572.4 |
440.5 |
727.0 |
Annual Income Statement
Financials in: USD
(mil)
Except for share
items (millions) and per share items (actual units)
|
|
31-Mar-2011 |
31-Mar-2010 |
31-Mar-2009 |
31-Mar-2008 |
31-Mar-2007 |
|
Period Length |
12 Months |
12 Months |
12 Months |
12 Months |
12 Months |
|
UpdateType/Date |
Updated Normal |
Updated Normal |
Updated Normal |
Updated Normal |
Updated Normal |
|
Filed Currency |
JPY |
JPY |
JPY |
JPY |
JPY |
|
Exchange Rate
(Period Average) |
85.691434 |
92.941082 |
100.484331 |
114.302336 |
116.944303 |
|
Auditor |
KPMG LLP |
KPMG LLP |
KPMG LLP |
KPMG LLP |
Azsa Audit Corp. |
|
Auditor Opinion |
Unqualified |
Unqualified |
Unqualified with
Explanation |
Unqualified |
Unqualified with
Explanation |
|
|
|
|
|
|
|
|
Net Sales |
21,689.1 |
17,979.4 |
21,667.9 |
18,655.8 |
16,335.1 |
|
Total Revenue |
21,689.1 |
17,979.4 |
21,667.9 |
18,655.8 |
16,335.1 |
|
|
|
|
|
|
|
|
Cost of sales |
18,330.6 |
15,875.2 |
18,812.1 |
15,374.5 |
13,195.7 |
|
Shipping Expense |
478.2 |
379.0 |
432.7 |
413.2 |
372.8 |
|
Salary Expense |
387.2 |
360.5 |
406.4 |
365.4 |
326.8 |
|
R and D Expense |
124.4 |
112.3 |
106.5 |
95.7 |
87.6 |
|
Provision for Bonus |
49.1 |
37.7 |
41.0 |
- |
- |
|
Provision for doubtful accounts(SGA) |
7.4 |
7.9 |
4.7 |
11.9 |
1.9 |
|
Periodic retirement benefit costs |
23.7 |
21.6 |
18.7 |
14.7 |
13.9 |
|
Depreciation |
51.3 |
42.5 |
34.9 |
28.2 |
26.6 |
|
Other SG&A |
783.8 |
647.6 |
647.3 |
581.4 |
525.8 |
|
SP G Compensation for transfer |
0.0 |
-79.8 |
0.0 |
- |
- |
|
SP Valuation Loss-Invest.Sec |
- |
0.0 |
171.4 |
0.0 |
- |
|
SP L-adjustment for changes of accoun |
27.8 |
0.0 |
- |
- |
- |
|
SP Impairment Loss |
0.0 |
38.5 |
157.7 |
0.0 |
40.8 |
|
SP Real Estate Allotment Loss |
- |
- |
- |
- |
0.0 |
|
SP Environmental Expenses |
- |
- |
- |
0.0 |
26.7 |
|
SP Loss by Disaster |
- |
- |
- |
- |
0.0 |
|
Total Operating Expense |
20,263.4 |
17,442.9 |
20,833.4 |
16,885.1 |
14,618.7 |
|
|
|
|
|
|
|
|
SP Sale Gain-Invest.Sec |
25.3 |
0.0 |
0.0 |
18.6 |
0.0 |
|
SP L on Business Liquidated |
- |
- |
0.0 |
-58.4 |
0.0 |
|
NOP Interest Income |
36.5 |
25.0 |
22.2 |
18.9 |
16.8 |
|
NOP Dividend Income |
27.7 |
21.5 |
36.1 |
25.8 |
27.1 |
|
NOP Allotted Money-Ope. |
77.2 |
75.2 |
83.7 |
85.6 |
106.2 |
|
NOP Gain-Equity Method |
35.9 |
19.5 |
79.0 |
111.9 |
120.2 |
|
NOP Other Non-op. Income |
217.2 |
197.3 |
142.7 |
130.1 |
181.6 |
|
NOP Interest Expense |
-241.4 |
-229.4 |
-199.1 |
-183.1 |
-176.1 |
|
NOP Labor Fee-Transfer |
-199.4 |
-200.3 |
-224.5 |
-217.3 |
-261.4 |
|
NOP Other Non-op.Expense |
-367.7 |
-293.4 |
-498.0 |
-361.0 |
-231.0 |
|
Net Income Before Taxes |
1,037.1 |
151.7 |
276.7 |
1,341.8 |
1,499.7 |
|
|
|
|
|
|
|
|
Provision for Income Taxes |
226.1 |
10.8 |
595.6 |
523.5 |
524.9 |
|
Net Income After Taxes |
810.9 |
140.9 |
-319.0 |
818.3 |
974.7 |
|
|
|
|
|
|
|
|
Minority Interest |
-193.1 |
-73.0 |
6.1 |
-40.3 |
-36.9 |
|
Net Income Before Extra. Items |
617.8 |
67.9 |
-312.9 |
778.0 |
937.8 |
|
Net Income |
617.8 |
67.9 |
-312.9 |
778.0 |
937.8 |
|
|
|
|
|
|
|
|
Directors' Bonuses |
- |
- |
- |
- |
0.0 |
|
Rounding Adjustment |
0.0 |
0.0 |
- |
0.0 |
0.0 |
|
Income Available to Com Excl ExtraOrd |
617.8 |
67.8 |
-312.9 |
778.0 |
937.8 |
|
|
|
|
|
|
|
|
Income Available to Com Incl ExtraOrd |
617.8 |
67.8 |
-312.9 |
778.0 |
937.8 |
|
|
|
|
|
|
|
|
Basic Weighted Average Shares |
3,002.1 |
3,002.5 |
3,002.5 |
3,001.4 |
3,100.7 |
|
Basic EPS Excluding ExtraOrdinary Items |
0.21 |
0.02 |
-0.10 |
0.26 |
0.30 |
|
Basic EPS Including ExtraOrdinary Item |
0.21 |
0.02 |
-0.10 |
0.26 |
0.30 |
|
Dilution Adjustment |
0.0 |
0.0 |
0.0 |
0.0 |
0.0 |
|
Diluted Net Income |
617.8 |
67.8 |
-312.9 |
778.0 |
937.8 |
|
Diluted Weighted Average Shares |
3,002.1 |
3,002.5 |
3,002.5 |
3,001.4 |
3,100.7 |
|
Diluted EPS Excluding ExtraOrd Items |
0.21 |
0.02 |
-0.10 |
0.26 |
0.30 |
|
Diluted EPS Including ExtraOrd Items |
0.21 |
0.02 |
-0.10 |
0.26 |
0.30 |
|
DPS-Common Stock |
0.04 |
0.02 |
0.03 |
0.06 |
0.06 |
|
Gross Dividends - Common Stock |
105.3 |
48.5 |
104.7 |
184.2 |
184.2 |
|
Normalized Income Before Taxes |
1,064.9 |
110.4 |
605.8 |
1,400.2 |
1,567.2 |
|
|
|
|
|
|
|
|
Inc Tax Ex Impact of Sp Items |
232.2 |
7.9 |
710.8 |
546.3 |
548.6 |
|
Normalized Income After Taxes |
832.7 |
102.5 |
-105.0 |
853.9 |
1,018.6 |
|
|
|
|
|
|
|
|
Normalized Inc. Avail to Com. |
639.5 |
29.4 |
-98.9 |
813.6 |
981.7 |
|
|
|
|
|
|
|
|
Basic Normalized EPS |
0.21 |
0.01 |
-0.03 |
0.27 |
0.32 |
|
Diluted Normalized EPS |
0.21 |
0.01 |
-0.03 |
0.27 |
0.32 |
|
Research & Development Exp (SGA) |
124.4 |
112.3 |
106.5 |
95.7 |
87.6 |
|
R & D Expense (COGS+SGA) |
348.1 |
304.0 |
308.8 |
263.7 |
- |
|
Interest Expense |
241.4 |
229.4 |
199.1 |
183.1 |
176.1 |
|
Depreciation |
1,339.9 |
1,278.6 |
1,280.8 |
975.6 |
741.3 |
|
Reported Operating profit |
1,453.5 |
495.1 |
1,163.7 |
1,770.7 |
1,784.0 |
|
Reported Ordinary profit |
1,039.6 |
110.4 |
605.8 |
1,381.6 |
1,567.2 |
|
Service Cost |
74.5 |
70.6 |
72.3 |
66.1 |
59.3 |
|
Interest Cost |
39.2 |
38.6 |
38.7 |
34.1 |
34.8 |
|
Expected Return on Plan Assets |
-3.0 |
-2.7 |
-31.6 |
-23.7 |
-22.4 |
|
Pension Exp. due to Acct. Changes |
2.0 |
1.0 |
1.1 |
1.1 |
1.1 |
|
Actuarial Gains and Losses |
25.9 |
33.6 |
13.6 |
-17.6 |
-9.1 |
|
Domestic Pension Plan Expense |
138.6 |
141.1 |
94.2 |
60.0 |
63.7 |
|
Total Pension Expense |
138.6 |
141.1 |
94.2 |
60.0 |
63.7 |
|
Discount Rate |
2.00% |
2.00% |
2.00% |
2.00% |
2.00% |
|
Expected Rate of Return |
0.10% |
0.10% |
2.90% |
2.10% |
2.10% |
Annual Balance
Sheet
Financials
in: USD (mil)
|
|
31-Mar-2011 |
31-Mar-2010 |
31-Mar-2009 |
31-Mar-2008 |
31-Mar-2007 |
|
UpdateType/Date |
Updated Normal |
Updated Normal |
Updated Normal |
Updated Normal |
Updated Normal |
|
Filed Currency |
JPY |
JPY |
JPY |
JPY |
JPY |
|
Exchange Rate |
82.88 |
93.44 |
98.77 |
99.535 |
118.075 |
|
Auditor |
KPMG LLP |
KPMG LLP |
KPMG LLP |
KPMG LLP |
Azsa Audit Corp. |
|
Auditor Opinion |
Unqualified |
Unqualified |
Unqualified with
Explanation |
Unqualified |
Unqualified with
Explanation |
|
|
|
|
|
|
|
|
Cash and Deposit |
1,760.1 |
1,412.0 |
1,906.7 |
690.6 |
844.1 |
|
Note&Acct.Rcvbl. |
3,654.0 |
3,035.3 |
2,873.2 |
3,818.2 |
2,813.5 |
|
Lease receivables
and investment assets |
313.8 |
131.2 |
- |
- |
- |
|
Inventories |
- |
- |
- |
- |
3,111.0 |
|
Merchandise &
Product |
1,582.3 |
1,357.1 |
1,640.2 |
1,356.7 |
- |
|
Work in Process |
1,538.5 |
1,477.6 |
1,651.8 |
1,556.4 |
- |
|
Raw Materials
& Supplies |
1,480.4 |
1,093.5 |
1,389.0 |
1,200.2 |
- |
|
Dfrd. Tax Assets |
260.4 |
344.5 |
101.4 |
226.2 |
175.3 |
|
Other Curr.Asset |
1,443.9 |
1,566.3 |
980.5 |
777.1 |
545.5 |
|
Allow. for
Doubtful Account |
-6.9 |
-8.8 |
-6.8 |
-9.9 |
-7.0 |
|
Total Current
Assets |
12,026.5 |
10,408.9 |
10,535.9 |
9,615.5 |
7,482.3 |
|
|
|
|
|
|
|
|
Bldg.&Structure |
3,372.6 |
3,085.2 |
2,861.1 |
2,955.7 |
2,491.6 |
|
Machinery&Equip&Vehicles |
4,383.3 |
4,234.2 |
4,271.1 |
4,678.5 |
3,557.9 |
|
Tool,
Furnitures & Fixtures |
126.5 |
121.8 |
142.4 |
154.3 |
126.2 |
|
Land |
2,472.8 |
2,186.4 |
2,008.6 |
2,030.4 |
1,722.9 |
|
Construction
in process |
906.2 |
732.7 |
543.1 |
501.3 |
611.0 |
|
Software&Rights |
- |
- |
- |
175.5 |
142.2 |
|
Software |
206.2 |
170.2 |
165.4 |
- |
- |
|
Goodwill |
- |
- |
0.0 |
5.5 |
0.0 |
|
Other
Intangibles |
62.0 |
58.6 |
41.8 |
0.0 |
- |
|
Investment Sec. |
1,705.1 |
1,562.2 |
1,679.2 |
2,334.6 |
2,088.6 |
|
Equity
secs.-nonconsol affil.&sub. |
590.5 |
541.4 |
- |
- |
- |
|
LT Loan |
78.9 |
96.5 |
68.2 |
71.5 |
53.7 |
|
Dfrd Tax Asset |
211.0 |
176.2 |
216.7 |
230.4 |
178.6 |
|
Other Assets |
610.9 |
729.8 |
744.6 |
684.0 |
572.6 |
|
Inv't
partnership-nonconsol.affil.&subs |
210.1 |
9.9 |
- |
- |
- |
|
Allow. for
Doubtful Account |
-37.8 |
-41.6 |
-37.4 |
-38.4 |
-43.3 |
|
Translation Adj. |
- |
- |
- |
0.0 |
- |
|
Total Assets |
26,924.8 |
24,072.5 |
23,240.7 |
23,398.8 |
18,984.2 |
|
|
|
|
|
|
|
|
Note&Acct.
Pybl. |
5,775.5 |
4,653.5 |
4,856.2 |
4,905.3 |
4,175.0 |
|
ST Borrowing |
970.6 |
1,160.9 |
1,218.0 |
932.1 |
746.2 |
|
Current LT Debt |
1,088.5 |
635.7 |
374.0 |
815.3 |
695.9 |
|
Lease Debt
(current) |
77.2 |
65.6 |
30.6 |
0.0 |
- |
|
Commercial Paper |
- |
0.0 |
556.8 |
1,105.1 |
0.0 |
|
Curr.-Corp.Bond |
432.4 |
2.5 |
505.8 |
585.1 |
197.2 |
|
Other Payable |
542.7 |
532.2 |
504.1 |
599.4 |
432.3 |
|
Income Tax Pybl. |
109.3 |
69.8 |
52.2 |
268.9 |
183.6 |
|
Dfrd. Tax Liab. |
27.5 |
22.0 |
15.6 |
31.4 |
28.8 |
|
Allow. for Bonus |
242.2 |
176.6 |
215.7 |
0.0 |
- |
|
Provision of
Enviromental Expenses |
- |
- |
- |
0.0 |
2.3 |
|
Provision-Repair
For Disaster Loss |
- |
- |
- |
- |
0.0 |
|
Prov-Prod.Wrrty. |
125.5 |
133.0 |
112.7 |
75.8 |
56.9 |
|
Provision for
Construction Loss |
107.2 |
29.7 |
20.1 |
0.0 |
- |
|
Prov-Busi.Liquid |
0.2 |
32.5 |
39.8 |
55.4 |
34.8 |
|
Other Curr.Liab. |
1,220.1 |
1,135.1 |
1,366.0 |
1,547.7 |
1,242.5 |
|
Total Current
Liabilities |
10,718.8 |
8,649.0 |
9,867.7 |
10,921.5 |
7,795.4 |
|
|
|
|
|
|
|
|
Corporate Bond |
2,139.8 |
2,281.5 |
2,023.1 |
2,159.6 |
1,974.9 |
|
LT Borrowing |
5,322.1 |
5,620.4 |
4,976.8 |
2,675.3 |
2,670.7 |
|
Lease Debt |
439.8 |
449.2 |
256.9 |
0.0 |
- |
|
Total Long Term
Debt |
7,901.8 |
8,351.1 |
7,256.8 |
4,834.9 |
4,645.6 |
|
|
|
|
|
|
|
|
Dfrd. Tax Liab. |
189.7 |
258.9 |
65.3 |
168.8 |
312.5 |
|
Reval-Dfrd. Tax |
63.1 |
56.0 |
53.7 |
53.8 |
45.5 |
|
Res-Accr.Retire |
354.1 |
355.8 |
386.2 |
449.6 |
397.4 |
|
Provision for
Environment |
30.1 |
29.8 |
42.5 |
44.4 |
36.0 |
|
Negative Goodwill |
- |
- |
- |
0.0 |
1.8 |
|
Other Liability |
459.5 |
410.9 |
369.9 |
417.5 |
360.1 |
|
Minor. Interest |
588.0 |
431.6 |
347.5 |
480.7 |
375.6 |
|
Total
Liabilities |
20,305.2 |
18,543.1 |
18,389.6 |
17,371.3 |
13,969.8 |
|
|
|
|
|
|
|
|
Common Stock |
2,815.1 |
2,496.9 |
2,362.2 |
2,344.0 |
1,976.0 |
|
Capital Surplus |
1,003.0 |
889.6 |
841.6 |
836.5 |
705.3 |
|
Retained Earning |
3,648.4 |
2,770.3 |
2,556.5 |
3,067.6 |
2,025.7 |
|
Treasury Stock |
-622.9 |
-549.9 |
-520.7 |
-517.5 |
-266.9 |
|
Unreal.Gain-Sec |
238.2 |
241.1 |
4.5 |
357.9 |
640.0 |
|
Unrealized
Gain/Loss on Hedge |
7.0 |
9.4 |
-63.4 |
40.5 |
18.5 |
|
Unreal.Gain-Land |
-57.4 |
-52.1 |
-49.0 |
-49.2 |
-41.5 |
|
Translation Adj. |
-411.8 |
-276.0 |
-280.6 |
-52.3 |
-42.5 |
|
Total Equity |
6,619.6 |
5,529.4 |
4,851.1 |
6,027.5 |
5,014.5 |
|
|
|
|
|
|
|
|
Total
Liabilities & Shareholders' Equity |
26,924.8 |
24,072.5 |
23,240.7 |
23,398.8 |
18,984.2 |
|
|
|
|
|
|
|
|
S/O-Common Stock |
3,001.0 |
3,002.4 |
3,002.5 |
3,002.6 |
3,044.6 |
|
Total Common
Shares Outstanding |
3,001.0 |
3,002.4 |
3,002.5 |
3,002.6 |
3,044.6 |
|
T/S-Common Stock |
114.0 |
112.7 |
112.6 |
112.5 |
70.4 |
|
Full-Time Employees |
34,772 |
33,629 |
33,526 |
33,657 |
31,828 |
|
Number of Common Shareholders |
162,224 |
168,145 |
177,171 |
171,868 |
171,609 |
|
Long Term Debt Maturing Within 1 Year |
1,818.7 |
638.2 |
879.8 |
1,400.3 |
893.1 |
|
Long Term Debt Maturing Within 2 Year |
1,207.4 |
1,372.4 |
783.2 |
855.1 |
1,179.6 |
|
Long Term Debt Maturing Within 3 Year |
2,284.5 |
1,046.1 |
1,266.8 |
669.8 |
717.1 |
|
Long Term Debt Maturing Within 4 Year |
895.8 |
1,940.5 |
826.3 |
714.2 |
548.5 |
|
Long Term Debt Maturing Within 5 Year |
860.7 |
787.3 |
1,709.2 |
648.5 |
594.1 |
|
Long Term Debt Remaining Maturities |
2,360.3 |
3,144.8 |
2,414.5 |
1,947.2 |
1,606.2 |
|
Total Long Term Debt, Supplemental |
9,427.4 |
8,929.3 |
7,879.7 |
6,235.2 |
5,538.6 |
|
Capital Lease Payments Due within 1 Year |
77.2 |
65.6 |
30.6 |
- |
- |
|
Capital Lease Payments Due in Year 2 |
106.0 |
66.9 |
31.4 |
- |
- |
|
Capital Lease Payments Due in Year 3 |
74.9 |
92.7 |
32.2 |
- |
- |
|
Capital Lease Payments Due in Year 4 |
142.3 |
65.3 |
55.8 |
- |
- |
|
Capital Lease Payments Due in Year 5 |
106.4 |
125.4 |
134.2 |
- |
- |
|
Capital Lease - Remaining Maturities |
10.2 |
98.9 |
3.4 |
- |
- |
|
Total Capital Leases |
517.0 |
514.7 |
287.5 |
- |
- |
|
Pesion obligation |
1,973.8 |
1,867.9 |
1,886.1 |
2,000.9 |
1,756.2 |
|
Plan assets |
1,723.0 |
1,569.4 |
1,447.6 |
1,768.5 |
1,859.5 |
|
Funded status |
-250.9 |
-298.5 |
-438.5 |
-232.4 |
103.2 |
|
Total Funded Status |
-250.9 |
-298.5 |
-438.5 |
-232.4 |
103.2 |
|
Discount Rate |
2.00% |
2.00% |
2.00% |
2.00% |
2.00% |
|
Expected Rate of Return |
0.10% |
0.10% |
2.90% |
2.10% |
2.10% |
|
Expense unrecog. for acct. changes |
3.4 |
4.8 |
5.5 |
6.6 |
6.4 |
|
Unrecog. actuarial G&L |
204.2 |
242.3 |
375.3 |
93.5 |
-272.1 |
|
Perpaid pension benefits |
310.7 |
304.4 |
328.5 |
317.3 |
234.9 |
|
Reserve for Accrued Retirement Benefits |
-354.1 |
-355.8 |
-386.2 |
-449.6 |
-397.4 |
|
Net Assets Recognized on Balance Sheet |
164.2 |
195.7 |
323.0 |
-32.2 |
-428.2 |
Annual Cash Flows
Financials in: USD (mil)
|
|
31-Mar-2011 |
31-Mar-2010 |
31-Mar-2009 |
31-Mar-2008 |
31-Mar-2007 |
|
Period Length |
12 Months |
12 Months |
12 Months |
12 Months |
12 Months |
|
UpdateType/Date |
Updated Normal |
Updated Normal |
Updated Normal |
Updated Normal |
Updated Normal |
|
Filed Currency |
JPY |
JPY |
JPY |
JPY |
JPY |
|
Exchange Rate
(Period Average) |
85.691434 |
92.941082 |
100.484331 |
114.302336 |
116.944303 |
|
Auditor |
KPMG LLP |
KPMG LLP |
KPMG LLP |
KPMG LLP |
Azsa Audit Corp. |
|
Auditor Opinion |
Unqualified |
Unqualified |
Unqualified with
Explanation |
Unqualified |
Unqualified with
Explanation |
|
|
|
|
|
|
|
|
Income Before Tax |
1,037.1 |
151.7 |
276.7 |
1,341.8 |
1,499.6 |
|
Depreciation |
1,339.9 |
1,278.6 |
1,280.8 |
975.6 |
741.3 |
|
Int. and Div.
Income |
-64.2 |
-46.5 |
-58.3 |
-44.8 |
-43.8 |
|
Interest Expense |
241.4 |
229.4 |
199.1 |
183.1 |
176.1 |
|
Sale-Investment
Sec. |
-33.0 |
-10.3 |
-12.9 |
-25.7 |
-24.3 |
|
Val.Loss-Invest.Sec |
23.1 |
9.3 |
171.4 |
0.0 |
- |
|
Loss on adjustment
for changes of accoun |
27.8 |
0.0 |
- |
- |
- |
|
Gain/Los-Eqty.Method |
-35.9 |
-19.5 |
-79.0 |
-111.9 |
-120.2 |
|
L on Liquid. of
Business |
- |
- |
0.0 |
58.4 |
0.0 |
|
Loss Real Estate
Allotment |
- |
- |
- |
- |
0.0 |
|
Provision for
Environment Cost |
- |
- |
- |
0.0 |
-8.6 |
|
Allowance for
Casualty Loss |
- |
- |
- |
0.0 |
-12.2 |
|
Impairment Loss |
0.0 |
38.5 |
157.7 |
0.0 |
40.8 |
|
Sale of PPE |
-0.9 |
-0.5 |
-1.6 |
-8.5 |
0.0 |
|
Retire. of PPE |
30.3 |
32.8 |
30.2 |
38.1 |
36.7 |
|
Account Receivable |
-458.6 |
-97.7 |
739.7 |
-282.0 |
198.4 |
|
Lease receivable
and lease inv't asssts |
-180.8 |
0.0 |
- |
- |
- |
|
Inventories |
-206.1 |
1,060.5 |
-672.0 |
-350.4 |
-464.0 |
|
Account Payable |
636.7 |
-439.8 |
162.7 |
-137.0 |
339.3 |
|
Other
Opera.Activity |
-34.8 |
0.5 |
-345.2 |
6.8 |
-57.9 |
|
Int. and Div.
Rcvd. |
76.2 |
65.4 |
91.4 |
68.0 |
77.4 |
|
Interest Paid |
-241.5 |
-229.8 |
-192.3 |
-183.4 |
-174.2 |
|
Taxes Paid |
-81.8 |
-162.3 |
-572.4 |
-440.5 |
-727.0 |
|
Consolid. Change |
- |
- |
0.0 |
-0.1 |
54.5 |
|
Adjustment |
-0.1 |
- |
- |
- |
- |
|
Cash from
Operating Activities |
2,074.8 |
1,860.2 |
1,176.3 |
1,087.6 |
1,532.0 |
|
|
|
|
|
|
|
|
Capital
Expenditure |
-1,127.4 |
-1,379.6 |
-1,230.4 |
-1,287.1 |
-1,057.6 |
|
Sale-Fixed Assets |
20.6 |
55.3 |
23.5 |
67.9 |
12.8 |
|
Purch-Investment
Sec |
-42.4 |
-16.1 |
-114.3 |
-542.6 |
-85.7 |
|
Sale-Investment
Sec. |
44.7 |
16.1 |
46.0 |
132.9 |
52.9 |
|
Closely-held Inv't
paid |
-39.0 |
-1.9 |
-21.5 |
0.0 |
- |
|
ST Loan, Net |
-0.6 |
0.8 |
0.9 |
15.6 |
5.8 |
|
LT Loan Extended |
-11.4 |
-30.8 |
-3.1 |
-11.0 |
-2.9 |
|
LT Loan Recovered |
38.1 |
4.7 |
6.9 |
2.6 |
2.1 |
|
Relocation
Compensation Rcvd. |
0.0 |
60.7 |
52.9 |
0.0 |
- |
|
Purch. of Consol.
Subs.' Securities |
17.3 |
-1.0 |
0.0 |
-8.1 |
0.0 |
|
Sale of Consol.
Subs.' Securities |
-0.2 |
0.0 |
6.2 |
0.0 |
- |
|
Other Inv.
Activity |
-28.0 |
-2.7 |
-35.0 |
-9.6 |
-26.8 |
|
Cash from
Investing Activities |
-1,128.3 |
-1,294.6 |
-1,267.9 |
-1,639.3 |
-1,099.3 |
|
|
|
|
|
|
|
|
ST Debt, Net |
-298.9 |
-104.0 |
337.0 |
34.5 |
-282.3 |
|
Commercial
Paper,Net |
0.0 |
-591.8 |
-547.3 |
962.4 |
0.0 |
|
Issued-LT Debt |
114.4 |
1,000.8 |
2,497.0 |
302.2 |
1,029.8 |
|
Repaid-LT Debt |
-719.6 |
-398.9 |
-686.9 |
-744.6 |
-514.7 |
|
Issued-Corporat.Bond |
0.0 |
355.1 |
346.6 |
349.9 |
522.5 |
|
Redemp-Corporat.Bond |
-2.8 |
-746.3 |
-579.6 |
-203.6 |
-585.1 |
|
Treasury stock
purchased |
- |
- |
0.0 |
-177.8 |
-258.8 |
|
Proceed from Sale
and Lease Back |
0.0 |
256.6 |
251.7 |
0.0 |
- |
|
Increase
(decrease) in finance lease obl |
-73.8 |
-51.1 |
0.0 |
- |
- |
|
Dividend Paid |
-104.6 |
-0.8 |
-208.6 |
-197.8 |
-237.4 |
|
Other
Finan.Activity |
-60.6 |
-38.4 |
-29.6 |
-52.6 |
-91.5 |
|
Cash from
Financing Activities |
-1,145.9 |
-318.9 |
1,380.3 |
272.6 |
-417.5 |
|
|
|
|
|
|
|
|
Foreign Exchange Effects |
-57.2 |
6.8 |
-83.9 |
3.8 |
7.6 |
|
Net Change in
Cash |
-256.6 |
253.5 |
1,204.8 |
-275.4 |
22.9 |
|
|
|
|
|
|
|
|
Net Cash - Beginning Balance |
2,470.5 |
2,024.3 |
663.6 |
858.8 |
816.5 |
|
Net Cash - Ending Balance |
2,213.8 |
2,277.8 |
1,868.4 |
583.4 |
839.4 |
|
Cash Interest Paid |
241.5 |
229.8 |
192.3 |
183.4 |
174.2 |
|
Cash Taxes Paid |
81.8 |
162.3 |
572.4 |
440.5 |
727.0 |
Financial Health
Financials in: USD (mil)
Except for share items (millions) and per share items (actual units)
|
Key
Indicators USD (mil) |
||||||
|
|
Quarter |
Quarter |
Annual |
1 Year |
3 Year |
5 Year |
|
Total Revenue1 |
5,776.7 |
3.06% |
21,689.1 |
11.22% |
-4.48% |
2.20% |
|
Research & Development1 |
- |
- |
124.4 |
2.11% |
-0.87% |
2.19% |
|
Operating Income1 |
355.8 |
-34.21% |
1,425.7 |
145.04% |
-15.49% |
-9.04% |
|
Income Available to Common Excl Extraord
Items1 |
120.5 |
-50.87% |
617.8 |
739.77% |
-15.88% |
-8.94% |
|
Basic EPS Excl Extraord Items1 |
0.04 |
-50.84% |
0.21 |
739.87% |
-15.88% |
-8.79% |
|
Capital Expenditures2 |
1,127.4 |
-24.66% |
1,127.4 |
-24.66% |
-13.08% |
1.50% |
|
Cash from Operating Activities2 |
2,074.8 |
2.83% |
2,074.8 |
2.83% |
12.67% |
-2.32% |
|
Free Cash Flow |
979.5 |
81.76% |
979.5 |
81.76% |
- |
-5.94% |
|
Total Assets3 |
27,644.4 |
- |
26,924.8 |
-0.79% |
-1.42% |
1.47% |
|
Total Liabilities3 |
20,787.5 |
- |
20,305.2 |
-2.87% |
-0.90% |
1.73% |
|
Total Long Term Debt3 |
7,613.9 |
- |
7,901.8 |
-16.07% |
10.82% |
5.79% |
|
Employees3 |
- |
- |
34772 |
3.40% |
1.09% |
3.65% |
|
Total Common Shares Outstanding3 |
3,001.0 |
- |
3,001.0 |
-0.04% |
-0.02% |
-0.68% |
|
1-ExchangeRate:
JPY to USD Average for Period |
81.605269 |
|
85.691434 |
|
|
|
|
2-ExchangeRate:
JPY to USD Average for Period |
85.691434 |
|
85.691434 |
|
|
|
|
3-ExchangeRate:
JPY to USD Period End Date |
80.760000 |
|
82.880000 |
|
|
|
|
Key
Ratios |
|||||
|
|
31-Mar-2011 |
31-Mar-2010 |
31-Mar-2009 |
31-Mar-2008 |
31-Mar-2007 |
|
Profitability
|
|||||
|
Gross Margin |
15.48% |
11.70% |
13.18% |
17.59% |
19.22% |
|
Operating Margin |
6.57% |
2.98% |
3.85% |
9.49% |
10.51% |
|
Pretax Margin |
4.78% |
0.84% |
1.28% |
7.19% |
9.18% |
|
Net Profit Margin |
2.85% |
0.38% |
-1.44% |
4.17% |
5.74% |
|
Financial
Strength |
|||||
|
Current Ratio |
1.12 |
1.20 |
1.07 |
0.88 |
0.96 |
|
Long Term Debt/Equity |
1.19 |
1.51 |
1.50 |
0.80 |
0.93 |
|
Total Debt/Equity |
1.58 |
1.85 |
2.05 |
1.37 |
1.25 |
|
Management
Effectiveness |
|||||
|
Return on Assets |
3.10% |
0.58% |
-1.39% |
4.09% |
5.28% |
|
Return on Equity |
9.94% |
1.27% |
-5.83% |
14.92% |
19.55% |
|
Efficiency
|
|||||
|
Receivables Turnover |
6.35 |
5.91 |
6.58 |
6.00 |
5.89 |
|
Inventory Turnover |
4.20 |
3.56 |
4.34 |
4.52 |
4.60 |
|
Asset Turnover |
0.83 |
0.74 |
0.94 |
0.93 |
0.89 |
|
Market
Valuation USD (mil) |
||||
|
P/E (TTM) |
9.20 |
. |
Enterprise Value2 |
14,286.4 |
|
Price/Sales (TTM) |
0.22 |
. |
Enterprise Value/Revenue (TTM) |
0.62 |
|
Price/Book (MRQ) |
0.71 |
. |
Enterprise Value/EBITDA (TTM) |
5.22 |
|
Market Cap as of 30-Sep-20111 |
5,294.1 |
. |
|
|
|
1-ExchangeRate:
JPY to USD on 30-Sep-2011 |
77.080000 |
|
|
|
|
2-ExchangeRate:
JPY to USD on 30-Jun-2011 |
80.760000 |
|
|
|
Ratio Comparisons
|
Traded: Over The
Counter: KBSTY |
Financials in:
USD (actual units) |
|
Industry: Iron & Steel |
As of
30-Sep-2011 |
|
Sector: Basic Materials |
|
|
|||||||||||||||||||||||||||||||||||||||||||||||||||||||||||||||||||||||||||||||||||||||||||||||||||||||||||||||||||||||||||||||||||||||||||||||||||||||||||||||||||||||||||||||||||||||||||||||||||||||||||||||||||||||||||||||||||||||||||||||||||||||||||||||||||||||||||||||||||||||||||||||||||||||||||||||||||||||
Annual Ratios
Financials in: USD (mil)
Except for share items (millions) and per share items
(actual units)
|
|||||||||||||||||||||||||||||||||||||||||||||||||||||||||||||||||||||||||||||||||||||||||||||||||||||||||||||||||||||||||||||||||||||||||||||||||||||||||||||||||||||||||||||||||||||||||||||||||||||||||||||||||||||||||||||||||||||||||||||||||||||||||||||||||||
|
|||||||||||||||||||||||||||||||||||||||||||||||||||||||||||||||||||||||||||||||||||||||||||||||||||||||||||||||||||||||||||||||||||||||||||||||||||||||||||||||||||||||||||||||||||||||||||||||||||||||||||||||||||||||||||||||||||||||||||||||||||||||||||||||||||
Stock report
|
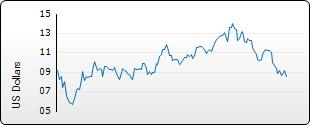
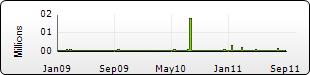
|
|
||||||||||||||||||||||||||||||||||||||||||||||||||||||||||||||||||||||||||||||||||||||||||||||||||||||||||
|
||||||||||||||||||||||||||||||||||||||||||||||||||||||||||||||||||||||||||||||||||||||||||||||||||||||||||
|
||||||||||||||||||||||||||||||||||||||||||||||||||||||||||||||||||||||||||||||||||||||||||||||||||||||||||
Annual Income Statement
Standardized
Financials in: USD (mil)
Except for share items (millions) and per share items
(actual units)
|
|
31-Mar-2011 |
31-Mar-2010 |
31-Mar-2009 |
31-Mar-2008 |
31-Mar-2007 |
|
Period Length |
12 Months |
12 Months |
12 Months |
12 Months |
12 Months |
|
UpdateType/Date |
Updated Normal |
Updated Normal |
Updated Normal |
Updated Normal |
Updated Normal |
|
Filed Currency |
JPY |
JPY |
JPY |
JPY |
JPY |
|
Exchange Rate (Period Average) |
85.691434 |
92.941082 |
100.484331 |
114.302336 |
116.944303 |
|
Auditor |
KPMG LLP |
KPMG LLP |
KPMG LLP |
KPMG LLP |
Azsa Audit Corp. |
|
Auditor Opinion |
Unqualified |
Unqualified |
Unqualified with Explanation |
Unqualified |
Unqualified with Explanation |
|
|
|
|
|
|
|
|
Net
Sales |
21,689.1 |
17,979.4 |
21,667.9 |
18,655.8 |
16,335.1 |
|
Revenue |
21,689.1 |
17,979.4 |
21,667.9 |
18,655.8 |
16,335.1 |
|
Total Revenue |
21,689.1 |
17,979.4 |
21,667.9 |
18,655.8 |
16,335.1 |
|
|
|
|
|
|
|
|
Cost
of Revenue |
18,330.6 |
15,875.2 |
18,812.1 |
15,374.5 |
13,195.7 |
|
Cost of
Revenue, Total |
18,330.6 |
15,875.2 |
18,812.1 |
15,374.5 |
13,195.7 |
|
Gross Profit |
3,358.5 |
2,104.1 |
2,855.9 |
3,281.3 |
3,139.4 |
|
|
|
|
|
|
|
|
Selling/General/Administrative
Expense |
1,318.4 |
1,072.1 |
1,125.6 |
1,006.5 |
900.6 |
|
Labor
& Related Expense |
410.9 |
382.0 |
425.1 |
380.1 |
340.7 |
|
Total
Selling/General/Administrative Expenses |
1,729.3 |
1,454.2 |
1,550.8 |
1,386.6 |
1,241.3 |
|
Research &
Development |
124.4 |
112.3 |
106.5 |
95.7 |
87.6 |
|
Depreciation |
51.3 |
42.5 |
34.9 |
28.2 |
26.6 |
|
Depreciation/Amortization |
51.3 |
42.5 |
34.9 |
28.2 |
26.6 |
|
Impairment-Assets
Held for Use |
0.0 |
38.5 |
157.7 |
0.0 |
40.8 |
|
Impairment-Assets
Held for Sale |
- |
0.0 |
171.4 |
0.0 |
- |
|
Other
Unusual Expense (Income) |
27.8 |
-79.8 |
0.0 |
0.0 |
26.7 |
|
Unusual Expense
(Income) |
27.8 |
-41.3 |
329.1 |
0.0 |
67.6 |
|
Total Operating
Expense |
20,263.4 |
17,442.9 |
20,833.4 |
16,885.1 |
14,618.7 |
|
|
|
|
|
|
|
|
Operating
Income |
1,425.7 |
536.5 |
834.6 |
1,770.7 |
1,716.4 |
|
|
|
|
|
|
|
|
Interest
Expense - Non-Operating |
-241.4 |
-229.4 |
-199.1 |
-183.1 |
-176.1 |
|
Interest
Expense, Net Non-Operating |
-241.4 |
-229.4 |
-199.1 |
-183.1 |
-176.1 |
|
Interest
Income - Non-Operating |
36.5 |
25.0 |
22.2 |
18.9 |
16.8 |
|
Investment
Income - Non-Operating |
88.9 |
40.9 |
115.0 |
156.4 |
147.3 |
|
Interest/Investment
Income - Non-Operating |
125.4 |
65.9 |
137.2 |
175.3 |
164.0 |
|
Interest Income
(Expense) - Net Non-Operating Total |
-116.0 |
-163.5 |
-61.8 |
-7.8 |
-12.1 |
|
Gain (Loss) on
Sale of Assets |
- |
- |
0.0 |
-58.4 |
0.0 |
|
Other
Non-Operating Income (Expense) |
-272.7 |
-221.2 |
-496.1 |
-362.7 |
-204.7 |
|
Other, Net |
-272.7 |
-221.2 |
-496.1 |
-362.7 |
-204.7 |
|
Income Before
Tax |
1,037.1 |
151.7 |
276.7 |
1,341.8 |
1,499.7 |
|
|
|
|
|
|
|
|
Total Income Tax |
226.1 |
10.8 |
595.6 |
523.5 |
524.9 |
|
Income After
Tax |
810.9 |
140.9 |
-319.0 |
818.3 |
974.7 |
|
|
|
|
|
|
|
|
Minority
Interest |
-193.1 |
-73.0 |
6.1 |
-40.3 |
-36.9 |
|
Net Income
Before Extraord Items |
617.8 |
67.9 |
-312.9 |
778.0 |
937.8 |
|
Net Income |
617.8 |
67.9 |
-312.9 |
778.0 |
937.8 |
|
|
|
|
|
|
|
|
Miscellaneous
Earnings Adjustment |
0.0 |
0.0 |
- |
0.0 |
0.0 |
|
Total
Adjustments to Net Income |
0.0 |
0.0 |
- |
0.0 |
0.0 |
|
Income
Available to Common Excl Extraord Items |
617.8 |
67.8 |
-312.9 |
778.0 |
937.8 |
|
|
|
|
|
|
|
|
Income
Available to Common Incl Extraord Items |
617.8 |
67.8 |
-312.9 |
778.0 |
937.8 |
|
|
|
|
|
|
|
|
Basic/Primary
Weighted Average Shares |
3,002.1 |
3,002.5 |
3,002.5 |
3,001.4 |
3,100.7 |
|
Basic EPS Excl
Extraord Items |
0.21 |
0.02 |
-0.10 |
0.26 |
0.30 |
|
Basic/Primary EPS
Incl Extraord Items |
0.21 |
0.02 |
-0.10 |
0.26 |
0.30 |
|
Dilution
Adjustment |
0.0 |
0.0 |
0.0 |
0.0 |
0.0 |
|
Diluted Net Income |
617.8 |
67.8 |
-312.9 |
778.0 |
937.8 |
|
Diluted Weighted
Average Shares |
3,002.1 |
3,002.5 |
3,002.5 |
3,001.4 |
3,100.7 |
|
Diluted EPS Excl
Extraord Items |
0.21 |
0.02 |
-0.10 |
0.26 |
0.30 |
|
Diluted EPS Incl
Extraord Items |
0.21 |
0.02 |
-0.10 |
0.26 |
0.30 |
|
Dividends per
Share - Common Stock Primary Issue |
0.04 |
0.02 |
0.03 |
0.06 |
0.06 |
|
Gross Dividends -
Common Stock |
105.3 |
48.5 |
104.7 |
184.2 |
184.2 |
|
Interest Expense,
Supplemental |
241.4 |
229.4 |
199.1 |
183.1 |
176.1 |
|
Depreciation,
Supplemental |
1,339.9 |
1,278.6 |
1,280.8 |
975.6 |
741.3 |
|
Total Special
Items |
27.8 |
-41.3 |
329.1 |
58.4 |
67.6 |
|
Normalized
Income Before Tax |
1,064.9 |
110.4 |
605.8 |
1,400.2 |
1,567.2 |
|
|
|
|
|
|
|
|
Effect of Special
Items on Income Taxes |
6.1 |
-2.9 |
115.2 |
22.8 |
23.7 |
|
Inc Tax Ex Impact
of Sp Items |
232.2 |
7.9 |
710.8 |
546.3 |
548.6 |
|
Normalized
Income After Tax |
832.7 |
102.5 |
-105.0 |
853.9 |
1,018.6 |
|
|
|
|
|
|
|
|
Normalized Inc.
Avail to Com. |
639.5 |
29.4 |
-98.9 |
813.6 |
981.7 |
|
|
|
|
|
|
|
|
Basic Normalized
EPS |
0.21 |
0.01 |
-0.03 |
0.27 |
0.32 |
|
Diluted Normalized
EPS |
0.21 |
0.01 |
-0.03 |
0.27 |
0.32 |
|
Research &
Development Exp, Supplemental |
472.5 |
416.3 |
415.2 |
359.4 |
87.6 |
|
Reported Operating
Profit |
1,453.5 |
495.1 |
1,163.7 |
1,770.7 |
1,784.0 |
|
Reported Ordinary
Profit |
1,039.6 |
110.4 |
605.8 |
1,381.6 |
1,567.2 |
|
Normalized EBIT |
1,453.5 |
495.1 |
1,163.7 |
1,770.7 |
1,784.0 |
|
Normalized EBITDA |
2,793.4 |
1,773.7 |
2,444.5 |
2,746.3 |
2,525.2 |
|
Interest Cost -
Domestic |
39.2 |
38.6 |
38.7 |
34.1 |
34.8 |
|
Service Cost -
Domestic |
74.5 |
70.6 |
72.3 |
66.1 |
59.3 |
|
Expected Return on
Assets - Domestic |
-3.0 |
-2.7 |
-31.6 |
-23.7 |
-22.4 |
|
Actuarial Gains
and Losses - Domestic |
25.9 |
33.6 |
13.6 |
-17.6 |
-9.1 |
|
Transition Costs -
Domestic |
2.0 |
1.0 |
1.1 |
1.1 |
1.1 |
|
Domestic Pension
Plan Expense |
138.6 |
141.1 |
94.2 |
60.0 |
63.7 |
|
Total Pension
Expense |
138.6 |
141.1 |
94.2 |
60.0 |
63.7 |
|
Discount Rate -
Domestic |
2.00% |
2.00% |
2.00% |
2.00% |
2.00% |
|
Expected Rate of
Return - Domestic |
0.10% |
0.10% |
2.90% |
2.10% |
2.10% |
|
Total Plan
Interest Cost |
39.2 |
38.6 |
38.7 |
34.1 |
34.8 |
|
Total Plan Service
Cost |
74.5 |
70.6 |
72.3 |
66.1 |
59.3 |
|
Total Plan
Expected Return |
-3.0 |
-2.7 |
-31.6 |
-23.7 |
-22.4 |
Interim Income Statement
Standardized
Financials in: USD (mil)
Except for share items (millions) and per share items (actual units) =
|
|
30-Jun-2011 |
31-Mar-2011 |
31-Dec-2010 |
30-Sep-2010 |
30-Jun-2010 |
|
Period Length |
3 Months |
3 Months |
3 Months |
3 Months |
3 Months |
|
UpdateType/Date |
Updated Normal |
Updated Normal |
Updated Normal |
Updated Normal |
Updated Normal |
|
Filed Currency |
JPY |
JPY |
JPY |
JPY |
JPY |
|
Exchange Rate
(Period Average) |
81.605269 |
82.241044 |
82.567473 |
85.838925 |
92.080323 |
|
|
|
|
|
|
|
|
Net Sales |
5,776.7 |
6,113.6 |
5,253.1 |
5,412.8 |
4,967.7 |
|
Revenue |
5,776.7 |
6,113.6 |
5,253.1 |
5,412.8 |
4,967.7 |
|
Total Revenue |
5,776.7 |
6,113.6 |
5,253.1 |
5,412.8 |
4,967.7 |
|
|
|
|
|
|
|
|
Cost of Revenue |
4,932.8 |
5,277.9 |
4,398.9 |
4,697.6 |
4,021.2 |
|
Cost of Revenue, Total |
4,932.8 |
5,277.9 |
4,398.9 |
4,697.6 |
4,021.2 |
|
Gross Profit |
843.9 |
835.6 |
854.2 |
715.2 |
946.5 |
|
|
|
|
|
|
|
|
Selling/General/Administrative Expense |
488.1 |
439.9 |
330.7 |
331.4 |
333.8 |
|
Labor & Related Expense |
- |
104.2 |
151.2 |
112.0 |
107.6 |
|
Total Selling/General/Administrative Expenses |
488.1 |
544.1 |
482.0 |
443.3 |
441.4 |
|
Impairment-Assets Held for Use |
- |
0.0 |
0.0 |
- |
- |
|
Other Unusual Expense (Income) |
0.0 |
0.0 |
- |
- |
25.8 |
|
Unusual Expense (Income) |
0.0 |
0.0 |
0.0 |
- |
25.8 |
|
Total Operating Expense |
5,420.9 |
5,822.1 |
4,880.9 |
5,141.0 |
4,488.4 |
|
|
|
|
|
|
|
|
Operating Income |
355.8 |
291.5 |
372.2 |
271.8 |
479.3 |
|
|
|
|
|
|
|
|
Interest Expense -
Non-Operating |
-61.9 |
-63.6 |
-62.1 |
-61.1 |
-55.2 |
|
Interest Expense, Net Non-Operating |
-61.9 |
-63.6 |
-62.1 |
-61.1 |
-55.2 |
|
Interest Income -
Non-Operating |
10.1 |
13.8 |
9.6 |
8.5 |
5.1 |
|
Investment Income -
Non-Operating |
42.0 |
3.2 |
30.6 |
8.0 |
44.9 |
|
Interest/Investment Income - Non-Operating |
52.1 |
17.0 |
40.3 |
16.6 |
49.9 |
|
Interest Income (Expense) - Net Non-Operating Total |
-9.8 |
-46.5 |
-21.8 |
-44.5 |
-5.3 |
|
Other Non-Operating Income (Expense) |
-52.3 |
-121.5 |
7.7 |
-95.5 |
-63.1 |
|
Other, Net |
-52.3 |
-121.5 |
7.7 |
-95.5 |
-63.1 |
|
Income Before Tax |
293.7 |
123.5 |
358.1 |
131.8 |
410.9 |
|
|
|
|
|
|
|
|
Total Income Tax |
101.7 |
11.2 |
107.3 |
-33.0 |
135.0 |
|
Income After Tax |
192.0 |
112.3 |
250.8 |
164.8 |
275.9 |
|
|
|
|
|
|
|
|
Minority Interest |
-71.5 |
-42.8 |
-35.5 |
-54.9 |
-58.5 |
|
Net Income Before Extraord Items |
120.6 |
69.5 |
215.2 |
109.9 |
217.4 |
|
Net Income |
120.6 |
69.5 |
215.2 |
109.9 |
217.4 |
|
|
|
|
|
|
|
|
Miscellaneous Earnings Adjustment |
0.0 |
0.0 |
- |
0.0 |
0.0 |
|
Total Adjustments to Net Income |
0.0 |
0.0 |
- |
0.0 |
0.0 |
|
Income Available to Common Excl Extraord Items |
120.5 |
69.5 |
215.2 |
109.9 |
217.4 |
|
|
|
|
|
|
|
|
Income Available to Common Incl Extraord Items |
120.5 |
69.5 |
215.2 |
109.9 |
217.4 |
|
|
|
|
|
|
|
|
Basic/Primary Weighted Average Shares |
3,001.0 |
3,001.5 |
3,002.3 |
3,002.3 |
3,002.4 |
|
Basic EPS Excl Extraord Items |
0.04 |
0.02 |
0.07 |
0.04 |
0.07 |
|
Basic/Primary EPS Incl Extraord Items |
0.04 |
0.02 |
0.07 |
0.04 |
0.07 |
|
Dilution Adjustment |
0.0 |
0.0 |
0.0 |
0.0 |
0.0 |
|
Diluted Net Income |
120.5 |
69.5 |
215.2 |
109.9 |
217.4 |
|
Diluted Weighted Average Shares |
3,001.0 |
3,001.5 |
3,002.3 |
3,002.3 |
3,002.4 |
|
Diluted EPS Excl Extraord Items |
0.04 |
0.02 |
0.07 |
0.04 |
0.07 |
|
Diluted EPS Incl Extraord Items |
0.04 |
0.02 |
0.07 |
0.04 |
0.07 |
|
Dividends per Share - Common Stock Primary Issue |
0.00 |
0.02 |
0.00 |
0.02 |
0.00 |
|
Gross Dividends - Common Stock |
0.0 |
54.8 |
0.0 |
52.6 |
0.0 |
|
Interest Expense, Supplemental |
61.9 |
63.6 |
62.1 |
61.1 |
55.2 |
|
Depreciation, Supplemental |
330.6 |
362.4 |
349.3 |
331.6 |
300.9 |
|
Total Special Items |
0.0 |
0.0 |
0.0 |
- |
25.8 |
|
Normalized Income Before Tax |
293.7 |
123.5 |
358.1 |
131.8 |
436.8 |
|
|
|
|
|
|
|
|
Effect of Special Items on Income Taxes |
0.0 |
0.0 |
0.0 |
- |
8.5 |
|
Inc Tax Ex Impact of Sp Items |
101.7 |
11.2 |
107.3 |
-33.0 |
143.5 |
|
Normalized Income After Tax |
192.0 |
112.3 |
250.8 |
164.8 |
293.3 |
|
|
|
|
|
|
|
|
Normalized Inc. Avail to Com. |
120.5 |
69.5 |
215.2 |
109.9 |
234.8 |
|
|
|
|
|
|
|
|
Basic Normalized EPS |
0.04 |
0.02 |
0.07 |
0.04 |
0.08 |
|
Diluted Normalized EPS |
0.04 |
0.02 |
0.07 |
0.04 |
0.08 |
|
Research & Development Exp, Supplemental |
84.6 |
- |
- |
- |
- |
|
Reported Operating Profit |
355.8 |
291.5 |
372.2 |
271.8 |
505.1 |
|
Reported Ordinary Profit |
293.7 |
123.9 |
358.1 |
131.3 |
413.2 |
|
Normalized EBIT |
355.8 |
291.5 |
372.2 |
271.8 |
505.1 |
|
Normalized EBITDA |
686.4 |
653.9 |
721.6 |
603.4 |
806.0 |
Annual Balance Sheet
Standardized
Financials in: USD (mil)
Except for share items (millions) and per share items (actual units)
|
|
31-Mar-2011 |
31-Mar-2010 |
31-Mar-2009 |
31-Mar-2008 |
31-Mar-2007 |
|
UpdateType/Date |
Updated Normal |
Updated Normal |
Updated Normal |
Updated Normal |
Updated Normal |
|
Filed Currency |
JPY |
JPY |
JPY |
JPY |
JPY |
|
Exchange Rate |
82.88 |
93.44 |
98.77 |
99.535 |
118.075 |
|
Auditor |
KPMG LLP |
KPMG LLP |
KPMG LLP |
KPMG LLP |
Azsa Audit Corp. |
|
Auditor Opinion |
Unqualified |
Unqualified |
Unqualified with
Explanation |
Unqualified |
Unqualified with
Explanation |
|
|
|
|
|
|
|
|
Cash & Equivalents |
1,760.1 |
1,412.0 |
1,906.7 |
690.6 |
844.1 |
|
Cash and Short Term Investments |
1,760.1 |
1,412.0 |
1,906.7 |
690.6 |
844.1 |
|
Accounts Receivable -
Trade, Gross |
3,654.0 |
3,035.3 |
2,873.2 |
3,818.2 |
2,813.5 |
|
Provision for Doubtful
Accounts |
-6.9 |
-8.8 |
-6.8 |
-9.9 |
-7.0 |
|
Trade Accounts Receivable - Net |
3,647.1 |
3,026.6 |
2,866.4 |
3,808.3 |
2,806.5 |
|
Total Receivables, Net |
3,647.1 |
3,026.6 |
2,866.4 |
3,808.3 |
2,806.5 |
|
Inventories - Finished Goods |
1,582.3 |
1,357.1 |
1,640.2 |
1,356.7 |
- |
|
Inventories - Work In Progress |
1,538.5 |
1,477.6 |
1,651.8 |
1,556.4 |
- |
|
Inventories - Raw Materials |
1,480.4 |
1,093.5 |
1,389.0 |
1,200.2 |
- |
|
Total Inventory |
4,601.2 |
3,928.3 |
4,681.0 |
4,113.4 |
3,111.0 |
|
Deferred Income Tax - Current Asset |
260.4 |
344.5 |
101.4 |
226.2 |
175.3 |
|
Other Current Assets |
1,757.7 |
1,697.5 |
980.5 |
777.1 |
545.5 |
|
Other Current Assets, Total |
2,018.1 |
2,042.0 |
1,081.8 |
1,003.3 |
720.8 |
|
Total Current Assets |
12,026.5 |
10,408.9 |
10,535.9 |
9,615.5 |
7,482.3 |
|
|
|
|
|
|
|
|
Property/Plant/Equipment - Net |
11,261.3 |
10,360.3 |
9,826.2 |
10,320.1 |
8,509.6 |
|
Goodwill, Net |
- |
- |
0.0 |
5.5 |
0.0 |
|
Intangibles, Net |
268.2 |
228.9 |
207.3 |
175.5 |
142.2 |
|
LT Investment - Affiliate Companies |
800.6 |
551.3 |
- |
- |
- |
|
LT Investments - Other |
1,705.1 |
1,562.2 |
1,679.2 |
2,334.6 |
2,088.6 |
|
Long Term Investments |
2,505.7 |
2,113.6 |
1,679.2 |
2,334.6 |
2,088.6 |
|
Note Receivable - Long Term |
78.9 |
96.5 |
68.2 |
71.5 |
53.7 |
|
Deferred Income Tax - Long Term Asset |
211.0 |
176.2 |
216.7 |
230.4 |
178.6 |
|
Other Long Term Assets |
573.2 |
688.2 |
707.2 |
645.7 |
529.3 |
|
Other Long Term Assets, Total |
784.2 |
864.4 |
923.9 |
876.1 |
707.9 |
|
Total Assets |
26,924.8 |
24,072.5 |
23,240.7 |
23,398.8 |
18,984.2 |
|
|
|
|
|
|
|
|
Accounts Payable |
5,775.5 |
4,653.5 |
4,856.2 |
4,905.3 |
4,175.0 |
|
Accrued Expenses |
242.2 |
176.6 |
215.7 |
0.0 |
- |
|
Notes Payable/Short Term Debt |
970.6 |
1,160.9 |
1,774.9 |
2,037.3 |
746.2 |
|
Current Portion - Long Term Debt/Capital Leases |
1,598.1 |
703.8 |
910.4 |
1,400.3 |
893.1 |
|
Income Taxes Payable |
109.3 |
69.8 |
52.2 |
268.9 |
183.6 |
|
Other Payables |
542.7 |
532.2 |
504.1 |
599.4 |
432.3 |
|
Deferred Income Tax - Current Liability |
27.5 |
22.0 |
15.6 |
31.4 |
28.8 |
|
Other Current Liabilities |
1,453.0 |
1,330.3 |
1,538.6 |
1,678.9 |
1,336.5 |
|
Other Current liabilities, Total |
2,132.5 |
1,954.2 |
2,110.5 |
2,578.6 |
1,981.1 |
|
Total Current Liabilities |
10,718.8 |
8,649.0 |
9,867.7 |
10,921.5 |
7,795.4 |
|
|
|
|
|
|
|
|
Long Term Debt |
7,462.0 |
7,901.9 |
6,999.9 |
4,834.9 |
4,645.6 |
|
Capital Lease Obligations |
439.8 |
449.2 |
256.9 |
0.0 |
- |
|
Total Long Term Debt |
7,901.8 |
8,351.1 |
7,256.8 |
4,834.9 |
4,645.6 |
|
Total Debt |
10,470.5 |
10,215.8 |
9,942.1 |
8,272.5 |
6,284.8 |
|
|
|
|
|
|
|
|
Deferred Income Tax - LT Liability |
252.9 |
314.9 |
119.1 |
222.7 |
358.0 |
|
Deferred Income Tax |
252.9 |
314.9 |
119.1 |
222.7 |
358.0 |
|
Minority Interest |
588.0 |
431.6 |
347.5 |
480.7 |
375.6 |
|
Reserves |
30.1 |
29.8 |
42.5 |
44.4 |
36.0 |
|
Pension Benefits - Underfunded |
354.1 |
355.8 |
386.2 |
449.6 |
397.4 |
|
Other Long Term Liabilities |
459.5 |
410.9 |
369.9 |
417.5 |
361.9 |
|
Other Liabilities, Total |
843.7 |
796.4 |
798.6 |
911.5 |
795.3 |
|
Total Liabilities |
20,305.2 |
18,543.1 |
18,389.6 |
17,371.3 |
13,969.8 |
|
|
|
|
|
|
|
|
Common Stock |
2,815.1 |
2,496.9 |
2,362.2 |
2,344.0 |
1,976.0 |
|
Common Stock |
2,815.1 |
2,496.9 |
2,362.2 |
2,344.0 |
1,976.0 |
|
Additional Paid-In Capital |
1,003.0 |
889.6 |
841.6 |
836.5 |
705.3 |
|
Retained Earnings (Accumulated Deficit) |
3,648.4 |
2,770.3 |
2,556.5 |
3,067.6 |
2,025.7 |
|
Treasury Stock - Common |
-622.9 |
-549.9 |
-520.7 |
-517.5 |
-266.9 |
|
Unrealized Gain (Loss) |
187.9 |
198.5 |
-107.9 |
349.2 |
616.9 |
|
Translation Adjustment |
-411.8 |
-276.0 |
-280.6 |
-52.3 |
-42.5 |
|
Other Equity, Total |
-411.8 |
-276.0 |
-280.6 |
-52.3 |
-42.5 |
|
Total Equity |
6,619.6 |
5,529.4 |
4,851.1 |
6,027.5 |
5,014.5 |
|
|
|
|
|
|
|
|
Total Liabilities & Shareholders’ Equity |
26,924.8 |
24,072.5 |
23,240.7 |
23,398.8 |
18,984.2 |
|
|
|
|
|
|
|
|
Shares Outstanding - Common Stock
Primary Issue |
3,001.0 |
3,002.4 |
3,002.5 |
3,002.6 |
3,044.6 |
|
Total Common Shares Outstanding |
3,001.0 |
3,002.4 |
3,002.5 |
3,002.6 |
3,044.6 |
|
Treasury Shares -
Common Stock Primary Issue |
114.0 |
112.7 |
112.6 |
112.5 |
70.4 |
|
Employees |
34,772 |
33,629 |
33,526 |
33,657 |
31,828 |
|
Number of Common Shareholders |
162,224 |
168,145 |
177,171 |
171,868 |
171,609 |
|
Total Long Term
Debt, Supplemental |
9,427.4 |
8,929.3 |
7,879.7 |
6,235.2 |
5,538.6 |
|
Long Term Debt
Maturing within 1 Year |
1,818.7 |
638.2 |
879.8 |
1,400.3 |
893.1 |
|
Long Term Debt
Maturing in Year 2 |
1,207.4 |
1,372.4 |
783.2 |
855.1 |
1,179.6 |
|
Long Term Debt
Maturing in Year 3 |
2,284.5 |
1,046.1 |
1,266.8 |
669.8 |
717.1 |
|
Long Term Debt
Maturing in Year 4 |
895.8 |
1,940.5 |
826.3 |
714.2 |
548.5 |
|
Long Term Debt
Maturing in Year 5 |
860.7 |
787.3 |
1,709.2 |
648.5 |
594.1 |
|
Long Term Debt
Maturing in 2-3 Years |
3,491.9 |
2,418.5 |
2,049.9 |
1,524.9 |
1,896.7 |
|
Long Term Debt
Maturing in 4-5 Years |
1,756.5 |
2,727.7 |
2,535.4 |
1,362.7 |
1,142.6 |
|
Long Term Debt
Matur. in Year 6 & Beyond |
2,360.3 |
3,144.8 |
2,414.5 |
1,947.2 |
1,606.2 |
|
Total Capital
Leases, Supplemental |
517.0 |
514.7 |
287.5 |
- |
- |
|
Capital Lease
Payments Due in Year 1 |
77.2 |
65.6 |
30.6 |
- |
- |
|
Capital Lease
Payments Due in Year 2 |
106.0 |
66.9 |
31.4 |
- |
- |
|
Capital Lease
Payments Due in Year 3 |
74.9 |
92.7 |
32.2 |
- |
- |
|
Capital Lease
Payments Due in Year 4 |
142.3 |
65.3 |
55.8 |
- |
- |
|
Capital Lease
Payments Due in Year 5 |
106.4 |
125.4 |
134.2 |
- |
- |
|
Capital Lease
Payments Due in 2-3 Years |
180.9 |
159.5 |
63.5 |
- |
- |
|
Capital Lease
Payments Due in 4-5 Years |
248.7 |
190.7 |
190.0 |
- |
- |
|
Cap. Lease Pymts.
Due in Year 6 & Beyond |
10.2 |
98.9 |
3.4 |
- |
- |
|
Pension Obligation
- Domestic |
1,973.8 |
1,867.9 |
1,886.1 |
2,000.9 |
1,756.2 |
|
Plan Assets -
Domestic |
1,723.0 |
1,569.4 |
1,447.6 |
1,768.5 |
1,859.5 |
|
Funded Status -
Domestic |
-250.9 |
-298.5 |
-438.5 |
-232.4 |
103.2 |
|
Total Funded
Status |
-250.9 |
-298.5 |
-438.5 |
-232.4 |
103.2 |
|
Discount Rate -
Domestic |
2.00% |
2.00% |
2.00% |
2.00% |
2.00% |
|
Expected Rate of
Return - Domestic |
0.10% |
0.10% |
2.90% |
2.10% |
2.10% |
|
Prepaid Benefits -
Domestic |
310.7 |
304.4 |
328.5 |
317.3 |
234.9 |
|
Accrued
Liabilities - Domestic |
-354.1 |
-355.8 |
-386.2 |
-449.6 |
-397.4 |
|
Other Assets, Net
- Domestic |
207.5 |
247.1 |
380.8 |
100.1 |
-265.7 |
|
Net Assets
Recognized on Balance Sheet |
164.2 |
195.7 |
323.0 |
-32.2 |
-428.2 |
|
Total Plan
Obligations |
1,973.8 |
1,867.9 |
1,886.1 |
2,000.9 |
1,756.2 |
|
Total Plan Assets |
1,723.0 |
1,569.4 |
1,447.6 |
1,768.5 |
1,859.5 |
Interim Balance Sheet
Standardized
Financials in: USD (mil)
Except for share items (millions) and per share items (actual units)
|
|
30-Jun-2011 |
31-Mar-2011 |
31-Dec-2010 |
30-Sep-2010 |
30-Jun-2010 |
|
UpdateType/Date |
Updated Normal |
Updated Normal |
Updated Normal |
Updated Normal |
Updated Normal |
|
Filed Currency |
JPY |
JPY |
JPY |
JPY |
JPY |
|
Exchange Rate |
80.76 |
82.88 |
81.105 |
83.54 |
88.49 |
|
|
|
|
|
|
|
|
Cash & Equivalents |
1,862.7 |
1,760.1 |
2,161.1 |
2,030.1 |
1,877.6 |
|
Cash and Short Term Investments |
1,862.7 |
1,760.1 |
2,161.1 |
2,030.1 |
1,877.6 |
|
Accounts Receivable -
Trade, Gross |
3,829.3 |
3,654.0 |
3,370.5 |
3,374.8 |
3,140.4 |
|
Provision for Doubtful
Accounts |
-6.2 |
-6.9 |
-9.6 |
-9.2 |
-8.5 |
|
Trade Accounts Receivable - Net |
3,823.1 |
3,647.1 |
3,360.9 |
3,365.5 |
3,131.9 |
|
Total Receivables, Net |
3,823.1 |
3,647.1 |
3,360.9 |
3,365.5 |
3,131.9 |
|
Inventories - Finished Goods |
1,701.2 |
1,582.3 |
1,729.8 |
1,385.4 |
1,371.4 |
|
Inventories - Work In Progress |
1,648.9 |
1,538.5 |
1,838.3 |
1,719.4 |
1,655.5 |
|
Inventories - Raw Materials |
1,666.6 |
1,480.4 |
1,500.4 |
1,416.6 |
1,304.0 |
|
Total Inventory |
5,016.7 |
4,601.2 |
5,068.5 |
4,521.4 |
4,330.9 |
|
Other Current Assets |
1,833.5 |
2,018.1 |
2,708.0 |
2,583.3 |
2,084.1 |
|
Other Current Assets, Total |
1,833.5 |
2,018.1 |
2,708.0 |
2,583.3 |
2,084.1 |
|
Total Current Assets |
12,536.0 |
12,026.5 |
13,298.5 |
12,500.3 |
11,424.5 |
|
|
|
|
|
|
|
|
Property/Plant/Equipment - Net |
11,486.3 |
11,261.3 |
11,503.8 |
11,236.2 |
10,762.7 |
|
Intangibles, Net |
264.5 |
268.2 |
280.4 |
271.2 |
264.5 |
|
LT Investments - Other |
2,264.2 |
2,295.5 |
2,306.9 |
2,106.2 |
2,000.8 |
|
Long Term Investments |
2,264.2 |
2,295.5 |
2,306.9 |
2,106.2 |
2,000.8 |
|
Other Long Term Assets |
1,093.4 |
1,073.2 |
1,105.9 |
1,073.7 |
1,022.8 |
|
Other Long Term Assets, Total |
1,093.4 |
1,073.2 |
1,105.9 |
1,073.7 |
1,022.8 |
|
Total Assets |
27,644.4 |
26,924.8 |
28,495.5 |
27,187.7 |
25,475.4 |
|
|
|
|
|
|
|
|
Accounts Payable |
5,823.3 |
5,775.5 |
6,752.6 |
6,082.3 |
5,174.4 |
|
Notes Payable/Short Term Debt |
2,362.5 |
970.6 |
1,697.5 |
1,687.9 |
1,797.5 |
|
Current Portion - Long Term Debt/Capital Leases |
443.4 |
1,598.1 |
210.0 |
2.8 |
2.7 |
|
Income Taxes Payable |
76.7 |
109.3 |
71.8 |
95.1 |
57.6 |
|
Other Current Liabilities |
2,289.8 |
2,265.3 |
2,137.5 |
2,200.8 |
2,130.2 |
|
Other Current liabilities, Total |
2,366.5 |
2,374.6 |
2,209.3 |
2,295.9 |
2,187.8 |
|
Total Current Liabilities |
10,995.7 |
10,718.8 |
10,869.4 |
10,068.9 |
9,162.4 |
|
|
|
|
|
|
|
|
Long Term Debt |
7,613.9 |
7,462.0 |
8,656.4 |
8,637.6 |
8,315.2 |
|
Capital Lease Obligations |
- |
439.8 |
- |
- |
- |
|
Total Long Term Debt |
7,613.9 |
7,901.8 |
8,656.4 |
8,637.6 |
8,315.2 |
|
Total Debt |
10,419.8 |
10,470.5 |
10,563.9 |
10,328.3 |
10,115.4 |
|
|
|
|
|
|
|
|
Minority Interest |
676.4 |
588.0 |
589.4 |
553.3 |
508.3 |
|
Reserves |
30.6 |
30.1 |
31.3 |
32.0 |
31.6 |
|
Pension Benefits - Underfunded |
366.0 |
354.1 |
397.5 |
377.6 |
382.4 |
|
Other Long Term Liabilities |
1,104.8 |
712.4 |
1,259.1 |
1,202.5 |
1,166.6 |
|
Other Liabilities, Total |
1,501.5 |
1,096.5 |
1,687.9 |
1,612.1 |
1,580.6 |
|
Total Liabilities |
20,787.5 |
20,305.2 |
21,803.1 |
20,871.9 |
19,566.5 |
|
|
|
|
|
|
|
|
Common Stock |
2,889.0 |
2,815.1 |
2,876.7 |
2,792.8 |
2,636.6 |
|
Common Stock |
2,889.0 |
2,815.1 |
2,876.7 |
2,792.8 |
2,636.6 |
|
Additional Paid-In Capital |
1,029.3 |
1,003.0 |
1,024.9 |
995.0 |
939.4 |
|
Retained Earnings (Accumulated Deficit) |
3,810.0 |
3,648.4 |
3,658.1 |
3,396.3 |
3,099.8 |
|
Treasury Stock - Common |
-639.4 |
-622.9 |
-633.6 |
-615.0 |
-580.6 |
|
Unrealized Gain (Loss) |
148.6 |
187.9 |
166.4 |
98.3 |
86.0 |
|
Translation Adjustment |
-380.6 |
-411.8 |
-400.2 |
-351.7 |
-272.3 |
|
Other Equity, Total |
-380.6 |
-411.8 |
-400.2 |
-351.7 |
-272.3 |
|
Total Equity |
6,856.9 |
6,619.6 |
6,692.3 |
6,315.8 |
5,908.8 |
|
|
|
|
|
|
|
|
Total Liabilities & Shareholders’ Equity |
27,644.4 |
26,924.8 |
28,495.5 |
27,187.7 |
25,475.3 |
|
|
|
|
|
|
|
|
Shares Outstanding - Common Stock Primary
Issue |
3,001.0 |
3,001.0 |
3,002.3 |
3,002.3 |
3,002.3 |
|
Total Common Shares Outstanding |
3,001.0 |
3,001.0 |
3,002.3 |
3,002.3 |
3,002.3 |
|
Treasury Shares - Common Stock Primary Issue |
114.1 |
114.0 |
112.8 |
112.7 |
112.7 |
|
Employees |
- |
34,772 |
34,918 |
34,498 |
33,982 |
Annual Cash Flows
Standardized
Financials in: USD (mil)
Except for share items (millions) and per share items (actual units)
|
|
31-Mar-2011 |
31-Mar-2010 |
31-Mar-2009 |
31-Mar-2008 |
31-Mar-2007 |
|
Period Length |
12 Months |
12 Months |
12 Months |
12 Months |
12 Months |
|
UpdateType/Date |
Updated Normal |
Updated Normal |
Updated Normal |
Updated Normal |
Updated Normal |
|
Filed Currency |
JPY |
JPY |
JPY |
JPY |
JPY |
|
Exchange Rate
(Period Average) |
85.691434 |
92.941082 |
100.484331 |
114.302336 |
116.944303 |
|
Auditor |
KPMG LLP |
KPMG LLP |
KPMG LLP |
KPMG LLP |
Azsa Audit Corp. |
|
Auditor Opinion |
Unqualified |
Unqualified |
Unqualified with
Explanation |
Unqualified |
Unqualified with
Explanation |
|
|
|
|
|
|
|
|
Net Income/Starting Line |
1,037.1 |
151.7 |
276.7 |
1,341.8 |
1,499.6 |
|
Depreciation |
1,339.9 |
1,278.6 |
1,280.8 |
975.6 |
741.3 |
|
Depreciation/Depletion |
1,339.9 |
1,278.6 |
1,280.8 |
975.6 |
741.3 |
|
Unusual Items |
47.3 |
69.7 |
344.9 |
62.3 |
53.2 |
|
Equity in Net Earnings (Loss) |
-35.9 |
-19.5 |
-79.0 |
-111.9 |
-120.2 |
|
Other Non-Cash Items |
177.1 |
183.0 |
140.8 |
138.3 |
166.0 |
|
Non-Cash Items |
188.5 |
233.2 |
406.7 |
88.7 |
99.0 |
|
Accounts Receivable |
-458.6 |
-97.7 |
739.7 |
-282.0 |
198.4 |
|
Inventories |
-206.1 |
1,060.5 |
-672.0 |
-350.4 |
-464.0 |
|
Other Assets |
-180.8 |
0.0 |
- |
- |
- |
|
Accounts Payable |
636.7 |
-439.8 |
162.7 |
-137.0 |
339.3 |
|
Other Operating Cash Flow |
-281.9 |
-326.2 |
-1,018.5 |
-549.1 |
-881.7 |
|
Changes in Working Capital |
-490.7 |
196.7 |
-787.9 |
-1,318.5 |
-807.9 |
|
Cash from Operating Activities |
2,074.8 |
1,860.2 |
1,176.3 |
1,087.6 |
1,532.0 |
|
|
|
|
|
|
|
|
Purchase of Fixed Assets |
-1,127.4 |
-1,379.6 |
-1,230.4 |
-1,287.1 |
-1,057.6 |
|
Capital Expenditures |
-1,127.4 |
-1,379.6 |
-1,230.4 |
-1,287.1 |
-1,057.6 |
|
Sale of Fixed Assets |
20.6 |
55.3 |
23.5 |
67.9 |
12.8 |
|
Sale/Maturity of Investment |
44.5 |
16.1 |
52.2 |
132.9 |
52.9 |
|
Purchase of Investments |
-64.1 |
-19.0 |
-135.8 |
-550.7 |
-85.7 |
|
Other Investing Cash Flow |
-1.8 |
32.6 |
22.6 |
-2.3 |
-21.7 |
|
Other Investing Cash Flow Items, Total |
-0.9 |
85.0 |
-37.5 |
-352.2 |
-41.7 |
|
Cash from Investing Activities |
-1,128.3 |
-1,294.6 |
-1,267.9 |
-1,639.3 |
-1,099.3 |
|
|
|
|
|
|
|
|
Other Financing Cash Flow |
-60.6 |
-38.4 |
-29.6 |
-52.6 |
-91.5 |
|
Financing Cash Flow Items |
-60.6 |
-38.4 |
-29.6 |
-52.6 |
-91.5 |
|
Cash Dividends Paid - Common |
-104.6 |
-0.8 |
-208.6 |
-197.8 |
-237.4 |
|
Total Cash Dividends Paid |
-104.6 |
-0.8 |
-208.6 |
-197.8 |
-237.4 |
|
Repurchase/Retirement
of Common |
- |
- |
0.0 |
-177.8 |
-258.8 |
|
Common Stock, Net |
- |
- |
0.0 |
-177.8 |
-258.8 |
|
Issuance (Retirement) of Stock, Net |
- |
- |
0.0 |
-177.8 |
-258.8 |
|
Short Term Debt, Net |
-298.9 |
-695.8 |
-210.4 |
996.9 |
-282.3 |
|
Long Term Debt Issued |
114.4 |
1,612.4 |
3,095.3 |
652.1 |
1,552.3 |
|
Long Term Debt
Reduction |
-796.1 |
-1,196.3 |
-1,266.4 |
-948.2 |
-1,099.8 |
|
Long Term Debt, Net |
-681.7 |
416.1 |
1,828.9 |
-296.1 |
452.4 |
|
Issuance (Retirement) of Debt, Net |
-980.6 |
-279.7 |
1,618.5 |
700.8 |
170.2 |
|
Cash from Financing Activities |
-1,145.9 |
-318.9 |
1,380.3 |
272.6 |
-417.5 |
|
|
|
|
|
|
|
|
Foreign Exchange Effects |
-57.2 |
6.8 |
-83.9 |
3.8 |
7.6 |
|
Net Change in Cash |
-256.6 |
253.5 |
1,204.8 |
-275.4 |
22.9 |
|
|
|
|
|
|
|
|
Net Cash - Beginning Balance |
2,470.5 |
2,024.3 |
663.6 |
858.8 |
816.5 |
|
Net Cash - Ending Balance |
2,213.8 |
2,277.8 |
1,868.4 |
583.4 |
839.4 |
|
Cash Interest Paid |
241.5 |
229.8 |
192.3 |
183.4 |
174.2 |
|
Cash Taxes Paid |
81.8 |
162.3 |
572.4 |
440.5 |
727.0 |
Interim Cash Flows
Standardized
Financials in: USD (mil)
Except for share items (millions) and per share items (actual units)
|
|
31-Mar-2011 |
31-Dec-2010 |
30-Sep-2010 |
30-Jun-2010 |
31-Mar-2010 |
|
Period Length |
12 Months |
9 Months |
6 Months |
3 Months |
12 Months |
|
UpdateType/Date |
Updated Normal |
Updated Normal |
Updated Normal |
Updated Normal |
Updated Normal |
|
Filed Currency |
JPY |
JPY |
JPY |
JPY |
JPY |
|
Exchange Rate
(Period Average) |
85.691434 |
86.812446 |
88.962162 |
92.080323 |
92.941082 |
|
|
|
|
|
|
|
|
Net Income/Starting Line |
1,037.1 |
906.7 |
552.5 |
410.9 |
151.7 |
|
Depreciation |
1,339.9 |
979.3 |
631.4 |
300.9 |
1,278.6 |
|
Depreciation/Depletion |
1,339.9 |
979.3 |
631.4 |
300.9 |
1,278.6 |
|
Unusual Items |
47.3 |
10.5 |
29.8 |
3.3 |
69.7 |
|
Equity in Net Earnings (Loss) |
-35.9 |
-33.7 |
-14.4 |
-7.5 |
-19.5 |
|
Other Non-Cash Items |
177.1 |
129.4 |
87.6 |
36.3 |
183.0 |
|
Non-Cash Items |
188.5 |
106.2 |
103.0 |
32.1 |
233.2 |
|
Accounts Receivable |
-458.6 |
51.3 |
27.4 |
93.3 |
-97.7 |
|
Inventories |
-206.1 |
-542.4 |
-138.6 |
-168.2 |
1,060.5 |
|
Other Assets |
-180.8 |
- |
- |
- |
0.0 |
|
Accounts Payable |
636.7 |
1,414.9 |
889.4 |
234.1 |
-439.8 |
|
Other Operating Cash Flow |
-281.9 |
-571.2 |
-367.5 |
-150.2 |
-326.2 |
|
Changes in Working Capital |
-490.7 |
352.6 |
410.7 |
9.0 |
196.7 |
|
Cash from Operating Activities |
2,074.8 |
2,344.8 |
1,697.5 |
752.9 |
1,860.2 |
|
|
|
|
|
|
|
|
Purchase of Fixed Assets |
-1,127.4 |
-794.1 |
-441.8 |
-215.1 |
-1,379.6 |
|
Capital Expenditures |
-1,127.4 |
-794.1 |
-441.8 |
-215.1 |
-1,379.6 |
|
Sale of Fixed Assets |
20.6 |
6.3 |
6.6 |
4.3 |
55.3 |
|
Sale/Maturity of Investment |
44.5 |
35.3 |
37.7 |
35.7 |
16.1 |
|
Purchase of Investments |
-64.1 |
-45.5 |
-19.0 |
-9.5 |
-19.0 |
|
Other Investing Cash Flow |
-1.8 |
-36.3 |
-3.0 |
-2.7 |
32.6 |
|
Other Investing Cash Flow Items, Total |
-0.9 |
-40.2 |
22.4 |
27.8 |
85.0 |
|
Cash from Investing Activities |
-1,128.3 |
-834.4 |
-419.5 |
-187.3 |
-1,294.6 |
|
|
|
|
|
|
|
|
Other Financing Cash Flow |
-60.6 |
-57.6 |
-48.7 |
-12.8 |
-38.4 |
|
Financing Cash Flow Items |
-60.6 |
-57.6 |
-48.7 |
-12.8 |
-38.4 |
|
Cash Dividends Paid - Common |
-104.6 |
-99.4 |
-50.8 |
-44.1 |
-0.8 |
|
Total Cash Dividends Paid |
-104.6 |
-99.4 |
-50.8 |
-44.1 |
-0.8 |
|
Short Term Debt, Net |
-298.9 |
-356.0 |
-316.7 |
-120.7 |
-695.8 |
|
Long Term Debt Issued |
114.4 |
102.2 |
86.6 |
27.1 |
1,612.4 |
|
Long Term Debt
Reduction |
-796.1 |
-332.9 |
-276.7 |
-52.5 |
-1,196.3 |
|
Long Term Debt, Net |
-681.7 |
-230.7 |
-190.1 |
-25.4 |
416.1 |
|
Issuance (Retirement) of Debt, Net |
-980.6 |
-586.6 |
-506.8 |
-146.2 |
-279.7 |
|
Cash from Financing Activities |
-1,145.9 |
-743.6 |
-606.3 |
-203.1 |
-318.9 |
|
|
|
|
|
|
|
|
Foreign Exchange Effects |
-57.2 |
-37.4 |
-23.3 |
9.1 |
6.8 |
|
Net Change in Cash |
-256.6 |
729.5 |
648.3 |
371.6 |
253.5 |
|
|
|
|
|
|
|
|
Net Cash - Beginning Balance |
2,470.5 |
2,438.6 |
2,379.7 |
2,299.1 |
2,024.3 |
|
Net Cash - Ending Balance |
2,213.8 |
3,168.0 |
3,028.0 |
2,670.7 |
2,277.8 |
|
Cash Interest Paid |
241.5 |
166.2 |
115.8 |
42.9 |
229.8 |
|
Cash Taxes Paid |
81.8 |
49.1 |
-14.1 |
74.8 |
162.3 |
Annual Income Statement
As Reported
Financials in: USD (mil)
Except for share items (millions) and per share items (actual units)
|
|
31-Mar-2011 |
31-Mar-2010 |
31-Mar-2009 |
31-Mar-2008 |
31-Mar-2007 |
|
Period Length |
12 Months |
12 Months |
12 Months |
12 Months |
12 Months |
|
UpdateType/Date |
Updated Normal |
Updated Normal |
Updated Normal |
Updated Normal |
Updated Normal |
|
Filed Currency |
JPY |
JPY |
JPY |
JPY |
JPY |
|
Exchange Rate
(Period Average) |
85.691434 |
92.941082 |
100.484331 |
114.302336 |
116.944303 |
|
Auditor |
KPMG LLP |
KPMG LLP |
KPMG LLP |
KPMG LLP |
Azsa Audit Corp. |
|
Auditor Opinion |
Unqualified |
Unqualified |
Unqualified with
Explanation |
Unqualified |
Unqualified with
Explanation |
|
|
|
|
|
|
|
|
Net Sales |
21,689.1 |
17,979.4 |
21,667.9 |
18,655.8 |
16,335.1 |
|
Total Revenue |
21,689.1 |
17,979.4 |
21,667.9 |
18,655.8 |
16,335.1 |
|
|
|
|
|
|
|
|
Cost of sales |
18,330.6 |
15,875.2 |
18,812.1 |
15,374.5 |
13,195.7 |
|
Shipping Expense |
478.2 |
379.0 |
432.7 |
413.2 |
372.8 |
|
Salary Expense |
387.2 |
360.5 |
406.4 |
365.4 |
326.8 |
|
R and D Expense |
124.4 |
112.3 |
106.5 |
95.7 |
87.6 |
|
Provision for Bonus |
49.1 |
37.7 |
41.0 |
- |
- |
|
Provision for doubtful accounts(SGA) |
7.4 |
7.9 |
4.7 |
11.9 |
1.9 |
|
Periodic retirement benefit costs |
23.7 |
21.6 |
18.7 |
14.7 |
13.9 |
|
Depreciation |
51.3 |
42.5 |
34.9 |
28.2 |
26.6 |
|
Other SG&A |
783.8 |
647.6 |
647.3 |
581.4 |
525.8 |
|
SP G Compensation for transfer |
0.0 |
-79.8 |
0.0 |
- |
- |
|
SP Valuation Loss-Invest.Sec |
- |
0.0 |
171.4 |
0.0 |
- |
|
SP L-adjustment for changes of accoun |
27.8 |
0.0 |
- |
- |
- |
|
SP Impairment Loss |
0.0 |
38.5 |
157.7 |
0.0 |
40.8 |
|
SP Real Estate Allotment Loss |
- |
- |
- |
- |
0.0 |
|
SP Environmental Expenses |
- |
- |
- |
0.0 |
26.7 |
|
SP Loss by Disaster |
- |
- |
- |
- |
0.0 |
|
Total Operating Expense |
20,263.4 |
17,442.9 |
20,833.4 |
16,885.1 |
14,618.7 |
|
|
|
|
|
|
|
|
SP Sale Gain-Invest.Sec |
25.3 |
0.0 |
0.0 |
18.6 |
0.0 |
|
SP L on Business Liquidated |
- |
- |
0.0 |
-58.4 |
0.0 |
|
NOP Interest Income |
36.5 |
25.0 |
22.2 |
18.9 |
16.8 |
|
NOP Dividend Income |
27.7 |
21.5 |
36.1 |
25.8 |
27.1 |
|
NOP Allotted Money-Ope. |
77.2 |
75.2 |
83.7 |
85.6 |
106.2 |
|
NOP Gain-Equity Method |
35.9 |
19.5 |
79.0 |
111.9 |
120.2 |
|
NOP Other Non-op. Income |
217.2 |
197.3 |
142.7 |
130.1 |
181.6 |
|
NOP Interest Expense |
-241.4 |
-229.4 |
-199.1 |
-183.1 |
-176.1 |
|
NOP Labor Fee-Transfer |
-199.4 |
-200.3 |
-224.5 |
-217.3 |
-261.4 |
|
NOP Other Non-op.Expense |
-367.7 |
-293.4 |
-498.0 |
-361.0 |
-231.0 |
|
Net Income Before Taxes |
1,037.1 |
151.7 |
276.7 |
1,341.8 |
1,499.7 |
|
|
|
|
|
|
|
|
Provision for Income Taxes |
226.1 |
10.8 |
595.6 |
523.5 |
524.9 |
|
Net Income After Taxes |
810.9 |
140.9 |
-319.0 |
818.3 |
974.7 |
|
|
|
|
|
|
|
|
Minority Interest |
-193.1 |
-73.0 |
6.1 |
-40.3 |
-36.9 |
|
Net Income Before Extra. Items |
617.8 |
67.9 |
-312.9 |
778.0 |
937.8 |
|
Net Income |
617.8 |
67.9 |
-312.9 |
778.0 |
937.8 |
|
|
|
|
|
|
|
|
Directors' Bonuses |
- |
- |
- |
- |
0.0 |
|
Rounding Adjustment |
0.0 |
0.0 |
- |
0.0 |
0.0 |
|
Income Available to Com Excl ExtraOrd |
617.8 |
67.8 |
-312.9 |
778.0 |
937.8 |
|
|
|
|
|
|
|
|
Income Available to Com Incl ExtraOrd |
617.8 |
67.8 |
-312.9 |
778.0 |
937.8 |
|
|
|
|
|
|
|
|
Basic Weighted Average Shares |
3,002.1 |
3,002.5 |
3,002.5 |
3,001.4 |
3,100.7 |
|
Basic EPS Excluding ExtraOrdinary Items |
0.21 |
0.02 |
-0.10 |
0.26 |
0.30 |
|
Basic EPS Including ExtraOrdinary Item |
0.21 |
0.02 |
-0.10 |
0.26 |
0.30 |
|
Dilution Adjustment |
0.0 |
0.0 |
0.0 |
0.0 |
0.0 |
|
Diluted Net Income |
617.8 |
67.8 |
-312.9 |
778.0 |
937.8 |
|
Diluted Weighted Average Shares |
3,002.1 |
3,002.5 |
3,002.5 |
3,001.4 |
3,100.7 |
|
Diluted EPS Excluding ExtraOrd Items |
0.21 |
0.02 |
-0.10 |
0.26 |
0.30 |
|
Diluted EPS Including ExtraOrd Items |
0.21 |
0.02 |
-0.10 |
0.26 |
0.30 |
|
DPS-Common Stock |
0.04 |
0.02 |
0.03 |
0.06 |
0.06 |
|
Gross Dividends - Common Stock |
105.3 |
48.5 |
104.7 |
184.2 |
184.2 |
|
Normalized Income Before Taxes |
1,064.9 |
110.4 |
605.8 |
1,400.2 |
1,567.2 |
|
|
|
|
|
|
|
|
Inc Tax Ex Impact of Sp Items |
232.2 |
7.9 |
710.8 |
546.3 |
548.6 |
|
Normalized Income After Taxes |
832.7 |
102.5 |
-105.0 |
853.9 |
1,018.6 |
|
|
|
|
|
|
|
|
Normalized Inc. Avail to Com. |
639.5 |
29.4 |
-98.9 |
813.6 |
981.7 |
|
|
|
|
|
|
|
|
Basic Normalized EPS |
0.21 |
0.01 |
-0.03 |
0.27 |
0.32 |
|
Diluted Normalized EPS |
0.21 |
0.01 |
-0.03 |
0.27 |
0.32 |
|
Research & Development Exp (SGA) |
124.4 |
112.3 |
106.5 |
95.7 |
87.6 |
|
R & D Expense (COGS+SGA) |
348.1 |
304.0 |
308.8 |
263.7 |
- |
|
Interest Expense |
241.4 |
229.4 |
199.1 |
183.1 |
176.1 |
|
Depreciation |
1,339.9 |
1,278.6 |
1,280.8 |
975.6 |
741.3 |
|
Reported Operating profit |
1,453.5 |
495.1 |
1,163.7 |
1,770.7 |
1,784.0 |
|
Reported Ordinary profit |
1,039.6 |
110.4 |
605.8 |
1,381.6 |
1,567.2 |
|
Service Cost |
74.5 |
70.6 |
72.3 |
66.1 |
59.3 |
|
Interest Cost |
39.2 |
38.6 |
38.7 |
34.1 |
34.8 |
|
Expected Return on Plan Assets |
-3.0 |
-2.7 |
-31.6 |
-23.7 |
-22.4 |
|
Pension Exp. due to Acct. Changes |
2.0 |
1.0 |
1.1 |
1.1 |
1.1 |
|
Actuarial Gains and Losses |
25.9 |
33.6 |
13.6 |
-17.6 |
-9.1 |
|
Domestic Pension Plan Expense |
138.6 |
141.1 |
94.2 |
60.0 |
63.7 |
|
Total Pension Expense |
138.6 |
141.1 |
94.2 |
60.0 |
63.7 |
|
Discount Rate |
2.00% |
2.00% |
2.00% |
2.00% |
2.00% |
|
Expected Rate of Return |
0.10% |
0.10% |
2.90% |
2.10% |
2.10% |
Interim Income Statement
As Reported
Financials in: USD (mil)
Except for share items (millions) and per share items (actual units)
|
|
30-Jun-2011 |
31-Mar-2011 |
31-Dec-2010 |
30-Sep-2010 |
30-Jun-2010 |
|
Period Length |
3 Months |
3 Months |
3 Months |
3 Months |
3 Months |
|
UpdateType/Date |
Updated Normal |
Updated Normal |
Updated Normal |
Updated Normal |
Updated Normal |
|
Filed Currency |
JPY |
JPY |
JPY |
JPY |
JPY |
|
Exchange Rate
(Period Average) |
81.605269 |
82.241044 |
82.567473 |
85.838925 |
92.080323 |
|
|
|
|
|
|
|
|
Net sales |
5,776.7 |
6,113.6 |
5,253.1 |
5,412.8 |
4,967.7 |
|
Total Revenue |
5,776.7 |
6,113.6 |
5,253.1 |
5,412.8 |
4,967.7 |
|
|
|
|
|
|
|
|
Cost of Sales |
4,932.8 |
5,277.9 |
4,398.9 |
4,697.6 |
4,021.2 |
|
Total SGA Expenses |
488.1 |
- |
- |
- |
- |
|
Shipping Cost |
- |
128.3 |
128.7 |
115.0 |
107.8 |
|
Payroll & Wages |
- |
98.3 |
121.8 |
85.8 |
83.4 |
|
Reserve for Bonus |
- |
- |
23.0 |
20.2 |
18.8 |
|
Provision for Doubtful Account |
- |
3.4 |
0.8 |
1.3 |
1.8 |
|
Periodic Retirement Benefit |
- |
6.0 |
6.4 |
6.0 |
5.4 |
|
Other SGA Expenses |
- |
308.2 |
201.2 |
215.0 |
224.2 |
|
SP Impairment loss |
- |
0.0 |
0.0 |
- |
- |
|
SP L on adj. for changes of acc. assets |
0.0 |
0.0 |
- |
- |
25.8 |
|
Total Operating Expense |
5,420.9 |
5,822.1 |
4,880.9 |
5,141.0 |
4,488.4 |
|
|
|
|
|
|
|
|
SP Sale Gain-Invest.Sec |
0.0 |
- |
0.0 |
0.4 |
23.5 |
|
SP Sale Loss-Invest.Sec |
- |
-0.5 |
- |
- |
- |
|
NOP Interest Income |
10.1 |
13.8 |
9.6 |
8.5 |
5.1 |
|
NOP Dividend Income |
18.9 |
1.8 |
10.7 |
0.7 |
13.9 |
|
NOP Allotted Money-Ope. |
18.5 |
20.2 |
19.0 |
19.9 |
18.2 |
|
NOP Gain-Equity Method |
23.1 |
1.8 |
19.9 |
6.9 |
7.5 |
|
NOP Other Non-op. Income |
69.1 |
85.2 |
59.1 |
42.8 |
33.1 |
|
NOP Interest Expense |
-61.9 |
-63.6 |
-62.1 |
-61.1 |
-55.2 |
|
NOP Labor Fee-Transfer |
-48.2 |
-53.7 |
-49.8 |
-50.4 |
-45.9 |
|
NOP Loss-Equity Method |
- |
- |
- |
- |
0.0 |
|
NOP Other Non-op.Expense |
-91.6 |
-173.2 |
-20.6 |
-107.7 |
-68.5 |
|
Net Income Before Taxes |
293.7 |
123.5 |
358.1 |
131.8 |
410.9 |
|
|
|
|
|
|
|
|
Provision for Income Taxes |
101.7 |
11.2 |
107.3 |
-33.0 |
135.0 |
|
Net Income After Taxes |
192.0 |
112.3 |
250.8 |
164.8 |
275.9 |
|
|
|
|
|
|
|
|
Minority Interest |
-71.5 |
-42.8 |
-35.5 |
-54.9 |
-58.5 |
|
Net Income Before Extra. Items |
120.6 |
69.5 |
215.2 |
109.9 |
217.4 |
|
Net Income |
120.6 |
69.5 |
215.2 |
109.9 |
217.4 |
|
|
|
|
|
|
|
|
Rounding Adjustment |
0.0 |
0.0 |
- |
0.0 |
0.0 |
|
Income Available to Com Excl ExtraOrd |
120.5 |
69.5 |
215.2 |
109.9 |
217.4 |
|
|
|
|
|
|
|
|
Income Available to Com Incl ExtraOrd |
120.5 |
69.5 |
215.2 |
109.9 |
217.4 |
|
|
|
|
|
|
|
|
Basic Weighted Average Shares |
3,001.0 |
3,001.5 |
3,002.3 |
3,002.3 |
3,002.4 |
|
Basic EPS Excluding ExtraOrdinary Items |
0.04 |
0.02 |
0.07 |
0.04 |
0.07 |
|
Basic EPS Including ExtraOrdinary Item |
0.04 |
0.02 |
0.07 |
0.04 |
0.07 |
|
Dilution Adjustment |
0.0 |
0.0 |
0.0 |
0.0 |
0.0 |
|
Diluted Net Income |
120.5 |
69.5 |
215.2 |
109.9 |
217.4 |
|
Diluted Weighted Average Shares |
3,001.0 |
3,001.5 |
3,002.3 |
3,002.3 |
3,002.4 |
|
Diluted EPS Excluding ExtraOrd Items |
0.04 |
0.02 |
0.07 |
0.04 |
0.07 |
|
Diluted EPS Including ExtraOrd Items |
0.04 |
0.02 |
0.07 |
0.04 |
0.07 |
|
DPS-Common Stock |
0.00 |
0.02 |
0.00 |
0.02 |
0.00 |
|
Gross Dividends - Common Stock |
0.0 |
54.8 |
0.0 |
52.6 |
0.0 |
|
Normalized Income Before Taxes |
293.7 |
123.5 |
358.1 |
131.8 |
436.8 |
|
|
|
|
|
|
|
|
Inc Tax Ex Impact of Sp Items |
101.7 |
11.2 |
107.3 |
-33.0 |
143.5 |
|
Normalized Income After Taxes |
192.0 |
112.3 |
250.8 |
164.8 |
293.3 |
|
|
|
|
|
|
|
|
Normalized Inc. Avail to Com. |
120.5 |
69.5 |
215.2 |
109.9 |
234.8 |
|
|
|
|
|
|
|
|
Basic Normalized EPS |
0.04 |
0.02 |
0.07 |
0.04 |
0.08 |
|
Diluted Normalized EPS |
0.04 |
0.02 |
0.07 |
0.04 |
0.08 |
|
Research & Development Expenses |
84.6 |
- |
- |
- |
- |
|
Depreciation |
330.6 |
362.4 |
349.3 |
331.6 |
300.9 |
|
Interest Expense |
61.9 |
63.6 |
62.1 |
61.1 |
55.2 |
|
Reported Operating Profit |
355.8 |
291.5 |
372.2 |
271.8 |
505.1 |
|
Reported Ordinary Profit |
293.7 |
123.9 |
358.1 |
131.3 |
413.2 |
Annual Balance Sheet
As Reported
Financials in: USD (mil)
Except for share items (millions) and per share items (actual units)
|
|
31-Mar-2011 |
31-Mar-2010 |
31-Mar-2009 |
31-Mar-2008 |
31-Mar-2007 |
|
UpdateType/Date |
Updated Normal |
Updated Normal |
Updated Normal |
Updated Normal |
Updated Normal |
|
Filed Currency |
JPY |
JPY |
JPY |
JPY |
JPY |
|
Exchange Rate |
82.88 |
93.44 |
98.77 |
99.535 |
118.075 |
|
Auditor |
KPMG LLP |
KPMG LLP |
KPMG LLP |
KPMG LLP |
Azsa Audit Corp. |
|
Auditor Opinion |
Unqualified |
Unqualified |
Unqualified with
Explanation |
Unqualified |
Unqualified with
Explanation |
|
|
|
|
|
|
|
|
Cash and Deposit |
1,760.1 |
1,412.0 |
1,906.7 |
690.6 |
844.1 |
|
Note&Acct.Rcvbl. |
3,654.0 |
3,035.3 |
2,873.2 |
3,818.2 |
2,813.5 |
|
Lease receivables and investment assets |
313.8 |
131.2 |
- |
- |
- |
|
Inventories |
- |
- |
- |
- |
3,111.0 |
|
Merchandise & Product |
1,582.3 |
1,357.1 |
1,640.2 |
1,356.7 |
- |
|
Work in Process |
1,538.5 |
1,477.6 |
1,651.8 |
1,556.4 |
- |
|
Raw Materials & Supplies |
1,480.4 |
1,093.5 |
1,389.0 |
1,200.2 |
- |
|
Dfrd. Tax Assets |
260.4 |
344.5 |
101.4 |
226.2 |
175.3 |
|
Other Curr.Asset |
1,443.9 |
1,566.3 |
980.5 |
777.1 |
545.5 |
|
Allow. for Doubtful Account |
-6.9 |
-8.8 |
-6.8 |
-9.9 |
-7.0 |
|
Total Current Assets |
12,026.5 |
10,408.9 |
10,535.9 |
9,615.5 |
7,482.3 |
|
|
|
|
|
|
|
|
Bldg.&Structure |
3,372.6 |
3,085.2 |
2,861.1 |
2,955.7 |
2,491.6 |
|
Machinery&Equip&Vehicles |
4,383.3 |
4,234.2 |
4,271.1 |
4,678.5 |
3,557.9 |
|
Tool, Furnitures & Fixtures |
126.5 |
121.8 |
142.4 |
154.3 |
126.2 |
|
Land |
2,472.8 |
2,186.4 |
2,008.6 |
2,030.4 |
1,722.9 |
|
Construction in process |
906.2 |
732.7 |
543.1 |
501.3 |
611.0 |
|
Software&Rights |
- |
- |
- |
175.5 |
142.2 |
|
Software |
206.2 |
170.2 |
165.4 |
- |
- |
|
Goodwill |
- |
- |
0.0 |
5.5 |
0.0 |
|
Other Intangibles |
62.0 |
58.6 |
41.8 |
0.0 |
- |
|
Investment Sec. |
1,705.1 |
1,562.2 |
1,679.2 |
2,334.6 |
2,088.6 |
|
Equity secs.-nonconsol affil.&sub. |
590.5 |
541.4 |
- |
- |
- |
|
LT Loan |
78.9 |
96.5 |
68.2 |
71.5 |
53.7 |
|
Dfrd Tax Asset |
211.0 |
176.2 |
216.7 |
230.4 |
178.6 |
|
Other Assets |
610.9 |
729.8 |
744.6 |
684.0 |
572.6 |
|
Inv't partnership-nonconsol.affil.&subs |
210.1 |
9.9 |
- |
- |
- |
|
Allow. for Doubtful Account |
-37.8 |
-41.6 |
-37.4 |
-38.4 |
-43.3 |
|
Translation Adj. |
- |
- |
- |
0.0 |
- |
|
Total Assets |
26,924.8 |
24,072.5 |
23,240.7 |
23,398.8 |
18,984.2 |
|
|
|
|
|
|
|
|
Note&Acct. Pybl. |
5,775.5 |
4,653.5 |
4,856.2 |
4,905.3 |
4,175.0 |
|
ST Borrowing |
970.6 |
1,160.9 |
1,218.0 |
932.1 |
746.2 |
|
Current LT Debt |
1,088.5 |
635.7 |
374.0 |
815.3 |
695.9 |
|
Lease Debt (current) |
77.2 |
65.6 |
30.6 |
0.0 |
- |
|
Commercial Paper |
- |
0.0 |
556.8 |
1,105.1 |
0.0 |
|
Curr.-Corp.Bond |
432.4 |
2.5 |
505.8 |
585.1 |
197.2 |
|
Other Payable |
542.7 |
532.2 |
504.1 |
599.4 |
432.3 |
|
Income Tax Pybl. |
109.3 |
69.8 |
52.2 |
268.9 |
183.6 |
|
Dfrd. Tax Liab. |
27.5 |
22.0 |
15.6 |
31.4 |
28.8 |
|
Allow. for Bonus |
242.2 |
176.6 |
215.7 |
0.0 |
- |
|
Provision of Enviromental Expenses |
- |
- |
- |
0.0 |
2.3 |
|
Provision-Repair For Disaster Loss |
- |
- |
- |
- |
0.0 |
|
Prov-Prod.Wrrty. |
125.5 |
133.0 |
112.7 |
75.8 |
56.9 |
|
Provision for Construction Loss |
107.2 |
29.7 |
20.1 |
0.0 |
- |
|
Prov-Busi.Liquid |
0.2 |
32.5 |
39.8 |
55.4 |
34.8 |
|
Other Curr.Liab. |
1,220.1 |
1,135.1 |
1,366.0 |
1,547.7 |
1,242.5 |
|
Total Current Liabilities |
10,718.8 |
8,649.0 |
9,867.7 |
10,921.5 |
7,795.4 |
|
|
|
|
|
|
|
|
Corporate Bond |
2,139.8 |
2,281.5 |
2,023.1 |
2,159.6 |
1,974.9 |
|
LT Borrowing |
5,322.1 |
5,620.4 |
4,976.8 |
2,675.3 |
2,670.7 |
|
Lease Debt |
439.8 |
449.2 |
256.9 |
0.0 |
- |
|
Total Long Term Debt |
7,901.8 |
8,351.1 |
7,256.8 |
4,834.9 |
4,645.6 |
|
|
|
|
|
|
|
|
Dfrd. Tax Liab. |
189.7 |
258.9 |
65.3 |
168.8 |
312.5 |
|
Reval-Dfrd. Tax |
63.1 |
56.0 |
53.7 |
53.8 |
45.5 |
|
Res-Accr.Retire |
354.1 |
355.8 |
386.2 |
449.6 |
397.4 |
|
Provision for Environment |
30.1 |
29.8 |
42.5 |
44.4 |
36.0 |
|
Negative Goodwill |
- |
- |
- |
0.0 |
1.8 |
|
Other Liability |
459.5 |
410.9 |
369.9 |
417.5 |
360.1 |
|
Minor. Interest |
588.0 |
431.6 |
347.5 |
480.7 |
375.6 |
|
Total Liabilities |
20,305.2 |
18,543.1 |
18,389.6 |
17,371.3 |
13,969.8 |
|
|
|
|
|
|
|
|
Common Stock |
2,815.1 |
2,496.9 |
2,362.2 |
2,344.0 |
1,976.0 |
|
Capital Surplus |
1,003.0 |
889.6 |
841.6 |
836.5 |
705.3 |
|
Retained Earning |
3,648.4 |
2,770.3 |
2,556.5 |
3,067.6 |
2,025.7 |
|
Treasury Stock |
-622.9 |
-549.9 |
-520.7 |
-517.5 |
-266.9 |
|
Unreal.Gain-Sec |
238.2 |
241.1 |
4.5 |
357.9 |
640.0 |
|
Unrealized Gain/Loss on Hedge |
7.0 |
9.4 |
-63.4 |
40.5 |
18.5 |
|
Unreal.Gain-Land |
-57.4 |
-52.1 |
-49.0 |
-49.2 |
-41.5 |
|
Translation Adj. |
-411.8 |
-276.0 |
-280.6 |
-52.3 |
-42.5 |
|
Total Equity |
6,619.6 |
5,529.4 |
4,851.1 |
6,027.5 |
5,014.5 |
|
|
|
|
|
|
|
|
Total Liabilities & Shareholders' Equity |
26,924.8 |
24,072.5 |
23,240.7 |
23,398.8 |
18,984.2 |
|
|
|
|
|
|
|
|
S/O-Common Stock |
3,001.0 |
3,002.4 |
3,002.5 |
3,002.6 |
3,044.6 |
|
Total Common Shares Outstanding |
3,001.0 |
3,002.4 |
3,002.5 |
3,002.6 |
3,044.6 |
|
T/S-Common Stock |
114.0 |
112.7 |
112.6 |
112.5 |
70.4 |
|
Full-Time Employees |
34,772 |
33,629 |
33,526 |
33,657 |
31,828 |
|
Number of Common Shareholders |
162,224 |
168,145 |
177,171 |
171,868 |
171,609 |
|
Long Term Debt Maturing Within 1 Year |
1,818.7 |
638.2 |
879.8 |
1,400.3 |
893.1 |
|
Long Term Debt Maturing Within 2 Year |
1,207.4 |
1,372.4 |
783.2 |
855.1 |
1,179.6 |
|
Long Term Debt Maturing Within 3 Year |
2,284.5 |
1,046.1 |
1,266.8 |
669.8 |
717.1 |
|
Long Term Debt Maturing Within 4 Year |
895.8 |
1,940.5 |
826.3 |
714.2 |
548.5 |
|
Long Term Debt Maturing Within 5 Year |
860.7 |
787.3 |
1,709.2 |
648.5 |
594.1 |
|
Long Term Debt Remaining Maturities |
2,360.3 |
3,144.8 |
2,414.5 |
1,947.2 |
1,606.2 |
|
Total Long Term Debt, Supplemental |
9,427.4 |
8,929.3 |
7,879.7 |
6,235.2 |
5,538.6 |
|
Capital Lease Payments Due within 1 Year |
77.2 |
65.6 |
30.6 |
- |
- |
|
Capital Lease Payments Due in Year 2 |
106.0 |
66.9 |
31.4 |
- |
- |
|
Capital Lease Payments Due in Year 3 |
74.9 |
92.7 |
32.2 |
- |
- |
|
Capital Lease Payments Due in Year 4 |
142.3 |
65.3 |
55.8 |
- |
- |
|
Capital Lease Payments Due in Year 5 |
106.4 |
125.4 |
134.2 |
- |
- |
|
Capital Lease - Remaining Maturities |
10.2 |
98.9 |
3.4 |
- |
- |
|
Total Capital Leases |
517.0 |
514.7 |
287.5 |
- |
- |
|
Pesion obligation |
1,973.8 |
1,867.9 |
1,886.1 |
2,000.9 |
1,756.2 |
|
Plan assets |
1,723.0 |
1,569.4 |
1,447.6 |
1,768.5 |
1,859.5 |
|
Funded status |
-250.9 |
-298.5 |
-438.5 |
-232.4 |
103.2 |
|
Total Funded Status |
-250.9 |
-298.5 |
-438.5 |
-232.4 |
103.2 |
|
Discount Rate |
2.00% |
2.00% |
2.00% |
2.00% |
2.00% |
|
Expected Rate of Return |
0.10% |
0.10% |
2.90% |
2.10% |
2.10% |
|
Expense unrecog. for acct. changes |
3.4 |
4.8 |
5.5 |
6.6 |
6.4 |
|
Unrecog. actuarial G&L |
204.2 |
242.3 |
375.3 |
93.5 |
-272.1 |
|
Perpaid pension benefits |
310.7 |
304.4 |
328.5 |
317.3 |
234.9 |
|
Reserve for Accrued Retirement Benefits |
-354.1 |
-355.8 |
-386.2 |
-449.6 |
-397.4 |
|
Net Assets Recognized on Balance Sheet |
164.2 |
195.7 |
323.0 |
-32.2 |
-428.2 |
Interim Balance Sheet
As Reported
Financials in: USD (mil)
Except for share items (millions) and per share items (actual units)
|
|
30-Jun-2011 |
31-Mar-2011 |
31-Dec-2010 |
30-Sep-2010 |
30-Jun-2010 |
|
UpdateType/Date |
Updated Normal |
Updated Normal |
Updated Normal |
Updated Normal |
Updated Normal |
|
Filed Currency |
JPY |
JPY |
JPY |
JPY |
JPY |
|
Exchange Rate |
80.76 |
82.88 |
81.105 |
83.54 |
88.49 |
|
|
|
|
|
|
|
|
Cash and Deposit |
1,862.7 |
1,760.1 |
2,161.1 |
2,030.1 |
1,877.6 |
|
Note&Acct.Receivable |
3,829.3 |
3,654.0 |
3,370.5 |
3,374.8 |
3,140.4 |
|
Merchandise & Product |
1,701.2 |
1,582.3 |
1,729.8 |
1,385.4 |
1,371.4 |
|
Work in Process |
1,648.9 |
1,538.5 |
1,838.3 |
1,719.4 |
1,655.5 |
|
Raw Materials & Supplies |
1,666.6 |
1,480.4 |
1,500.4 |
1,416.6 |
1,304.0 |
|
Other Current Asset |
1,833.5 |
2,018.1 |
2,708.0 |
2,583.3 |
2,084.1 |
|
Allowance for doubtful accounts |
-6.2 |
-6.9 |
-9.6 |
-9.2 |
-8.5 |
|
Total Current Assets |
12,536.0 |
12,026.5 |
13,298.5 |
12,500.3 |
11,424.5 |
|
|
|
|
|
|
|
|
Building&Structure |
3,481.1 |
3,372.6 |
3,449.3 |
3,382.4 |
3,228.9 |
|
Machinery, Equipment & Vehicles |
4,886.2 |
4,383.3 |
4,525.5 |
4,561.8 |
4,381.3 |
|
Land |
2,543.5 |
2,472.8 |
2,544.6 |
2,439.1 |
2,306.7 |
|
Other PP&E |
575.5 |
1,032.6 |
984.4 |
852.9 |
845.8 |
|
Intangible assets |
264.5 |
268.2 |
280.4 |
271.2 |
264.5 |
|
Investment Security |
2,264.2 |
2,295.5 |
2,306.9 |
2,106.2 |
2,000.8 |
|
Other |
1,127.8 |
1,111.0 |
1,146.0 |
1,114.1 |
1,064.9 |
|
Allowance for doubtful accounts |
-34.4 |
-37.8 |
-40.1 |
-40.4 |
-42.1 |
|
Adjustment |
- |
- |
- |
- |
0.0 |
|
Total Assets |
27,644.4 |
26,924.8 |
28,495.5 |
27,187.7 |
25,475.4 |
|
|
|
|
|
|
|
|
Note&Acct. Payable |
5,823.3 |
5,775.5 |
6,752.6 |
6,082.3 |
5,174.4 |
|
ST Borrowing |
2,362.5 |
970.6 |
1,697.5 |
1,687.9 |
1,797.5 |
|
Current LT Debt |
- |
1,088.5 |
- |
- |
- |
|
Lease obligations, current |
- |
77.2 |
- |
- |
- |
|
Current Portion-Corporate Bond |
443.4 |
432.4 |
210.0 |
2.8 |
2.7 |
|
Income Tax Payable |
76.7 |
109.3 |
71.8 |
95.1 |
57.6 |
|
Allowance |
377.1 |
475.1 |
272.0 |
393.6 |
311.7 |
|
Other |
1,912.7 |
1,790.2 |
1,865.5 |
1,807.2 |
1,818.5 |
|
Total Current Liabilities |
10,995.7 |
10,718.8 |
10,869.4 |
10,068.9 |
9,162.4 |
|
|
|
|
|
|
|
|
Corporate Bond |
2,194.9 |
2,139.8 |
2,418.5 |
2,550.5 |
2,407.8 |
|
LT Borrowing |
5,419.0 |
5,322.1 |
6,238.0 |
6,087.1 |
5,907.4 |
|
Lease obligations |
- |
439.8 |
- |
- |
- |
|
Total Long Term Debt |
7,613.9 |
7,901.8 |
8,656.4 |
8,637.6 |
8,315.2 |
|
|
|
|
|
|
|
|
Res-Accr.Retire Bft. |
366.0 |
354.1 |
397.5 |
377.6 |
382.4 |
|
Other Reserves |
30.6 |
30.1 |
31.3 |
32.0 |
31.6 |
|
Other |
1,104.8 |
712.4 |
1,259.1 |
1,202.5 |
1,166.6 |
|
Minority Interest |
676.4 |
588.0 |
589.4 |
553.3 |
508.3 |
|
Total Liabilities |
20,787.5 |
20,305.2 |
21,803.1 |
20,871.9 |
19,566.5 |
|
|
|
|
|
|
|
|
Common Stock |
2,889.0 |
2,815.1 |
2,876.7 |
2,792.8 |
2,636.6 |
|
Capital Surplus |
1,029.3 |
1,003.0 |
1,024.9 |
995.0 |
939.4 |
|
Retained earnings |
3,810.0 |
3,648.4 |
3,658.1 |
3,396.3 |
3,099.8 |
|
Treasury Stock |
-639.4 |
-622.9 |
-633.6 |
-615.0 |
-580.6 |
|
Unreal.Gain-Val. Sec |
199.9 |
238.2 |
206.7 |
142.9 |
135.9 |
|
Unrealized Gain/Loss on Hedge |
7.6 |
7.0 |
18.3 |
12.4 |
3.8 |
|
Unreal.Gain-Val. Land |
-58.9 |
-57.4 |
-58.6 |
-56.9 |
-53.7 |
|
Translation Adj. |
-380.6 |
-411.8 |
-400.2 |
-351.7 |
-272.3 |
|
Total Equity |
6,856.9 |
6,619.6 |
6,692.3 |
6,315.8 |
5,908.8 |
|
|
|
|
|
|
|
|
Total Liabilities & Shareholders' Equity |
27,644.4 |
26,924.8 |
28,495.5 |
27,187.7 |
25,475.3 |
|
|
|
|
|
|
|
|
S/O-Common Stock |
3,001.0 |
3,001.0 |
3,002.3 |
3,002.3 |
3,002.3 |
|
Total Common Shares Outstanding |
3,001.0 |
3,001.0 |
3,002.3 |
3,002.3 |
3,002.3 |
|
T/S-Common Stock |
114.1 |
114.0 |
112.8 |
112.7 |
112.7 |
|
Full-Time Employees |
- |
34,772 |
34,918 |
34,498 |
33,982 |
Annual Cash Flows
As Reported
Financials in: USD (mil)
Except for share items (millions) and per share items (actual units)
|
|
31-Mar-2011 |
31-Mar-2010 |
31-Mar-2009 |
31-Mar-2008 |
31-Mar-2007 |
|
Period Length |
12 Months |
12 Months |
12 Months |
12 Months |
12 Months |
|
UpdateType/Date |
Updated Normal |
Updated Normal |
Updated Normal |
Updated Normal |
Updated Normal |
|
Filed Currency |
JPY |
JPY |
JPY |
JPY |
JPY |
|
Exchange Rate
(Period Average) |
85.691434 |
92.941082 |
100.484331 |
114.302336 |
116.944303 |
|
Auditor |
KPMG LLP |
KPMG LLP |
KPMG LLP |
KPMG LLP |
Azsa Audit Corp. |
|
Auditor Opinion |
Unqualified |
Unqualified |
Unqualified with
Explanation |
Unqualified |
Unqualified with
Explanation |
|
|
|
|
|
|
|
|
Income Before Tax |
1,037.1 |
151.7 |
276.7 |
1,341.8 |
1,499.6 |
|
Depreciation |
1,339.9 |
1,278.6 |
1,280.8 |
975.6 |
741.3 |
|
Int. and Div. Income |
-64.2 |
-46.5 |
-58.3 |
-44.8 |
-43.8 |
|
Interest Expense |
241.4 |
229.4 |
199.1 |
183.1 |
176.1 |
|
Sale-Investment Sec. |
-33.0 |
-10.3 |
-12.9 |
-25.7 |
-24.3 |
|
Val.Loss-Invest.Sec |
23.1 |
9.3 |
171.4 |
0.0 |
- |
|
Loss on adjustment for changes of accoun |
27.8 |
0.0 |
- |
- |
- |
|
Gain/Los-Eqty.Method |
-35.9 |
-19.5 |
-79.0 |
-111.9 |
-120.2 |
|
L on Liquid. of Business |
- |
- |
0.0 |
58.4 |
0.0 |
|
Loss Real Estate Allotment |
- |
- |
- |
- |
0.0 |
|
Provision for Environment Cost |
- |
- |
- |
0.0 |
-8.6 |
|
Allowance for Casualty Loss |
- |
- |
- |
0.0 |
-12.2 |
|
Impairment Loss |
0.0 |
38.5 |
157.7 |
0.0 |
40.8 |
|
Sale of PPE |
-0.9 |
-0.5 |
-1.6 |
-8.5 |
0.0 |
|
Retire. of PPE |
30.3 |
32.8 |
30.2 |
38.1 |
36.7 |
|
Account Receivable |
-458.6 |
-97.7 |
739.7 |
-282.0 |
198.4 |
|
Lease receivable and lease inv't asssts |
-180.8 |
0.0 |
- |
- |
- |
|
Inventories |
-206.1 |
1,060.5 |
-672.0 |
-350.4 |
-464.0 |
|
Account Payable |
636.7 |
-439.8 |
162.7 |
-137.0 |
339.3 |
|
Other Opera.Activity |
-34.8 |
0.5 |
-345.2 |
6.8 |
-57.9 |
|
Int. and Div. Rcvd. |
76.2 |
65.4 |
91.4 |
68.0 |
77.4 |
|
Interest Paid |
-241.5 |
-229.8 |
-192.3 |
-183.4 |
-174.2 |
|
Taxes Paid |
-81.8 |
-162.3 |
-572.4 |
-440.5 |
-727.0 |
|
Consolid. Change |
- |
- |
0.0 |
-0.1 |
54.5 |
|
Adjustment |
-0.1 |
- |
- |
- |
- |
|
Cash from Operating Activities |
2,074.8 |
1,860.2 |
1,176.3 |
1,087.6 |
1,532.0 |
|
|
|
|
|
|
|
|
Capital Expenditure |
-1,127.4 |
-1,379.6 |
-1,230.4 |
-1,287.1 |
-1,057.6 |
|
Sale-Fixed Assets |
20.6 |
55.3 |
23.5 |
67.9 |
12.8 |
|
Purch-Investment Sec |
-42.4 |
-16.1 |
-114.3 |
-542.6 |
-85.7 |
|
Sale-Investment Sec. |
44.7 |
16.1 |
46.0 |
132.9 |
52.9 |
|
Closely-held Inv't paid |
-39.0 |
-1.9 |
-21.5 |
0.0 |
- |
|
ST Loan, Net |
-0.6 |
0.8 |
0.9 |
15.6 |
5.8 |
|
LT Loan Extended |
-11.4 |
-30.8 |
-3.1 |
-11.0 |
-2.9 |
|
LT Loan Recovered |
38.1 |
4.7 |
6.9 |
2.6 |
2.1 |
|
Relocation Compensation Rcvd. |
0.0 |
60.7 |
52.9 |
0.0 |
- |
|
Purch. of Consol. Subs.' Securities |
17.3 |
-1.0 |
0.0 |
-8.1 |
0.0 |
|
Sale of Consol. Subs.' Securities |
-0.2 |
0.0 |
6.2 |
0.0 |
- |
|
Other Inv. Activity |
-28.0 |
-2.7 |
-35.0 |
-9.6 |
-26.8 |
|
Cash from Investing Activities |
-1,128.3 |
-1,294.6 |
-1,267.9 |
-1,639.3 |
-1,099.3 |
|
|
|
|
|
|
|
|
ST Debt, Net |
-298.9 |
-104.0 |
337.0 |
34.5 |
-282.3 |
|
Commercial Paper,Net |
0.0 |
-591.8 |
-547.3 |
962.4 |
0.0 |
|
Issued-LT Debt |
114.4 |
1,000.8 |
2,497.0 |
302.2 |
1,029.8 |
|
Repaid-LT Debt |
-719.6 |
-398.9 |
-686.9 |
-744.6 |
-514.7 |
|
Issued-Corporat.Bond |
0.0 |
355.1 |
346.6 |
349.9 |
522.5 |
|
Redemp-Corporat.Bond |
-2.8 |
-746.3 |
-579.6 |
-203.6 |
-585.1 |
|
Treasury stock purchased |
- |
- |
0.0 |
-177.8 |
-258.8 |
|
Proceed from Sale and Lease Back |
0.0 |
256.6 |
251.7 |
0.0 |
- |
|
Increase (decrease) in finance lease obl |
-73.8 |
-51.1 |
0.0 |
- |
- |
|
Dividend Paid |
-104.6 |
-0.8 |
-208.6 |
-197.8 |
-237.4 |
|
Other Finan.Activity |
-60.6 |
-38.4 |
-29.6 |
-52.6 |
-91.5 |
|
Cash from Financing Activities |
-1,145.9 |
-318.9 |
1,380.3 |
272.6 |
-417.5 |
|
|
|
|
|
|
|
|
Foreign Exchange Effects |
-57.2 |
6.8 |
-83.9 |
3.8 |
7.6 |
|
Net Change in Cash |
-256.6 |
253.5 |
1,204.8 |
-275.4 |
22.9 |
|
|
|
|
|
|
|
|
Net Cash - Beginning Balance |
2,470.5 |
2,024.3 |
663.6 |
858.8 |
816.5 |
|
Net Cash - Ending Balance |
2,213.8 |
2,277.8 |
1,868.4 |
583.4 |
839.4 |
|
Cash Interest Paid |
241.5 |
229.8 |
192.3 |
183.4 |
174.2 |
|
Cash Taxes Paid |
81.8 |
162.3 |
572.4 |
440.5 |
727.0 |
Interim Cash Flows
As Reported
Financials in: USD (mil)
Except for share items (millions) and per share items (actual units)
|
|
31-Mar-2011 |
31-Dec-2010 |
30-Sep-2010 |
30-Jun-2010 |
31-Mar-2010 |
|
Period Length |
12 Months |
9 Months |
6 Months |
3 Months |
12 Months |
|
UpdateType/Date |
Updated Normal |
Updated Normal |
Updated Normal |
Updated Normal |
Updated Normal |
|
Filed Currency |
JPY |
JPY |
JPY |
JPY |
JPY |
|
Exchange Rate
(Period Average) |
85.691434 |
86.812446 |
88.962162 |
92.080323 |
92.941082 |
|
|
|
|
|
|
|
|
Income Before Tax |
1,037.1 |
906.7 |
552.5 |
410.9 |
151.7 |
|
Depreciation |
1,339.9 |
979.3 |
631.4 |
300.9 |
1,278.6 |
|
Int. and Div. Income |
-64.2 |
-48.6 |
-28.5 |
-18.9 |
-46.5 |
|
Interest Expense |
241.4 |
178.1 |
116.1 |
55.2 |
229.4 |
|
Sale-Investment Sec. |
-33.0 |
-25.5 |
-24.8 |
-23.6 |
-10.3 |
|
Val.L-Inv.Sec |
23.1 |
3.4 |
23.8 |
- |
9.3 |
|
Gain/Los-Eqty.Method |
-35.9 |
-33.7 |
-14.4 |
-7.5 |
-19.5 |
|
L on adj. for changes of acc. assets |
27.8 |
27.4 |
26.8 |
25.8 |
0.0 |
|
Impairment Loss on Assets |
0.0 |
0.0 |
- |
- |
38.5 |
|
Sale of PPE |
-0.9 |
-0.8 |
-0.3 |
-0.1 |
-0.5 |
|
Retire L of PPE |
30.3 |
6.0 |
4.2 |
1.1 |
32.8 |
|
Account Receivable |
-458.6 |
51.3 |
27.4 |
93.3 |
-97.7 |
|
Lease receivable&lease assets |
-180.8 |
- |
- |
- |
0.0 |
|
Inventories |
-206.1 |
-542.4 |
-138.6 |
-168.2 |
1,060.5 |
|
Account Payable |
636.7 |
1,414.9 |
889.4 |
234.1 |
-439.8 |
|
Other Opera.Activity |
-34.8 |
-418.2 |
-303.6 |
-59.3 |
0.5 |
|
Int. and Div. Rcvd. |
76.2 |
62.3 |
37.7 |
26.8 |
65.4 |
|
Interest Paid |
-241.5 |
-166.2 |
-115.8 |
-42.9 |
-229.8 |
|
Taxes Paid |
-81.8 |
-49.1 |
14.1 |
-74.8 |
-162.3 |
|
Adjustment |
-0.1 |
-0.1 |
- |
- |
- |
|
Cash from Operating Activities |
2,074.8 |
2,344.8 |
1,697.5 |
752.9 |
1,860.2 |
|
|
|
|
|
|
|
|
Capital Expenditure |
-1,127.4 |
-794.1 |
-441.8 |
-215.1 |
-1,379.6 |
|
Sale-Fixed Assets |
20.6 |
6.3 |
6.6 |
4.3 |
55.3 |
|
Purch-Investment Sec |
-42.4 |
-22.7 |
-6.7 |
-0.2 |
-16.1 |
|
Sale-Investment Sec. |
44.7 |
40.5 |
37.7 |
35.7 |
16.1 |
|
Closely-held inv'ts made |
-39.0 |
-20.6 |
-12.3 |
-9.4 |
-1.9 |
|
ST Loan, Net |
-0.6 |
0.1 |
0.6 |
0.1 |
0.8 |
|
LT Loan Extended |
-11.4 |
-11.2 |
-0.4 |
-0.1 |
-30.8 |
|
LT Loan Recovered |
38.1 |
1.8 |
1.5 |
0.5 |
4.7 |
|
Moving Compensation Rcvd. |
0.0 |
0.0 |
0.0 |
0.0 |
60.7 |
|
Purch. of consol. sub's. securities |
17.3 |
-2.2 |
- |
- |
-1.0 |
|
Sale of consol. sub's. securities |
-0.2 |
-5.2 |
- |
- |
0.0 |
|
Other Inv. Activity |
-28.0 |
-27.0 |
-4.7 |
-3.1 |
-2.7 |
|
Cash from Investing Activities |
-1,128.3 |
-834.4 |
-419.5 |
-187.3 |
-1,294.6 |
|
|
|
|
|
|
|
|
ST Debt, Net |
-298.9 |
-356.0 |
-316.7 |
-120.7 |
-104.0 |
|
Commercial Paper, Net |
0.0 |
0.0 |
0.0 |
0.0 |
-591.8 |
|
Issued-LT Debt |
114.4 |
102.2 |
86.6 |
27.1 |
1,000.8 |
|
Repaid-LT Debt |
-719.6 |
-277.1 |
-241.1 |
-34.7 |
-398.9 |
|
Issued-Corporat.Bond |
0.0 |
0.0 |
0.0 |
0.0 |
355.1 |
|
Redemp-Corporat.Bond |
-2.8 |
-2.7 |
-1.3 |
-1.3 |
-746.3 |
|
Proceed from Sale and Lease Back |
0.0 |
0.0 |
0.0 |
- |
256.6 |
|
Finance Lease Debt Repaid |
-73.8 |
-53.0 |
-34.3 |
-16.5 |
-51.1 |
|
Dividend Paid |
-104.6 |
-99.4 |
-50.8 |
-44.1 |
-0.8 |
|
Other Finan.Activity |
-60.6 |
-57.6 |
-48.7 |
-12.8 |
-38.4 |
|
Cash from Financing Activities |
-1,145.9 |
-743.6 |
-606.3 |
-203.1 |
-318.9 |
|
|
|
|
|
|
|
|
Foreign Exchange Effects |
-57.2 |
-37.4 |
-23.3 |
9.1 |
6.8 |
|
Net Change in Cash |
-256.6 |
729.5 |
648.3 |
371.6 |
253.5 |
|
|
|
|
|
|
|
|
Net Cash - Beginning Balance |
2,470.5 |
2,438.6 |
2,379.7 |
2,299.1 |
2,024.3 |
|
Net Cash - Ending Balance |
2,213.8 |
3,168.0 |
3,028.0 |
2,670.7 |
2,277.8 |
|
Cash Interest Paid |
241.5 |
166.2 |
115.8 |
42.9 |
229.8 |
|
Cash Taxes Paid |
81.8 |
49.1 |
-14.1 |
74.8 |
162.3 |
FOREIGN EXCHANGE RATES
|
Currency |
Unit
|
Indian Rupees |
|
US Dollar |
1 |
Rs.49.18 |
|
UK Pound |
1 |
Rs.77.49 |
|
Euro |
1 |
Rs.67.96 |
RATING EXPLANATIONS
|
RATING |
STATUS |
PROPOSED CREDIT LINE |
|
|
>86 |
Aaa |
Possesses an extremely sound financial base with the strongest
capability for timely payment of interest and principal sums |
Unlimited |
|
71-85 |
Aa |
Possesses adequate working capital. No caution needed for credit
transaction. It has above average (strong) capability for payment of interest
and principal sums |
Large |
|
56-70 |
A |
Financial & operational base are regarded healthy. General
unfavourable factors will not cause fatal effect. Satisfactory capability for
payment of interest and principal sums |
Fairly Large |
|
41-55 |
Ba |
Overall operation is considered normal. Capable to meet normal
commitments. |
Satisfactory |
|
26-40 |
B |
Capability to overcome financial difficulties seems comparatively
below average. |
Small |
|
11-25 |
Ca |
Adverse factors are apparent. Repayment of interest and principal sums
in default or expected to be in default upon maturity |
Limited with
full security |
|
<10 |
C |
Absolute credit risk exists. Caution needed to be exercised |
Credit not
recommended |
|
---- |
NB |
New Business |
---- |
This score serves as a reference to assess SC’s credit risk
and to set the amount of credit to be extended. It is calculated from a
composite of weighted scores obtained from each of the major sections of this
report. The assessed factors and their relative weights (as indicated through
%) are as follows:
Financial
condition (40%) Ownership
background (20%) Payment
record (10%)
Credit history
(10%) Market trend
(10%) Operational
size (10%)
This report is issued at your request without any
risk and responsibility on the part of MIRA INFORM PRIVATE LIMITED (MIPL)
or its officials.