![]()
MIRA
INFORM REPORT
|
Report Date : |
31.10.2011 |
IDENTIFICATION DETAILS
|
Name : |
AUTO ALLIANCE
[THAILAND] COMPANY LIMITED |
|
|
|
|
Registered Office : |
49 Moo 4,
Eastern Seaboard Industrial
Estate [Rayong], T. Pluakdaeng,
A. Pluakdaeng, Rayong
21140 |
|
|
|
|
Country : |
Thailand |
|
|
|
|
Financials (as on) : |
31.12.2010 |
|
|
|
|
Date of Incorporation : |
28.11.1995 |
|
|
|
|
Com. Reg. No.: |
0105538141330 |
|
|
|
|
Legal Form : |
Private Limited Company |
|
|
|
|
Line of Business : |
Manufacturer, Distributor and Exporter of Vehicles and Automotive Parts |
RATING & COMMENTS
|
MIRA’s Rating : |
Ba |
|
RATING |
STATUS |
PROPOSED CREDIT LINE |
|
|
41-55 |
Ba |
Overall operation is considered normal. Capable to meet normal
commitments. |
Satisfactory |
|
Status : |
Satisfactory |
|
Payment Behaviour : |
No Complaints |
|
Litigation : |
Clear |
NOTES :
Any query related to this report can be made
on e-mail: infodept@mirainform.com
while quoting report number, name and date.
ECGC Country Risk Classification List – September 30, 2011
|
Country Name |
Previous Rating (30.06.2011) |
Current Rating (30.09.2011) |
|
Thailand |
B1 |
B1 |
|
Risk Category |
ECGC
Classification |
|
Insignificant |
A1 |
|
Low |
A2 |
|
Moderate |
B1 |
|
High |
B2 |
|
Very High |
C1 |
|
Restricted |
C2 |
|
Off-credit |
D |
Company name
AUTO
ALLIANCE [THAILAND] COMPANY
LIMITED
SUMMARY
BUSINESS
ADDRESS : 49
MOO 4, EASTERN
SEABOARD INDUSTRIAL
ESTATE
[RAYONG], T. PLUAKDAENG,
A. PLUAKDAENG,
RAYONG 21140
TELEPHONE : [66] 38
954-111, 38 954-222,
38 951-153
FAX :
[66] 38
954-151
E-MAIL
ADDRESS : aathr@ford.com
REGISTRATION
ADDRESS : SAME
AS BUSINESS ADDRESS
ESTABLISHED
: 1995
REGISTRATION
NO. : 0105538141330
CAPITAL REGISTERED : BHT. 8,435,000,000
CAPITAL PAID-UP : BHT.
8,435,000,000
SHAREHOLDER’S PROPORTION : FOREIGN :
100.00%
FISCAL YEAR CLOSING DATE : DECEMBER 31
LEGAL
STATUS : PRIVATE LIMITED
COMPANY
EXECUTIVE : MR. TOSHINORI KUSUHASHI,
JAPANESE
PRESIDENT
NO.
OF STAFF : 3,500
LINES
OF BUSINESS : VEHICLES AND
AUTOMOTIVE PARTS
MANUFACTURER, DISTRIBUTOR
AND EXPORTER
CORPORATE PROFILE
OPERATING
TREND : STABLE
PRESENT
SITUATION : OPERATING NORMALLY
REPUTATION : GOOD
WITH NORMAL BUSINESS
ENGAGEMENT
MANAGEMENT
STANDARD : MANAGEMENT WITH
GOOD PERFORMANCE
HISTORY
The
subject was established on November
28, 1995 as a private
limited company under
the name style
AUTO ALLIANCE [THAILAND]
COMPANY LIMITED, by
a joint venture
between Ford Motor
Company, U.S.A. and
Mazda Motor Corporation, Japan to produce vehicle
and pickup car for both local
and overseas markets.
It currently employs
approximate 3,500 staff.
The
subject achieved the ISO:9002,
in September 1999, ISO:14001
and QS:9000 from
Bureau Veritas Quality
International on February
24, 2000.
The major shareholders are Ford Motor Company, U.S.A. and
Mazda Motor Corporation,
Japan with holding
around 50% and 50% of
the subject’s shares
respectively.
The subject’s registered address
is 49 Moo 4, Eastern Seaboard
Industrial Estate [Rayong],
T. Pluakdaeng, A. Pluakdaeng,
Rayong 21140, and this
is the subject’s
current operation address.
THE BOARD
OF DIRECTOR
|
Name |
|
Nationality |
Age |
|
|
|
|
|
|
Mr. Peter David Fleet |
[x] |
British |
44 |
|
Mr. Gary Alan
Johnson |
|
American |
47 |
|
Mr. Toshinori Kusuhashi |
[x] |
Japanese |
60 |
|
Mr. Kiyoshi Ozaki |
|
Japanese |
62 |
|
Mr. Yuji Nagamine |
|
Japanese |
57 |
|
Mr. Hirotaka Kanazawa |
|
Japanese |
59 |
|
Mr. Masamichi Kogai |
|
Japanese |
57 |
|
Mr. John Lawler |
|
American |
45 |
|
Mr. Thomas A.H. Pixton |
|
British |
58 |
|
Ms. Kierston Robinson |
|
British |
41 |
|
Mr. Will Periam |
|
British |
44 |
|
Mr. Ashwani Kumar Galhotra |
|
American |
46 |
AUTHORIZED PERSON
One of the
mentioned directors [x] can
sign on behalf
of the subject
with company’s affixed.
MANAGEMENT
Mr. Toshinori Kusuhashi is the
President.
He is Japanese
nationality with the
age of 60 years
old.
Mr. Yasunobu Hirigushi is
the Executive VP
of Production.
He is Japanese
nationality.
Mr. Chanchai Trakarnudomsuk is
the Senior VP of
Sales & Marketing.
He is Thai
nationality.
BUSINESS OPERATIONS
The subject is
engaged in manufacturing of automotive assembly and spare
parts, comprising passenger
car and pickup
car, as well
as automotive parts,
under the brands
FORD and MAZDA. Its products
are “MAZDA 2”, “MAZDA 3” and “FORD
FIESTA”, passenger car and
“MAZDA BT-50” and
pickup car.
AutoAlliance’s plant currently produces 100,000 passenger
cars per year, split evenly between the Mazda
2 and Ford Fiesta. It also builds
175,000 pickups a year, also split equally between the Mazda BT-50 and
Ford Ranger.
PURCHASE
80% of raw material,
components and spare
parts are purchased
from local supplier,
the remaining 20% is imported
from Japan, U.S.A.,
and Europe.
MAJOR SUPPLIERS
Ford Motor Company : U.S.A.
Mazda Motor Corporation : Japan
SALES
The products are
sold locally through
Ford Sales & Service [Thailand]
Co., Ltd. and
Mazda Sales [Thailand]
Co., Ltd., as
well as exporting
directly to 136
countries, in U.S.A.,
Asia, Europe, Australia,
New Zealand, Ecuador, Columbia,
South America, Middle
East and Africa.
SUBSIDIARY AND
AFFILIATED COMPANY
The subject is
not found to have any
subsidiary or affiliated
company here in
Thailand.
LITIGATION
Bankruptcy and Receivership
There are no
litigation on bankruptcy
and receivership cases
filed against the
subject found at
Legal Execution Department
for the past
five years.
Others
There are no
legal suits filed
against the subject for
the past two
years.
CREDIT
Sales are by
cash or on
the credits term
of 30-60 days.
Local bills are
paid by cash
or on the
credits term of
30-60 days.
Imports are by
T/T.
Exports are against
T/T.
BANKING
Bangkok Bank Public
Co., Ltd.
EMPLOYMENT
The
subject employs approximately
3,500 staff.
LOCATION DETAILS
The premise
is owned for administrative office,
assembly plant and
warehouse on 846,400
square meters of
land at the
heading address. Premise
is located in
industrial area.
Branch
offices:
-
36th
Floor, Lake Ratchada
Office Complex, 193/144-145
Ratchadapisek Rd., Kwang
Klongtoey, Khet Klongtoey,
Bangkok 10110.
-
74/2
Moo 9, T. Bangchalong, A. Bangplee,
Samutprakarn 10540.
-
22/1
Moo 10, T. Nongkham,
A. Sriracha, Chonburi 20280.
-
300/53
Moo 1, T. Tasith,
A. Pluakdaeng, Rayong 21140.
REMARK
MAXIMUM
CREDIT SHOULD BE
GRANTED AT US$
100,000,000.
COMMENT
The
company is a manufacture of automobile parts supply
to Thailand’s Ford and Mazda assembling
plant as a regional
production hub, delivering world-class quality, standards
and procedures.
However,
in the first
nine months of 2011,
overall vehicle production
dropped by 25.2% year-on-year in
May to 98,804 vehicles
due to the impact of
the disaster, which
forced carmakers here
to cut output in line
with remaining stocks
of parts already
imported from Japan.
Passenger
car production fell by
21.9% to 35,393 units
and pickup trucks
by 27% to 63,360
units. Overall automobile
production is now
forecast to decline
by 100,000 units this
year from an
earlier estimate of
1.8 million due to
effects from the
disaster.
Nevertheless
the present situation
differed from previous
crisis that were
economic in nature in that
demand is still
running high while
supply is short
due to production
hitches from some parts suppliers due to heavy flood in many
industrial estate areas
in the Middle region in the country.
FINANCIAL INFORMATION
The
capital was registered
at Bht. 5,000,000,000
divided into 50,000,000
shares of Bht.
100 each.
The
capital was increased
later as follows:
Bht. 7,800,000,000
on July 25,
2008
Bht. 8,435,000,000
on May 24,
2010
The
latest registered capital
was increased to Bht. 8,435 million, divided into 84,350,000 shares
of Bht. 100
each with fully
paid.
THE SHAREHOLDERS
LISTED WERE
[as at
April 25, 2011]
|
NAME |
HOLDING |
% |
|
|
|
|
|
Ford Motor Company Nationality: American Address : One
American Rd., Michigan,
U.S.A. |
42,174,999 |
50.00 |
|
Mazda Motor Corporation Nationality: Japanese Address : 3-1
Shinshi Fuzu-sho, Aki-kun,
Hiroshima, Japan |
42,174,998 |
50.00 |
|
Ford International Service
LLC Nationality: American Address : One
American Rd., Michigan,
U.S.A. |
1 |
- |
|
Ford Communications Inc. Nationality: American Address : One
American Rd., Michigan,
U.S.A. |
1 |
- |
|
Mr. Toshinori Kasuhashi Nationality: Japanese Address : 49
Eastern Seaboard Industrial
Estate,
Pluakdaeng, Rayong |
1 |
- |
Total Shareholders : 5
Share Structure
[as at April
25, 2011]
|
Nationality |
Shareholders |
No. of Share |
% Shares |
|
|
|
|
|
|
Thai |
- |
- |
- |
|
Foreign |
5 |
84,350,000 |
100.00% |
|
Total |
5 |
84,350,000 |
100.00% |
NAME OF AUDITOR
& CERTIFIED PUBLIC
ACCOUNTANT NO.
Ms. Varakorn Vorathitikul No.
4474
BALANCE SHEET [BAHT]
The
latest financial figures
published for December
31, 2010 &
2009 were:
ASSETS
|
Current Assets |
2010 |
2009 |
|
|
|
|
|
Cash in Hand
& at Bank |
8,039,719,656 |
2,601,103,296 |
|
Trade Accounts Receivable |
8,124,525,155 |
3,760,278,560 |
|
Related Company Receivable |
575,253,237 |
681,968,383 |
|
Deferred Value Added
Tax |
574,213,219 |
276,356,124 |
|
Inventories |
5,447,376,932 |
3,674,834,693 |
|
Other Current Assets
|
376,572,922 |
184,980,971 |
|
|
|
|
|
Total Current Assets
|
23,137,661,121 |
11,179,522,027 |
|
Fixed Assets |
19,454,931,068 |
17,516,432,183 |
|
Computer Programme |
306,414,757 |
310,392,835 |
|
Other Assets |
6,650,307 |
8,226,320 |
|
Total Assets |
42,905,657,253 |
29,014,573,365 |
LIABILITIES &
SHAREHOLDERS' EQUITY [BAHT]
|
Current
Liabilities |
2010 |
2009 |
|
|
|
|
|
Trade Accounts Payable |
8,875,953,193 |
4,167,782,725 |
|
Other Payable |
1,328,063,322 |
3,684,672,099 |
|
Related Company Payable |
2,595,502,134 |
1,003,334,426 |
|
Forward Contract Payable |
240,529,194 |
94,543,806 |
|
Accrued Expenses |
1,328,792,403 |
729,588,339 |
|
Other Current Liabilities |
111,753,012 |
148,768,773 |
|
|
|
|
|
Total Current Liabilities |
14,480,593,258 |
9,828,690,168 |
|
Long-term Loan from Financial
Institution |
7,289,630,000 |
- |
|
Estimated Liabilities from
Employees’ Retirement Benefits |
87,334,801 |
39,797,499 |
|
Total Liabilities |
21,857,558,059 |
9,868,487,667 |
|
|
|
|
|
Shareholders' Equity |
|
|
|
|
|
|
|
Share capital : Baht 100
par value authorized, issued
and fully paid share
capital 84,350,000 shares |
8,435,000,000 |
8,435,000,000 |
|
|
|
|
|
Capital Paid |
8,435,000,000 |
8,435,000,000 |
|
Retained Earning Appropriated for
Accumulated Dividend |
1,874,176,083 |
1,663,301,083 |
|
Unappropriated |
10,738,923,111 |
9,047,784,615 |
|
Total Shareholders' Equity |
21,048,099,194 |
19,146,085,698 |
|
Total Liabilities & Shareholders' Equity |
42,905,657,253 |
29,014,573,365 |
PROFIT &
LOSS ACCOUNT
|
Revenue |
2010 |
2009 |
|
|
|
|
|
Sales |
92,391,011,748 |
49,791,789,605 |
|
Interest Income |
33,050,376 |
32,002,686 |
|
Other Income |
183,549,263 |
173,200,206 |
|
Total Revenues |
92,607,611,387 |
49,996,992,497 |
|
Expenses |
|
|
|
|
|
|
|
Cost of Goods
Sold |
80,150,743,388 |
44,972,231,728 |
|
Selling Expenses |
3,877,934,790 |
2,250,609,560 |
|
Administrative Expenses |
6,089,334,937 |
1,704,002,912 |
|
Other Expenses-Loss on Exchange Rate |
86,499,332 |
143,290,901 |
|
Total Expenses |
90,204,512,447 |
49,070,135,101 |
|
|
|
|
|
Profit before Financial
Costs & Income
Tax |
2,403,098,940 |
926,857,396 |
|
Financial Costs |
[183,936,733] |
[150,555,501] |
|
Profit before Income Tax |
2,219,162,207 |
776,301,895 |
|
Income Tax |
[281,304,576] |
[75,064,601] |
|
|
|
|
|
Net Profit / [Loss] |
1,937,857,631 |
701,237,294 |
FINANCIAL ANALYSIS
|
ITEM |
UNIT |
2010 |
2009 |
|
|
|
|
|
|
LIQUIDITY RATIO |
|
|
|
|
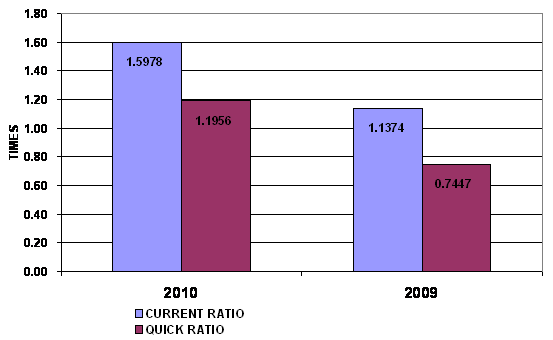
CURRENT RATIO |
TIMES |
1.60 |
1.14 |
|
QUICK RATIO |
TIMES |
1.20 |
0.74 |
|
|
|
|
|
|
ACTIVITY RATIO |
|
|
|
|
FIXED ASSETS TURNOVER |
TIMES |
4.75 |
2.84 |
|
TOTAL ASSETS TURNOVER |
TIMES |
2.15 |
1.72 |
|
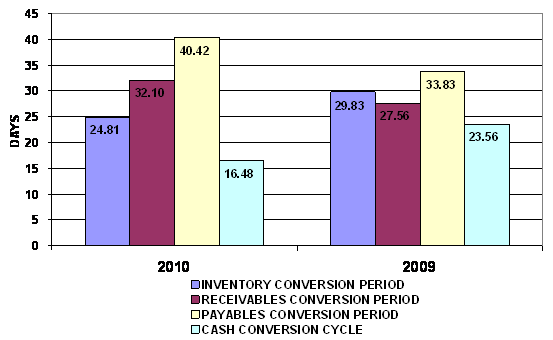
INVENTORY CONVERSION PERIOD |
DAYS |
24.81 |
29.83 |
|
INVENTORY TURNOVER |
TIMES |
14.71 |
12.24 |
|
RECEIVABLES CONVERSION PERIOD |
DAYS |
32.10 |
27.56 |
|
RECEIVABLES TURNOVER |
TIMES |
11.37 |
13.24 |
|
PAYABLES CONVERSION PERIOD |
DAYS |
40.42 |
33.83 |
|
CASH CONVERSION CYCLE |
DAYS |
16.48 |
23.56 |
|
|
|
|
|
|
PROFITABILITY
RATIO |
|
|
|
|
COST OF GOODS SOLD |
% |
86.75 |
90.32 |
|
SELLING & ADMINISTRATION |
% |
10.79 |
7.94 |
|
INTEREST |
% |
0.20 |
0.30 |
|
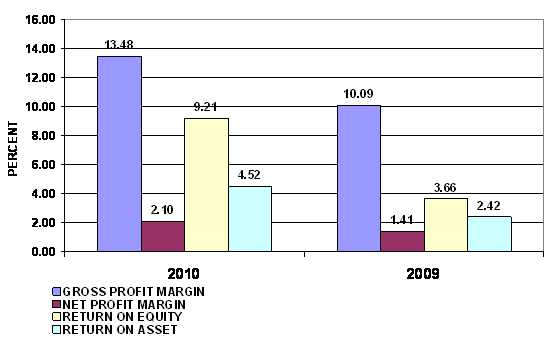
GROSS PROFIT MARGIN |
% |
13.48 |
10.09 |
|
NET PROFIT MARGIN BEFORE EX. ITEM |
% |
2.60 |
1.86 |
|
NET PROFIT MARGIN |
% |
2.10 |
1.41 |
|
RETURN ON EQUITY |
% |
9.21 |
3.66 |
|
RETURN ON ASSET |
% |
4.52 |
2.42 |
|
EARNING PER SHARE |
BAHT |
22.97 |
8.31 |
|
|
|
|
|
|
LEVERAGE RATIO |
|
|
|
|
DEBT RATIO |
TIMES |
0.51 |
0.34 |
|
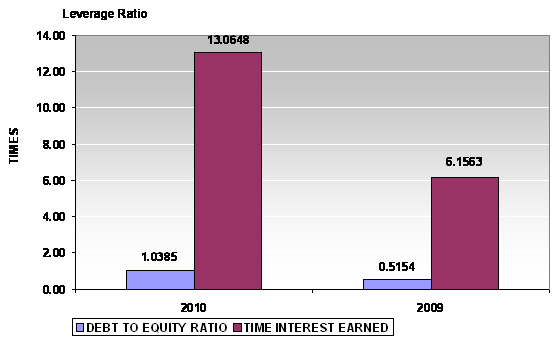
DEBT TO EQUITY RATIO |
TIMES |
1.04 |
0.52 |
|
TIME INTEREST EARNED |
TIMES |
13.06 |
6.16 |
|
|
|
|
|
|
ANNUAL GROWTH |
|
|
|
|
SALES GROWTH |
% |
85.55 |
|
|
OPERATING PROFIT |
% |
159.27 |
|
|
NET PROFIT |
% |
176.35 |
|
|
FIXED ASSETS |
% |
11.07 |
|
|
TOTAL ASSETS |
% |
47.88 |
|
PROFITABILITY
RATIO
|
Gross Profit Margin |
13.48 |
Impressive |
Industrial Average |
12.03 |
|
Net Profit Margin |
2.10 |
Deteriorated |
Industrial Average |
4.94 |
|
Return on Assets |
4.52 |
Deteriorated |
Industrial Average |
10.25 |
|
Return on Equity |
9.21 |
Acceptable |
Industrial Average |
15.18 |
Gross Profit Margin used to assess a firm's financial health by
revealing the proportion of money left over from revenues after accounting for the
cost of goods sold. Gross profit margin serves as the source for paying
additional expenses and future savings. The company’s figure is 13.48%. When compared with the industry
average, the ratio of the company was higher,
this indicated that company was more profitable than the same industry.
Net Profit Margin is the indicator of the company's efficiency in that
net profit takes into consideration all expenses of the company. A low profit
margin indicates a low margin of safety, higher risk that a decline in sales
will erase profits and result in a net loss. The company’s figure is 2.1%. When compared with the industry
average, the ratio of the company was lower.
Return on Assets measures how efficiently profits are being generated
from the assets employed in the business when compared with the ratios of firms
in a similar business. A low ratio in comparison with industry averages
indicates an inefficient use of business assets. When compared with the
industry average, it was lower, the company's figure is 4.52%.
Return on Equity indicates how profitable a company is by comparing its
net income to its average shareholders' equity, ROE measures how much the
shareholders earned for their investment in the company. When compared with the
industry average, it was lower, the company's figure is 9.21%.
Trend of the
average competitors in the same industry for last 5 years
Return on Assets Uptrend
Return on Equity Downtrend
LIQUIDITY RATIO
|
Current Ratio |
1.60 |
Satisfactory |
Industrial Average |
1.91 |
|
Quick Ratio |
1.20 |
|
|
|
|
Cash Conversion Cycle |
16.48 |
|
|
|
The Current Ratio is to ascertain whether a company's short-term assets are
readily available to pay off its short-term liabilities. The company's figure
is 1.6 times in 2010, increase from 1.14 times, then it is generally considered
to have good short-term financial strength. When compared with the industry
average, the ratio of the company was lower.
The Quick Ratio is a liquidity indicator that further refines the
current ratio by measuring the amount of the most liquid current assets there
are to cover current liabilities. The company's figure is 1.2 times in 2010,
increase from 0.74 times, although excluding inventory so the company still
have good short-term financial strength.
The Cash Conversion Cycle measures the number of days a company's cash
is tied up in the production and sales process of its operations and the benefit
from payment terms from its creditors. It meant the company could survive when
no cash inflow was received from sale for 17 days.
Trend of the
average competitors in the same industry for last 5 years
Current Ratio Uptrend
LEVERAGE RATIO
|
Debt Ratio |
0.51 |
Impressive |
Industrial Average |
0.32 |
|
Debt to Equity Ratio |
1.04 |
Risky |
Industrial Average |
0.41 |
|
Times Interest Earned |
13.06 |
Acceptable |
Industrial Average |
17.80 |
Debt to Equity Ratio a measurement of how much suppliers, lenders,
creditors and obligors have committed to the company versus what the
shareholders have committed. A lower the percentage means that the company is
using less leverage and has a stronger equity position.
Times Interest Earned measuring a company's ability to meet its debt
obligations. Ratio is 13.07 higher than 1, so the company can pay interest
expenses on outstanding debt.
Debt Ratio shows the proportion of a company's assets which are financed
through debt. The company's figure is 0.51 greater than 0.5, most of the
company's assets are financed through debt.
Trend of the
average competitors in the same industry for last 5 years
Debt Ratio Downtrend
Times Interest Earned Uptrend
ACTIVITY RATIO
|
Fixed Assets Turnover |
4.75 |
Impressive |
Industrial Average |
4.44 |
|
Total Assets Turnover |
2.15 |
Impressive |
Industrial Average |
2.06 |
|
Inventory Conversion Period |
24.81 |
|
|
|
|
Inventory Turnover |
14.71 |
Impressive |
Industrial Average |
13.05 |
|
Receivables Conversion Period |
32.10 |
|
|
|
|
Receivables Turnover |
11.37 |
Impressive |
Industrial Average |
10.32 |
|
Payables Conversion Period |
40.42 |
|
|
|
Trend of the average
competitors in the same industry for last 5 years
Fixed Assets Turnover Uptrend
Total Assets Turnover Uptrend
Inventory Turnover Uptrend
Receivables Turnover Uptrend
FOREIGN EXCHANGE RATES
|
Currency |
Unit
|
Indian Rupees |
|
US Dollar |
1 |
Rs.48.82 |
|
|
1 |
Rs.78.57 |
|
Euro |
1 |
Rs.69.28 |
RATING EXPLANATIONS
|
RATING |
STATUS |
PROPOSED CREDIT LINE |
|
|
>86 |
Aaa |
Possesses an extremely sound financial base with the strongest capability
for timely payment of interest and principal sums |
Unlimited |
|
71-85 |
Aa |
Possesses adequate working capital. No caution needed for credit
transaction. It has above average (strong) capability for payment of interest
and principal sums |
Large |
|
56-70 |
A |
Financial & operational base are regarded healthy. General
unfavourable factors will not cause fatal effect. Satisfactory capability for
payment of interest and principal sums |
Fairly Large |
|
41-55 |
Ba |
Overall operation is considered normal. Capable to meet normal
commitments. |
Satisfactory |
|
26-40 |
B |
Capability to overcome financial difficulties seems comparatively
below average. |
Small |
|
11-25 |
Ca |
Adverse factors are apparent. Repayment of interest and principal sums
in default or expected to be in default upon maturity |
Limited with
full security |
|
<10 |
C |
Absolute credit risk exists. Caution needed to be exercised |
Credit not
recommended |
|
-- |
NB |
New Business |
-- |
This score serves as a reference to assess SC’s credit risk
and to set the amount of credit to be extended. It is calculated from a composite
of weighted scores obtained from each of the major sections of this report. The
assessed factors and their relative weights (as indicated through %) are as
follows:
Financial
condition (40%) Ownership
background (20%) Payment
record (10%)
Credit history
(10%) Market trend
(10%) Operational
size (10%)
This report is issued at your request without any
risk and responsibility on the part of MIRA INFORM PRIVATE LIMITED (MIPL)
or its officials.