MIRA INFORM
REPORT
|
Report Date : |
09.04.2012 |
IDENTIFICATION DETAILS
|
Name : |
OLYMPUS CORPORATION |
|
|
|
|
Registered Office : |
Shinjuku Monolith, 2-3-1 Nishi-Shinjuku, Shinjuku-ku, 163-0914 |
|
|
|
|
Country : |
|
|
|
|
|
Financials (as on) : |
31.03.2011 |
|
|
|
|
Date of Incorporation : |
12.10.1919 |
|
|
|
|
Legal Form : |
Public Parent Company |
|
|
|
|
Line of Business : |
Subject is engaged in medical, life science, industrial
and imaging business |
|
|
|
|
No. of Employees
: |
34391 |
RATING & COMMENTS
|
MIRA’s Rating : |
A |
|
RATING |
STATUS |
PROPOSED CREDIT LINE |
|
|
56-70 |
A |
Financial & operational base are regarded healthy. General
unfavourable factors will not cause fatal effect. Satisfactory capability for
payment of interest and principal sums |
Fairly Large |
|
Status : |
Good |
|
|
|
|
Payment
Behaviour : |
Regular |
|
|
|
|
Litigation : |
--- |
NOTES :
Any query related to this report can be made
on e-mail : infodept@mirainform.com
while quoting report number, name and date.
ECGC Country Risk Classification List – September 30th, 2011
|
Country Name |
Previous Rating (30.06.2011) |
Current Rating (30.09.2011) |
|
Japan |
a1 |
a1 |
|
Risk Category |
ECGC
Classification |
|
Insignificant |
A1 |
|
Low |
A2 |
|
Moderate |
B1 |
|
High |
B2 |
|
Very High |
C1 |
|
Restricted |
C2 |
|
Off-credit |
D |
Company name & address
OLYMPUS CORPORATION
Shinjuku Monolith,
2-3-1 Nishi-Shinjuku,
Shinjuku-ku, 163-0914
Tel. No.: 81-3-33402111
Fax No.: 81 (3) 3340-2062
Synthesis
Employees 34391
Financials in: USD (Millions) ![]()
Company Type: Public Parent
Corporate Family: 131 Companies
Fiscal Year End: 31-Mar-2011
Traded: Tokyo Stock Exchange: 7733
Over The Counter: OCPNY Japan
Reporting Currency: Japanese Yen
Incorporation Date: 12-Oct-1919
Auditor: Ernst & Young LLP
Annual Sales: 9,885.5 1
Net Income: 86.1
Total Assets: 12,832.9 2
Market Value: 4,117.1
Business Description
Olympus Corporation is engaged in medical, life science, industrial and imaging business. The Company operates in five segments: medical, life sciences and industrial system business, imaging systems business, information and communication business, and other. The Medical Systems Business covers gastrointestinal endoscopes, surgical endoscopes, endotherapy devices, endoscopic ultrasound systems and medical information systems. Olympus offers live cell imaging and bio-imaging technology, which enables the observation of the movements and mechanisms of molecules within living organisms. Olympus offers industrial endoscopes, ultrasonic defect detection devices, eddy current flaw detectors, and x-ray fluorescence and x-ray diffraction analyzers, as well as to contribute to research and development of production sites. Olympus offers products in its digital camera and IC recorder line ups. For the three months ended 30 June 2011, OLYMPUS CORPORATION's revenues decreased 4% to Y198.57B. The Company's net loss totaled Y2.15B, vs. an income of Y1.50B. Revenues reflect decreased sales volume due to unfavorable economic environment. Net loss also suffered from unfavorable gross and operating profit margin, and the absence of gain on sale of affiliates' stock, as well as the presence of impairment loss.
Industry
|
Industry |
Medical Equipment and Supplies |
|
ANZSIC 2006: |
2412 - Medical and Surgical Equipment Manufacturing |
|
NACE 2002: |
3310 -
Manufacture of medical and surgical equipment and orthopaedic appliances |
|
NAICS 2002: |
334510 -
Electromedical and Electrotherapeutic Apparatus Manufacturing |
|
UK SIC 2003: |
3310 -
Manufacture of medical and surgical equipment and orthopaedic appliances |
|
US SIC 1987: |
3842 -
Orthopedic, Prosthetic, and Surgical Appliances and Supplies |
|
|
|
Significant Developments
|
Title |
Date |
|
Kyodo news
summary -5- |
21-Dec-2011 |
|
Japanese
prosecutors raid Olympus offices in accounting probe |
21-Dec-2011 |
|
2nd UPDATE:
Olympus Tokyo Offices Raided By Prosecutors, Police, SESC |
21-Dec-2011 |
|
Japan
prosecutors raid Olympus |
21-Dec-2011 |
|
Olympus
UPDATE1 |
|
Stock Snapshot
Traded: Tokyo Stock
Exchange: 7733
As of 9-Dec-2011
Financials
in: JPY
Recent Price 1,206.00 EPS 74.20
52 Week High 2,835.00 Price/Sales 0.38
52 Week Low 424.00 Dividend Rate 30.00
Avg. Volume (mil) 19.49 Price/Earnings 197.54
Market Value (mil) 319,572.10 Price/Book 1.92
Beta 1.43
Price
% Change Rel
S&P 500%
4 Week 162.17% 158.98%
13 Week -45.82% -44.53%
52 Week -51.37% -41.26%
Year to Date -50.94% -40.26%
Olympus Corporation, incorporated on October 12, 1919, is engaged in
medical, life science, industrial and imaging business. The Company operates
in five segments: medical, life sciences and industrial system business,
imaging systems business, information and communication business, and other.
The Medical Systems Business covers gastrointestinal endoscopes, surgical
endoscopes, endotherapy devices, endoscopic ultrasound systems and medical
information systems. Olympus offers live cell imaging and bio-imaging
technology, which enables the observation of the movements and mechanisms of
molecules within living organisms. Olympus offers industrial endoscopes,
ultrasonic defect detection devices, eddy current flaw detectors, and x-ray
fluorescence and x-ray diffraction analyzers, as well as to contribute to
research and development of production sites. Olympus offers products in its
digital camera and IC recorder line ups.
More Business Descriptions Olympus Corporation is engaged in medical, life science, industrial
and imaging business. The Company operates in five segments: medical, life
sciences and industrial system business, imaging systems business,
information and communication business, and other. The Medical Systems
Business covers gastrointestinal endoscopes, surgical endoscopes, endotherapy
devices, endoscopic ultrasound systems and medical information systems.
Olympus offers live cell imaging and bio-imaging technology, which enables
the observation of the movements and mechanisms of molecules within living
organisms. Olympus offers industrial endoscopes, ultrasonic defect detection
devices, eddy current flaw detectors, and x-ray fluorescence and x-ray
diffraction analyzers, as well as to contribute to research and development
of production sites. Olympus offers products in its digital camera and IC
recorder line ups. For the three months ended 30 June 2011, OLYMPUS
CORPORATION's revenues decreased 4% to Y198.57B. The Company's net loss
totaled Y2.15B, vs. an income of Y1.50B. Revenues reflect decreased sales
volume due to unfavorable economic environment. Net loss also suffered from
unfavorable gross and operating profit margin, and the absence of gain on
sale of affiliates' stock, as well as the presence of impairment loss. Manufacture and sale of precision equipment and optoelectronic systems
including cameras, microcassette tape recorders, video recorders, microscopes,
endoscopes, clinical analysers, electron beam page printers, optical data
storage systems and synthesized multimedia application products
Photography Equipment
|
||||||||||||||||||||||||||||||||||||||||||||||||||||||||||||||||||||||||||||||||||||||||||||||||||||||||||||||||||||||||||||||||||||||||||||||||||||||||||||||||||||||||||||||||||||||||||||||||||||||||||||||||||||||||||||||||||||||||||||||||||||||||||||||||||||||||||||||||||||||||||||||||||||||||||||||||||||||||||||||||||||||||||||||||||||||||||||||||||||||||||||||||||||||||||||||||||||||||||||||||||||||||||||||||||||||||||||||||||||||||||||||||||||||
Advancements in digital SLR cameras, especially in resolution and image
quality, have reached levels that satisfy the needs of professional
photographers who aim at taking high-quality digital pictures.TechnologyThe
company makes use of Opto-Digital Technology in the development of optical,
precision, digital imaging and cell related technologies. Olympus developed the
dual super aspherical lens, which achieves the optical performance of several
conventional lenses, and the CCD shift image stabilizer to compensate for
camera shake and provide clear image quality even at high magnification. These
two technologies are combined into one ultra -slender 5 x -zoom lens unit for
use with compact digital cameras.Information and Communication BusinessOlympus
Information and Communication Business segment was established in 2005, after
the acquisition of ITX in 2004. Through this group, the company provides mobile
terminals and related products.FinancialsIn the fiscal year ended March 2011,
the Information and Communication Business segment accounted for revenue of
JPY209,520m, representing an increase of 10.65% over that in 2010. The
operating income of the segment was JPY5,242m in fiscal year 2011, showing an
increase of 7.7% over that in 2010.
According to our in-house forecasts, medical equipment market in
emerging economies (China, India and Brazil) has grown at a CAGR of 6.5% over
the last eight years to reach $20.8 billion in 2009, driven by positive demographics,
increased awareness of medical conditions, the availability of treatment
options, and an increase in income levels. It is forecast to grow at a CAGR of
7.3% to reach $31.8 billion in 2015. As part of its business strategy to
expand
across geographies, in 2010, the company established Olympus Medical Systems
India Private Limited in India. This entity provides the company a considerable
opportunity to improve on its principal business segment, the Medical Systems
business, as healthcare systems are modernized and expanded in these
economies.Corporate Strategic PlanThe company’s strategic initiatives help it
in garnering a higher customer base and enhancing its financial performance. In
2010, Olympus launched 2010 Corporate Strategic Plan (CSP) for the next five
years.
It is forecast to grow at a CAGR of 7.3% to reach $31.8 billion in 2015.
As part of its business strategy to expand across geographies, in 2010, the
company established Olympus Medical Systems India Private Limited in India.
This entity provides the company a considerable opportunity to improve on its
principal business segment, the Medical Systems business, as healthcare systems
are modernized and expanded in these economies.Corporate Strategic PlanThe company’s
strategic initiatives help it in garnering a higher customer base and enhancing its financial
performance. In 2010, Olympus launched 2010 Corporate Strategic Plan (CSP) for
the next five years. Based on this CSP, the company is planning to accelerate
its transformation into a more competitive company globally and strengthen its
business presence in emerging markets with its management slogan of
"Advancing to the Next Stage Globalization".
This entity provides the company a considerable opportunity to improve
on its principal business segment, the Medical Systems business, as healthcare
systems are modernized and expanded in these economies.Corporate Strategic
PlanThe company’s strategic initiatives help it in garnering a higher customer
base and enhancing its financial performance. In 2010, Olympus launched 2010
Corporate Strategic Plan (CSP) for the next five years. Based on this CSP, the
company is planning to accelerate its transformation into a more competitive company
globally and strengthen its business presence in emerging markets with its
management slogan of "Advancing to the Next Stage Globalization". The
group focuses on reinforcing its corporate structure for five years from the
fiscal year 2010 and is expecting to bring in new sales of JPY1.5 trillion and
operating profit of JPY150 billion by fiscal year 2015.
It also introduced the E-PL1 in its Olympus Pen series; and expanded its
medical portfolio with the launch of X-Suit NIR, a biliary metallic stent
designed to relieve symptoms associated with pancreatic, liver and bile duct
cancers. In Europe, North America and Japan, it released high definition
endoscopic systems incorporating imaging functions using specific light spectra
such as Narrow Band Imaging (NBI) aimed at assisting physicians in more
accurate diagnoses. While expanding its lineup of surgical endoscopes and other
equipment incorporating NBI, it also has plans to forge ahead with product launches in Asia, where
it anticipates significant market growth. The company’s Imaging Systems segment
introduced the radio server pocket PJ-10 radio recorder with IC recording
function; TOUGH-8010 compact digital camera; Olympus Pen Lite E-PL1
new-generation system camera; Voice-Trek DM-4 IC recorder with 2.2 inch QVGA
color LCD panel and DAISY digital book player along with a number of digital
cameras and lens. Olympus’s Life Science and Industrial segment launched the
BX3 series system biological microscopes; while its Other business segment
launched its advanced non-destructive inspection systems, 38DL PLUS ultrasonic
thickness gauge along with EPOCH 600 and PLEX YS industrial videoscope for use
in a variety of maintenance situations.
The group focuses on reinforcing its corporate structure for five years from the fiscal year 2010 and is expecting to bring in new sales of JPY1.5 trillion and operating profit of JPY150 billion by fiscal year 2015. Such strategic initiatives could help the company in organizing its corporate structure effectively.Dependency on Key SuppliersOlympus depends upon certain suppliers to develop and manufacture certain products and components. Any interruption in supply of a sole-sourced component or raw material would have an adverse effect until a new source of supply is found or alternative manufacturing processes are employed. These additional supplier arrangements on commercially reasonable terms would affect on the company raw material cost.
Olympus classifies its geographical operations into five regions, namely, Japan, North America, Europe, Asia/Oceania, and Others. In fiscal year 2011, the Japanese region accounted for 45.6% of the company’s total sales, followed by 21.5% from North American, 18.2% from Europe, 11.5% from Asia/Oceania and 3.2% from Others. Recently, the company announced plans to establish Nagano Olympus Co., Ltd. at the Tatsuno Plant by October 2011.
|
|
Helpful |
Harmful |
|
Internal Origin |
Strengths ·
Strong Research and Development Capabilities |
Weaknesses |
|
External Origin |
Opportunities |
Threats |
Overview
Olympus Corporation is engaged in the development, manufacture and marketing
of equipment and devices for medical, healthcare, imaging, information, and
other industrial markets. The company is expanding its business activities in a
number of countries around the world. Olympus’s wide geographical presence
enables it to offset a cyclical slowdown in many of the western markets with
rapid growth in the emerging countries. By spreading its business across the
world, the company managed to minimize the risks arising out of operating in a
specific geographical region. However, high dependence on sole source supplier
and rapid technological changes could have an adverse affect on the company’s
business operations.
Strengths
Strong Research and Development Capabilities
The company’s research and development (R&D) efforts focus on enhancing
the reliability and performance of its existing products, as well as developing
new products based on its optical, precision and electronic technologies. It is
essential to develop new products, systems and services based on advanced
innovative technologies to compete effectively in the marketplace. Olympus made
significant investments in its product development in order to launch new
technologies and products. In the fiscal year ended March 2011, it spent a
total of JPY67,300m on its R&D activities, which accounted for
approximately 7.94% of the company’s total sales. Olympus conducts its R&D
activities within the relevant product groups of its businesses in order to add
innovative technologies to its product line. Such focused R&D activities
helped the company in building a strong patent portfolio of over 11,000 patents
across its business groups and geographic segments. Sturdy R&D activities
provide the company with a competitive advantage and drive its product
portfolio, helping it to gain a larger market share.
Core Competence: Opto-Digital Technology
Olympus focuses on its technological developments to gain a competitive
advantage over its peers in the industries that it operates in. Its
opto-digital technology is the result of the integration of the company's
advanced optical technologies and the latest digital technologies. This
technology is employed in almost all the products of the company from digital
cameras and endoscopes to microscopes and industrial equipment. The
incorporation of this technology in every product reflects the excellence of
Olympus’s core competence. The company pursues the further enhancement of the
opto-digital technology with four platform technologies, namely, optical,
precision, digital imaging and cell related technologies. Olympus developed the
dual super aspherical lens, which achieves the optical performance of several
conventional lenses, and the CCD shift image stabilizer to compensate for
camera shake and provide clear image quality even at high magnification. These
two technologies are combined into one ultra-slender 5x zoom lens unit for use
with compact digital cameras. With the development of such proprietary
technologies, the company could successfully augment its sales. Such platform
technologies enable Olympus to generate higher revenue as compared to its
competitors and strengthen its financial position.
Geographical Diversity
The company has a diversified global presence. By spreading its business
across the world, Olympus managed to minimize the risks arising out of a
specific geographical region. With a presence across all the major economies,
the company employs a workforce of about 35,000 people to provide a strong
portfolio of diversified products. With over 60 domestic subsidiaries and
affiliates, and more than 100 overseas subsidiaries and affiliates, the company
provides a diversified line of products. In the fiscal year ended March 2011,
the company generated 45.6% of its total revenue from the Japanese region,
followed by 21.5% from North American region, 18.2% from Europe, 11.5% from
Asia/Oceania and 3.2% from Others. A diversified geographical presence ensures
that the company remains shielded from the macroeconomic risks associated with
operational presence in one location.
Diversified
Business Operations
Olympus diversified its operations with its presence in a number of
industries and end markets. The company operates through five business
segments, namely, Imaging Systems Business; Medical Systems Business; Life
Science and Industrial Business; Information and Communication Business; and
Others. Through its Imaging Systems Business segment, the company provides film
cameras, digital cameras, voice recorders, optical components, imaging
software, film cameras, film SLR cameras, film compact cameras, digital storage
magneto-optical drive products, audio IC recorders, micro cassette tape
recorders and binoculars. Its Medical Systems Business segment is engaged in
the development, manufacture and marketing of endosurgery and endotherapy products.
Through this segment, the company provides diagnostic and therapeutic
endoscopes and endotherapy accessories; service and repair solutions; and
web-based endoscopy information products. Life science and Industrial Business
segment offers clinical hemanalysis systems, biological microscopes, industrial
microscopes, laboratory automation systems, genome analysis systems,
fluorescence analysis systems and microarray systems. The company's Information
and Communication business offers mobile terminals and related products.
Through Others segment, Olympus offers industrial endoscopes, non-destructive
testing devices, printers and bar code scanners, network infrastructure
systems, semiconductor devices, electronic equipment, mobile solutions, mobile
content services, and network infrastructure systems. In the fiscal year ended
March 2011, the company generated 41.95% of its total revenue from Medical
Systems business, followed by 15.5% from Imaging Systems business, 11.9% from
Life Science and Industrial business, 24.75% from Information and Communication
business and 5.9% from Other businesses. Such diversified business operations
help the company reduce the impact of market volatility in any particular
business unit and provide economic stability.
Weaknesses
Product Callbacks
Product recalls not only affect the company's current revenues, but
could also affect its long-term performance by reducing customer confidence.
Recently, Olympus’s subsidiary, Olympus America Inc., made a few product
recalls. In October 2010, the company recalled its VISERA OTV-S7V camera head
due to mislabeling of endoscopic body-type camera heads as cardiac-type. In
August 2010, it called back certain models of its Olympus SD snares and
reusable electrosurgical snares due to the inability of the snare wire to be
retracted into the snare tube after deployment of the snare. In March 2010, the
company recalled Olympus trocar spikes with model numbers: A5821, A5948, A5949,
WA58341L, and WA58343L due to weak weld seams. Such recalls would hamper
Olympus’s brand image and have a significant impact on its product sales.
Declining Profitability
Olympus’s profitability declined to a significant extent in the fiscal
year ended March 2011, which reflects its weak performance. Its operating
income and net income were JPY35,485m and JPY7,381m during 2011, representing a
decrease of 30.16% and 84.5% over that in 2010 respectively. In fiscal 2011,
the company recorded a fall in various profitability indicators. The company’s
operating margin was 4.19% for fiscal year 2011, as against 5.75% in fiscal
year 2009. A lower operating margin may indicate inefficient cost management or
a weak pricing strategy by the company. Its return on equity (ROE) was 4.5% at
the end of fiscal year 2011, as compared to 22.8% in 2010. Moreover, its return
on assets, and return on working capital were 0.69% and 17.1% in fiscal 2011,
as compared to 4.15% and 25.35% respectively in 2010. The fall in the Olympus’s
profitability could be attributed to high operating expenses. Deteriorating
profitability ratios indicate that the company has been underperforming and is
not in a position to deliver value as expected by its shareholders.
Opportunities
New Product Launches
In the rapidly changing and highly competitive markets, successful new
product launches would be a key to the company’s business growth and
profitability. In 2010, Olympus launched several new products in all its major
markets to broaden its product portfolio and increase its revenue streams. In
the Medical Systems segment, Olympus launched the airway management mobile
fiberscope, a flexible fiberoptic tracheal intubation fiberscope; and VisiGlide
disposable guidewire for endoscopic treatment. It also introduced the E-PL1 in
its Olympus Pen series; and expanded its medical portfolio with the launch of
X-Suit NIR, a biliary metallic stent designed to relieve symptoms associated
with pancreatic, liver and bile duct cancers. In Europe, North America and
Japan, it released high definition endoscopic systems incorporating imaging
functions using specific light spectra such as Narrow Band Imaging (NBI) aimed
at assisting physicians in more accurate diagnoses. While expanding its lineup
of surgical endoscopes and other equipment incorporating NBI, it also has plans
to forge ahead with product launches in Asia, where it anticipates significant
market growth. The company’s Imaging Systems segment introduced the radio
server pocket PJ-10 radio recorder with IC recording function; TOUGH-8010
compact digital camera; Olympus Pen Lite E-PL1 new-generation system camera;
Voice-Trek DM-4 IC recorder with 2.2 inch QVGA color LCD panel and DAISY
digital book player along with a number of digital cameras and lens. Olympus’s
Life Science and Industrial segment launched the BX3 series system biological
microscopes; while its Other business segment launched its advanced
non-destructive inspection systems, 38DL PLUS ultrasonic thickness gauge along
with EPOCH 600 and PLEX YS industrial videoscope for use in a variety of
maintenance situations. The recently-launched and newly approved products as
well as pipeline products provide enough opportunities to improve its market
share.
Corporate Strategic Plan
The company’s strategic initiatives help it in garnering a higher
customer base and enhancing its financial performance. In 2010, Olympus
launched 2010 Corporate Strategic Plan (CSP) for the next five years. Based on
this CSP, the company is planning to accelerate its transformation into a more
competitive company globally and strengthen its business presence in emerging
markets with its management slogan of "Advancing to the Next Stage
Globalization". The group focuses on reinforcing its corporate structure
for five years from the fiscal year 2010 and is expecting to bring in new sales
of JPY1.5 trillion and operating profit of JPY150 billion by fiscal year 2015.
Such strategic initiatives could help the company in organizing its corporate
structure effectively.
Inorganic Growth Strategy
Inorganic growth strategies generally help companies enhance value for
their shareholders. The company continues to view acquisitions as a key part of
its growth criteria. These acquisitions are intended to supplement Olympus’s
core growth and help expand its business, with the incorporation of new
technologies, products, and geographical coverage. In July 2010, the company’s
subsidiary, Olympus NDT Corporation, acquired 100% of shares of the US-based
Innov-X Systems, Inc, through which it broadened its industrial testing and
measurement equipment portfolio. In June 25, 2010, Olympus entered into an
agreement to acquire Spiration, Inc., a medical device company and made it a
consolidated subsidiary of Olympus. Olympus Medical signed a distributorship
agreement with Spiration on 2008. Through the agreement, Olympus Medical
obtained exclusive rights to market and distribute Spiration’s IBV Valve System
in Japan and Europe and enabled it to develop the next-generation endoscopic
respiratory products to help physicians diagnose, treat and observe conditions
of the airways and lungs in a better way. In March 2009, Olympus acquired
microscope, imaging and image analysis businesses from Optical Analysis
Corporation. The company would continue to serve the customers of the optical
analysis corporation in the key imaging area. Acquisition of the imaging
business increases the company’s customer base across various states of the US.
Expansion in Emerging Markets
Emerging markets offer a strong growth opportunity for the company,
which can leverage its strong brand and product portfolio to take advantage of
rapid growth in these markets. The demand in the core markets is falling;
hence, in order to sustain their top-line, companies are looking at tapping new
markets, especially the emerging economies. According to our in-house forecasts,
medical equipment market in emerging economies (China, India and Brazil) has
grown at a CAGR of 6.5% over the last eight years to reach $20.8 billion in
2009, driven by positive demographics, increased awareness of medical
conditions, the availability of treatment options, and an increase in income
levels. It is forecast to grow at a CAGR of 7.3% to reach $31.8 billion in
2015. As part of its business strategy to expand across geographies, in 2010,
the company established Olympus Medical Systems India Private Limited in India.
This entity provides the company a considerable opportunity to improve on its
principal business segment, the Medical Systems business, as healthcare systems
are modernized and expanded in these economies.
Threats
Technological Obsolescence
Technological obsolescence in the market leads to decrease in product
sales. Olympus is dependent on its state of the art Opto-Digital technology for
the development of its digital products. Hence, in order to meet its customer’s
demands, the company must continuously design new products, and update existing
products and services and develop new technologies. The launch of new products
and technologies by the company involves a significant commitment to research
and development. Upon investing in these new technologies, the company’s sales
and profits may suffer if they are not accepted in the marketplace as
anticipated. Its competitors may develop innovative technologies and products,
which might render its technology and products obsolete or uncompetitive.
Competitive Atmosphere
The prevailing competitive environment in the medical equipment sector
and customer preferences could affect the company’s performance. The demand for
its products depends on the competitive atmosphere, including the timely
development and introduction of new and competitive products and the company’s
response to downward pricing to sustain competition. Factors including changes
in customer order patterns, changing incentive programs or competitors’ new
products could impact the company’s competitive ability.
Dependency on Key Suppliers
Olympus depends upon certain suppliers to develop and manufacture
certain products and components. Any interruption in supply of a sole-sourced
component or raw material would have an adverse effect until a new source of
supply is found or alternative manufacturing processes are employed. These
additional supplier arrangements on commercially reasonable terms would affect
on the company raw material cost. Failure to obtain required amount of raw
materials and high dependence on limited source suppliers could adversely
impact its ability to produce sufficient quantities of products, which in turn
would affect on Olympus's business operations.
Stringent Government Regulations
Olympus’s products, research and development activities and
manufacturing processes have to comply with various local, state, federal,
foreign and transnational laws and regulations. In the US, the FDA regulates
the introduction of new medical products, manufacturing and labeling and record
keeping procedures for such products. Obtainment of marketing approval for new
medical devices from the US FDA is time consuming and expensive. Products
marketed outside the US are also subject to government regulations, which vary
from country to country. The company has to comply with different regulations
governing product standards, packaging and labeling requirements, import
restrictions, tariff regulations and tax requirements. Non-compliance by the
company with applicable laws and regulations or failure to maintain, renew or
obtain necessary permits and licenses could have an adverse effect on the
company's results of operations and financial performance.
|
Corporate Family |
Corporate Structure
News: |
|
|
|
|
Total Corporate Family Members: 131 |
|
|
Company Name |
Company Type |
Location |
Country |
Industry |
Sales |
Employees |
|
Parent |
Shinjuku-ku |
Japan |
Medical Equipment and Supplies |
9,885.5 |
34,391 |
|
|
Subsidiary |
Hamburg |
Germany |
Medical Equipment and Supplies |
1,855.2 |
4,650 |
|
|
Subsidiary |
Hamburg, Hamburg |
Germany |
Retail (Specialty) |
369.5 |
3,000 |
|
|
Subsidiary |
Hamburg, Hamburg |
Germany |
Medical Equipment and Supplies |
146.9 |
700 |
|
|
Subsidiary |
Teltow, Brandenburg |
Germany |
Medical Equipment and Supplies |
|
70 |
|
|
Subsidiary |
Rungis |
France |
Photography |
213.3 |
374 |
|
|
Subsidiary |
Barcelona |
Spain |
Miscellaneous Capital Goods |
135.2 |
270 |
|
|
Subsidiary |
Segrate |
Italy |
Miscellaneous Capital Goods |
112.5 |
151 |
|
|
Subsidiary |
Münster, Nordrhein-Westfalen |
Germany |
Scientific and Technical Instruments |
35.0 |
140 |
|
|
Subsidiary |
Zoeterwoude, Zuid-Holland |
Netherlands |
Chemical Manufacturing |
72.5 |
120 |
|
|
Olympus
Service Facility Portugal - Tecnologias Ópticas E Digitais, LDA |
Subsidiary |
Torre De Vilela |
Portugal |
Audio and Video Equipment |
8.6 |
96 |
|
Subsidiary |
Hamburg |
Germany |
Medical Equipment and Supplies |
469.6 |
84 |
|
|
Subsidiary |
Praha |
Czech Republic |
Photography |
|
81 |
|
|
Subsidiary |
Hamburg |
Germany |
Business Services |
1,066.5 |
80 |
|
|
Subsidiary |
Wien, Wien |
Austria |
Retail (Specialty) |
54.7 |
80 |
|
|
Subsidiary |
Volketswil, Zurich |
Switzerland |
Medical Equipment and Supplies |
|
75 |
|
|
Subsidiary |
Aartselaar |
Belgium |
Medical Equipment and Supplies |
46.0 |
70 |
|
|
Subsidiary |
Solna, Stockholm |
Sweden |
Photography |
48.2 |
63 |
|
|
Subsidiary |
Ballerup |
Denmark |
Medical Equipment and Supplies |
46.2 |
60 |
|
|
Subsidiary |
Budapest |
Hungary |
Photography |
|
60 |
|
|
Subsidiary |
Espoo |
Finland |
Personal and Household Products |
41.4 |
53 |
|
|
Subsidiary |
Lisboa |
Portugal |
Retail (Specialty) |
24.6 |
51 |
|
|
Subsidiary |
Southend On Sea |
United Kingdom |
Miscellaneous Capital Goods |
26.6 |
46 |
|
|
Subsidiary |
Oslo, Oslo |
Norway |
Photography |
39.3 |
44 |
|
|
Subsidiary |
Zagreb |
Croatia |
Medical Equipment and Supplies |
|
44 |
|
|
Branch |
Ljubljana |
Slovenia |
Photography |
|
40 |
|
|
Subsidiary |
Tuttlingen, Baden-Württemberg |
Germany |
Personal and Household Products |
|
14 |
|
|
Subsidiary |
Hamburg, Hamburg |
Germany |
Business Services |
|
2 |
|
|
Subsidiary |
Hamburg |
Germany |
Scientific and Technical Instruments |
75.0 |
|
|
|
Subsidiary |
Munich |
Germany |
Medical Equipment and Supplies |
1.0 |
|
|
|
Subsidiary |
Warsaw |
Poland |
Chemical Manufacturing |
|
|
|
|
Subsidiary |
Warsaw |
Poland |
Chemical Manufacturing |
|
|
|
|
Subsidiary |
Barcelona |
Spain |
Photography |
|
|
|
|
Subsidiary |
Hamburg |
Germany |
Medical Equipment and Supplies |
|
|
|
|
Subsidiary |
Moscow |
Russian Federation |
Medical Equipment and Supplies |
|
|
|
|
Subsidiary |
Istanbul |
Turkey |
Medical Equipment and Supplies |
|
|
|
|
Subsidiary |
Tallinn |
Estonia |
Medical Equipment and Supplies |
|
|
|
|
Subsidiary |
Vilnius |
Lithuania |
Photography |
|
|
|
|
Subsidiary |
Riga |
Latvia |
Photography |
|
|
|
|
Subsidiary |
Belgrade |
Serbia |
Photography |
|
|
|
|
Subsidiary |
Tokyo |
Japan |
Medical Equipment and Supplies |
|
2,791 |
|
|
Subsidiary |
Southend On Sea |
United Kingdom |
Electronic Instruments and Controls |
400.9 |
1,046 |
|
|
Subsidiary |
Southend On Sea |
United Kingdom |
Fabricated Plastic and Rubber |
10.8 |
93 |
|
|
Subsidiary |
Southend On Sea |
United Kingdom |
Nonclassifiable Industries |
|
|
|
|
Subsidiary |
Southend On Sea |
United Kingdom |
Nonclassifiable Industries |
|
|
|
|
Branch |
Dublin |
Ireland |
Medical Equipment and Supplies |
14.7 |
24 |
|
|
Subsidiary |
Southend On Sea |
United Kingdom |
Business Services |
|
|
|
|
Subsidiary |
Bolton |
United Kingdom |
Healthcare Facilities |
|
40 |
|
|
Subsidiary |
Southend On Sea |
United Kingdom |
Nonclassifiable Industries |
|
|
|
|
Subsidiary |
Tokyo |
Japan |
Photography |
|
953 |
|
|
Subsidiary |
Chiyoda-Ku |
Japan |
Retail (Technology) |
2,551.2 |
927 |
|
|
Subsidiary |
Center Valley, PA |
United States |
Electronic Instruments and Controls |
1.2 |
800 |
|
|
Branch |
San Jose, CA |
United States |
Business Services |
47.0 |
385 |
|
|
Subsidiary |
Kennewick, WA |
United States |
Scientific and Technical Instruments |
|
76 |
|
|
Subsidiary |
Cobourg, ON |
Canada |
Electronic Instruments and Controls |
|
400 |
|
|
Branch |
Irving, TX |
United States |
Medical Equipment and Supplies |
35.9 |
60 |
|
|
Branch |
Miami, FL |
United States |
Medical Equipment and Supplies |
16.1 |
50 |
|
|
Subsidiary |
Redmond, WA |
United States |
Healthcare Facilities |
10.2 |
40 |
|
|
Subsidiary |
Mexico |
Mexico |
Medical Equipment and Supplies |
|
7 |
|
|
Subsidiary |
México |
Mexico |
Photography |
|
|
|
|
Subsidiary |
Sao Paulo |
Brazil |
Medical Equipment and Supplies |
|
|
|
|
Subsidiary |
North Ryde, NSW |
Australia |
Scientific and Technical Instruments |
36.8 |
180 |
|
|
Subsidiary |
Singapore |
Singapore |
Medical Equipment and Supplies |
65.4 |
158 |
|
|
Subsidiary |
Woburn, MA |
United States |
Medical Equipment and Supplies |
49.6 |
100 |
|
|
Subsidiary |
Hong Kong |
Hong Kong |
Retail (Specialty) |
1.0 |
100 |
|
|
Subsidiary |
Markham, ON |
Canada |
Medical Equipment and Supplies |
|
100 |
|
|
Subsidiary |
Singapore |
Singapore |
Business Services |
107.7 |
70 |
|
|
Subsidiary |
Southborough, MA |
United States |
Scientific and Technical Instruments |
175.0 |
50 |
|
|
Branch |
Maple Grove, MN |
United States |
Medical Equipment and Supplies |
80.5 |
250 |
|
|
Branch |
Memphis, TN |
United States |
Medical Equipment and Supplies |
48.3 |
150 |
|
|
Subsidiary |
Christchurch Central |
New Zealand |
Medical Equipment and Supplies |
2.9 |
30 |
|
|
Subsidiary |
Stoughton, MA |
United States |
Medical Equipment and Supplies |
|
10 |
|
|
Recently acquired (previously owned by Spirus Medical Inc).See corporate
structure news on OLYMPUS CORPORATION for details |
|
|
|
|
|
|
|
Subsidiary |
London |
United Kingdom |
Medical Equipment and Supplies |
|
1 |
|
|
Subsidiary |
Wokingham |
United Kingdom |
Medical Equipment and Supplies |
14.6 |
16 |
|
|
Subsidiary |
Shirakawa |
Japan |
Medical Equipment and Supplies |
153.7 |
|
|
|
Subsidiary |
Kuala Lumpur, Wilayah Persekutuan |
Malaysia |
Medical Equipment and Supplies |
29.1 |
|
|
|
Subsidiary |
Kawasaki |
Japan |
Miscellaneous Transportation |
1.0 |
|
|
|
Subsidiary |
Tokyo |
Japan |
Software and Programming |
1.0 |
|
|
|
Subsidiary |
Tokyo |
Japan |
Rental and Leasing |
1.0 |
|
|
|
Subsidiary |
Sunto Gun |
Japan |
Scientific and Technical Instruments |
1.0 |
|
|
|
Subsidiary |
Kamina Gun |
Japan |
Chemical Manufacturing |
1.0 |
|
|
|
Subsidiary |
Nagano |
Japan |
Computer Hardware |
1.0 |
|
|
|
Subsidiary |
Tokyo |
Japan |
Business Services |
1.0 |
|
|
|
Subsidiary |
Tokyo |
Japan |
Biotechnology and Drugs |
|
|
|
|
Subsidiary |
Tokyo |
Japan |
Business Services |
|
|
|
|
Subsidiary |
Macquarie Park, NSW |
Australia |
Medical Equipment and Supplies |
|
|
|
|
Subsidiary |
Tokyo |
Japan |
Miscellaneous Financial Services |
|
|
|
|
Subsidiary |
Tokyo |
Japan |
Electronic Instruments and Controls |
54.6 |
51 |
|
|
Subsidiary |
Hong Kong |
Hong Kong |
Business Services |
|
|
|
|
Subsidiary |
Tokyo |
Japan |
Fish and Livestock |
|
|
|
|
Subsidiary |
Tokyo |
Japan |
Business Services |
|
|
|
|
Subsidiary |
Tokyo |
Japan |
Miscellaneous Capital Goods |
|
|
|
|
Subsidiary |
Kuroishi-shi |
Japan |
Medical Equipment and Supplies |
|
|
|
|
Subsidiary |
Aizu-Wakamatsu-shi |
Japan |
Medical Equipment and Supplies |
|
|
|
|
Subsidiary |
Seoul |
Korea, Republic of |
Software and Programming |
|
|
|
|
Subsidiary |
Seoul |
Korea, Republic of |
Medical Equipment and Supplies |
|
|
|
|
Subsidiary |
Singapore |
Singapore |
Medical Equipment and Supplies |
|
|
|
|
Subsidiary |
Long Thanh |
Viet Nam |
Medical Equipment and Supplies |
|
|
|
|
Subsidiary |
Bangkok, Bangkok |
Thailand |
Medical Equipment and Supplies |
|
|
|
|
Subsidiary |
Gurgaon |
India |
Medical Equipment and Supplies |
|
|
|
|
Subsidiary |
Tokyo |
Japan |
Engineering Consultants |
|
|
|
|
Subsidiary |
Tokyo |
Japan |
Business Services |
|
|
|
|
Subsidiary |
Tokyo |
Japan |
Electronic Instruments and Controls |
|
|
|
|
Subsidiary |
Tokyo |
Japan |
Software and Programming |
|
|
|
|
Subsidiary |
Tokyo |
Japan |
Biotechnology and Drugs |
|
|
|
|
Subsidiary |
Tokyo |
Japan |
Photography |
|
|
|
|
Subsidiary |
Tokyo |
Japan |
Business Services |
|
|
|
|
Subsidiary |
Yongin-si |
Korea, Republic of |
Business Services |
|
|
|
|
Subsidiary |
Lapu-Lapu City |
Philippines |
Medical Equipment and Supplies |
|
|
|
|
Subsidiary |
Taichung |
Taiwan |
Medical Equipment and Supplies |
|
|
|
|
Subsidiary |
Beijing |
China |
Medical Equipment and Supplies |
|
|
|
|
Subsidiary |
Shenzhen |
China |
Chemical Manufacturing |
1.0 |
|
|
|
Subsidiary |
Shanghai |
China |
Consumer Financial Services |
|
|
|
|
Subsidiary |
Shanghai |
China |
Medical Equipment and Supplies |
|
|
|
|
Subsidiary |
Guangzhou |
China |
Chemical Manufacturing |
|
|
|
|
Subsidiary |
Beijing |
China |
Medical Equipment and Supplies |
|
|
|
|
Subsidiary |
Beijing |
China |
Chemical Manufacturing |
|
|
|
|
Subsidiary |
New Delhi |
India |
Medical Equipment and Supplies |
|
|
|
|
Subsidiary |
Singapore |
Singapore |
Medical Equipment and Supplies |
|
|
|
|
Subsidiary |
Tokyo |
Japan |
Medical Equipment and Supplies |
|
|
|
|
Subsidiary |
Hanoi |
Viet Nam |
Business Services |
|
|
|
Competitors
Report |
|||
|
Company Name |
Location |
Employees |
Ownership |
|
Agfa-Gevaert NV |
Mortsel, Belgium |
11,766 |
Public |
|
CANON INC. |
Ohta-Ku, Suzhou, Japan |
197,386 |
Public |
|
Eastman Kodak Company |
Rochester, New York, United States |
18,800 |
Public |
|
FUJIFILM Holdings Corp |
Tokyo, Japan |
78,862 |
Public |
|
Hewlett-Packard Company |
Palo Alto, California, United States |
324,600 |
Public |
|
KONICA MINOLTA HOLDINGS, INC. |
Chiyoda-ku, Japan |
35,204 |
Public |
|
Koninklijke Philips Electronics NV |
Amsterdam, Netherlands |
124,218 |
Public |
|
Meade Instruments Corp. |
Irvine, California, United States |
155 |
Public |
|
NIKON CORPORATION |
Chiyoda-ku, Japan |
24,409 |
Public |
|
RICOH COMPANY,LTD. |
Tokyo, Japan |
109,014 |
Public |
|
SONY CORPORATION |
Minato-ku, Japan |
168,200 |
Public |
Executive report
|
Board of
Directors |
|
|
|
|
|||
|
Director |
Director/Board Member |
|
|||
|
Director |
Director/Board Member |
|
|||
|
Independent Director |
Director/Board Member |
|
|||
|
||||||
|
Independent Director |
Director/Board Member |
|
|
||
|
||||||
|
Executive Officer, Chief Director of Business Planning, Assistant
Manager of Corporate Center, Director |
Director/Board Member |
|
|
||
|
||||||
|
Independent Director |
Director/Board Member |
|
|
||
|
||||||
|
Executive Vice President, President of Medical Business Group,
President of a Subsidiary, Director |
Director/Board Member |
|
|
||
|
||||||
|
Executive Officer, President of Life & Industrial Business Group,
Director |
Director/Board Member |
|
|
||
|
||||||
|
Senior Managing Executive Officer, President of Asia & Oceania
Supervision Group, General Manager & Chairman of Subsidiary, Director |
Director/Board Member |
|
|
||
|
||||||
|
Managing Executive Officer, Manager of Manufacturing Reform Center,
Director |
Director/Board Member |
|
|
||
|
||||||
|
Managing Executive Officer, President of Subsidiary, Director |
Director/Board Member |
|
|
||
|
||||||
|
Senior Managing Executive Officer, Manager of Research Development
Center, Director |
Director/Board Member |
|
|
||
|
||||||
|
Executives |
|
|
|
|
|||
|
Co-Senior Managing Executive Officer |
Chief Executive Officer |
|
|||
|
President, Chief Executive Officer |
Chief Executive Officer |
|
|||
|
||||||
|
Co-Senior Managing Executive Officer |
Chief Executive Officer |
|
|
||
|
President, Olympus Biotech Corporation |
President |
|
|
||
|
Executive Vice President, President of Medical Business Group,
President of a Subsidiary, Director |
Division Head Executive |
|
|
||
|
||||||
|
Co-Executive Officer |
Operations Executive |
|
|
||
|
Co-Executive Officer |
Operations Executive |
|
|
||
|
Co-Executive Officer |
Operations Executive |
|
|
||
|
Co-Executive Officer |
Operations Executive |
|
|
||
|
Co-Executive Officer |
Operations Executive |
|
|
||
|
Co-Auditor |
Finance Executive |
|
|
||
|
Co-Auditor |
Finance Executive |
|
|
||
|
Corporate Auditor |
Accounting Executive |
|
|
||
|
Corporate Auditor |
Accounting Executive |
|
|
||
|
Executive Officer, Director of Human Resources, Manager of HR
Development Center |
Human Resources Executive |
|
|
||
|
Executive Officer |
Other |
|
|
||
|
Managing Executive Officer |
Other |
|
|
||
|
Executive Officer, Ina Plant Manager |
Other |
|
|
||
|
Executive Officer, Chief Director of MEMS Development |
Other |
|
|
||
|
Executive Officer, Chairman of a Subsidiary |
Other |
|
|
||
|
Executive Officer |
Other |
|
|
||
|
Executive Officer, Chief Director of Precise Technology Development |
Other |
|
|
||
|
Managing Executive Officer, Chief Director of Digital Base Technology |
Other |
|
|
||
|
Executive Officer, Director of PS Business |
Other |
|
|
||
|
Executive Officer |
Other |
|
|
||
|
Executive Officer |
Other |
|
|
||
|
Managing Executive Officer, President of Subsidiary |
Other |
|
|
||
|
Executive Officer |
Other |
|
|
||
|
Executive Officer |
Other |
|
|
||
|
Executive Officer |
Other |
|
|
||
|
Executive Officer, Director of IMS Business |
Other |
|
|
||
Annual
Income Statement
Financials in: USD (mil)
Except for share items (millions) and per share items (actual units)
|
|
31-Mar-2011 |
31-Mar-2010 |
31-Mar-2009 |
31-Mar-2008 |
31-Mar-2007 |
|
Period Length |
12 Months |
12 Months |
12 Months |
12 Months |
12 Months |
|
UpdateType/Date |
Updated Normal |
Updated Normal |
Updated Normal |
Updated Normal |
Updated Normal |
|
Filed Currency |
JPY |
JPY |
JPY |
JPY |
JPY |
|
Exchange Rate
(Period Average) |
85.691434 |
92.941082 |
100.484331 |
114.302336 |
116.944303 |
|
Auditor |
Ernst &
Young LLP |
Ernst &
Young LLP |
KPMG LLP |
KPMG LLP |
Azsa Audit Corp. |
|
Auditor Opinion |
Unqualified |
Unqualified |
Unqualified with
Explanation |
Unqualified |
Unqualified |
|
|
|
|
|
|
|
|
Net Sales |
9,885.5 |
9,501.6 |
9,760.8 |
9,876.2 |
9,079.4 |
|
Revenue |
9,885.5 |
9,501.6 |
9,760.8 |
9,876.2 |
9,079.4 |
|
Total Revenue |
9,885.5 |
9,501.6 |
9,760.8 |
9,876.2 |
9,079.4 |
|
|
|
|
|
|
|
|
Cost of Revenue |
5,362.4 |
5,109.1 |
5,170.8 |
5,418.9 |
5,229.0 |
|
Cost of Revenue, Total |
5,362.4 |
5,109.1 |
5,170.8 |
5,418.9 |
5,229.0 |
|
Gross Profit |
4,523.1 |
4,392.5 |
4,590.0 |
4,457.3 |
3,850.4 |
|
|
|
|
|
|
|
|
Selling/General/Administrative Expense |
1,180.2 |
1,054.1 |
1,314.4 |
1,161.0 |
1,016.8 |
|
Labor & Related Expense |
1,506.4 |
1,433.4 |
1,380.6 |
1,191.4 |
1,065.4 |
|
Advertising Expense |
520.7 |
438.0 |
528.0 |
513.2 |
414.4 |
|
Total Selling/General/Administrative Expenses |
3,207.3 |
2,925.5 |
3,223.0 |
2,865.6 |
2,496.6 |
|
Research & Development |
451.7 |
387.6 |
457.1 |
337.3 |
275.1 |
|
Depreciation |
283.6 |
296.0 |
314.4 |
198.4 |
167.2 |
|
Amortization of Acquisition Costs |
167.9 |
161.4 |
1,009.7 |
70.7 |
67.3 |
|
Depreciation/Amortization |
451.5 |
457.4 |
1,324.1 |
269.1 |
234.5 |
|
Impairment-Assets Held for Use |
0.0 |
14.6 |
18.1 |
9.6 |
13.8 |
|
Impairment-Assets Held for Sale |
12.3 |
65.4 |
157.2 |
13.0 |
15.0 |
|
Other Unusual Expense (Income) |
-13.8 |
-4.6 |
154.4 |
0.0 |
0.0 |
|
Unusual Expense (Income) |
-1.5 |
75.4 |
329.7 |
22.6 |
28.9 |
|
Total Operating Expense |
9,471.4 |
8,954.9 |
10,504.6 |
8,913.5 |
8,264.1 |
|
|
|
|
|
|
|
|
Operating Income |
414.1 |
546.7 |
-743.8 |
962.7 |
815.4 |
|
|
|
|
|
|
|
|
Interest Expense -
Non-Operating |
-148.7 |
-133.6 |
-161.1 |
-121.7 |
-107.5 |
|
Interest Expense, Net Non-Operating |
-148.7 |
-133.6 |
-161.1 |
-121.7 |
-107.5 |
|
Interest Income -
Non-Operating |
10.4 |
12.1 |
24.1 |
28.0 |
15.4 |
|
Investment Income -
Non-Operating |
52.4 |
55.6 |
39.3 |
-16.7 |
-45.0 |
|
Interest/Investment Income - Non-Operating |
62.8 |
67.7 |
63.4 |
11.3 |
-29.7 |
|
Interest Income (Expense) - Net Non-Operating Total |
-85.9 |
-65.9 |
-97.7 |
-110.4 |
-137.1 |
|
Gain (Loss) on Sale of Assets |
31.5 |
512.9 |
0.0 |
15.6 |
0.0 |
|
Other Non-Operating Income (Expense) |
-94.1 |
-66.2 |
-67.0 |
-40.1 |
-49.0 |
|
Other, Net |
-94.1 |
-66.2 |
-67.0 |
-40.1 |
-49.0 |
|
Income Before Tax |
265.6 |
927.5 |
-908.6 |
827.7 |
629.2 |
|
|
|
|
|
|
|
|
Total Income Tax |
174.2 |
411.7 |
257.5 |
321.6 |
223.0 |
|
Income After Tax |
91.4 |
515.8 |
-1,166.1 |
506.1 |
406.2 |
|
|
|
|
|
|
|
|
Minority Interest |
-5.2 |
-1.9 |
23.5 |
1.0 |
2.6 |
|
Net Income Before Extraord Items |
86.1 |
513.9 |
-1,142.6 |
507.2 |
408.7 |
|
Net Income |
86.1 |
513.9 |
-1,142.6 |
507.2 |
408.7 |
|
|
|
|
|
|
|
|
Miscellaneous Earnings Adjustment |
- |
- |
- |
0.0 |
0.0 |
|
Total Adjustments to Net Income |
- |
- |
- |
0.0 |
0.0 |
|
Income Available to Common Excl Extraord Items |
86.1 |
513.9 |
-1,142.6 |
507.2 |
408.7 |
|
|
|
|
|
|
|
|
Income Available to Common Incl Extraord Items |
86.1 |
513.9 |
-1,142.6 |
507.2 |
408.7 |
|
|
|
|
|
|
|
|
Basic/Primary Weighted Average Shares |
268.7 |
269.5 |
267.7 |
270.3 |
270.4 |
|
Basic EPS Excl Extraord Items |
0.32 |
1.91 |
-4.27 |
1.88 |
1.51 |
|
Basic/Primary EPS Incl Extraord Items |
0.32 |
1.91 |
-4.27 |
1.88 |
1.51 |
|
Dilution Adjustment |
0.0 |
0.0 |
0.0 |
-0.1 |
0.0 |
|
Diluted Net Income |
86.1 |
513.9 |
-1,142.6 |
507.1 |
408.7 |
|
Diluted Weighted Average Shares |
268.7 |
269.5 |
267.7 |
270.3 |
270.4 |
|
Diluted EPS Excl Extraord Items |
0.32 |
1.91 |
-4.27 |
1.88 |
1.51 |
|
Diluted EPS Incl Extraord Items |
0.32 |
1.91 |
-4.27 |
1.88 |
1.51 |
|
Dividends per Share - Common Stock Primary Issue |
0.35 |
0.32 |
0.20 |
0.35 |
0.30 |
|
Gross Dividends - Common Stock |
94.0 |
87.1 |
53.2 |
94.6 |
80.9 |
|
Interest Expense, Supplemental |
148.7 |
133.6 |
161.1 |
121.7 |
20.5 |
|
Depreciation, Supplemental |
401.6 |
465.6 |
445.9 |
328.3 |
260.0 |
|
Total Special Items |
135.0 |
-276.2 |
1,339.4 |
77.7 |
96.2 |
|
Normalized Income Before Tax |
400.6 |
651.3 |
430.8 |
905.4 |
725.3 |
|
|
|
|
|
|
|
|
Effect of Special Items on Income Taxes |
-11.5 |
-194.2 |
115.4 |
2.7 |
10.2 |
|
Inc Tax Ex Impact of Sp Items |
162.7 |
217.5 |
372.8 |
324.3 |
233.3 |
|
Normalized Income After Tax |
237.9 |
433.8 |
57.9 |
581.1 |
492.1 |
|
|
|
|
|
|
|
|
Normalized Inc. Avail to Com. |
232.6 |
431.9 |
81.4 |
582.1 |
494.7 |
|
|
|
|
|
|
|
|
Basic Normalized EPS |
0.87 |
1.60 |
0.30 |
2.15 |
1.83 |
|
Diluted Normalized EPS |
0.87 |
1.60 |
0.30 |
2.15 |
1.83 |
|
Amort of Acquisition Costs, Supplemental |
167.9 |
161.4 |
1,009.7 |
70.7 |
67.3 |
|
Advertising Expense, Supplemental |
520.7 |
438.0 |
528.0 |
513.2 |
414.4 |
|
Research & Development Exp, Supplemental |
785.2 |
665.5 |
696.7 |
576.8 |
474.8 |
|
Reported Operating Profit |
412.6 |
647.2 |
344.2 |
985.3 |
844.2 |
|
Reported Ordinary Profit |
258.5 |
485.4 |
183.0 |
814.4 |
651.8 |
|
Normalized EBIT |
412.6 |
622.1 |
-414.1 |
985.3 |
844.2 |
|
Normalized EBITDA |
982.1 |
1,249.0 |
1,041.4 |
1,384.2 |
1,171.5 |
|
Interest Cost - Domestic |
47.0 |
41.1 |
35.1 |
31.8 |
29.6 |
|
Service Cost - Domestic |
76.9 |
68.9 |
66.1 |
56.0 |
55.0 |
|
Prior Service Cost - Domestic |
-12.5 |
-8.6 |
-7.8 |
-6.8 |
-9.5 |
|
Expected Return on Assets - Domestic |
-64.0 |
-55.3 |
-56.9 |
-53.4 |
-47.2 |
|
Actuarial Gains and Losses - Domestic |
46.1 |
54.2 |
18.6 |
4.7 |
23.0 |
|
Domestic Pension Plan Expense |
93.4 |
100.3 |
55.0 |
32.4 |
50.9 |
|
Defined Contribution Expense - Domestic |
3.1 |
- |
- |
- |
- |
|
Total Pension Expense |
96.5 |
100.3 |
55.0 |
32.4 |
50.9 |
|
Discount Rate - Domestic |
2.00% |
2.00% |
2.00% |
2.00% |
2.00% |
|
Expected Rate of Return - Domestic |
4.00% |
4.00% |
4.00% |
4.00% |
4.00% |
|
Total Plan Interest Cost |
47.0 |
41.1 |
35.1 |
31.8 |
29.6 |
|
Total Plan Service Cost |
76.9 |
68.9 |
66.1 |
56.0 |
55.0 |
|
Total Plan Expected Return |
-64.0 |
-55.3 |
-56.9 |
-53.4 |
-47.2 |
Annual
Balance Sheet
Financials in: USD (mil)
|
|
31-Mar-2011 |
31-Mar-2010 |
31-Mar-2009 |
31-Mar-2008 |
31-Mar-2007 |
|
UpdateType/Date |
Updated Normal |
Updated Normal |
Updated Normal |
Updated Normal |
Updated Normal |
|
Filed Currency |
JPY |
JPY |
JPY |
JPY |
JPY |
|
Exchange Rate |
82.88 |
93.44 |
98.77 |
99.535 |
118.075 |
|
Auditor |
Ernst &
Young LLP |
Ernst &
Young LLP |
KPMG LLP |
KPMG LLP |
Azsa Audit Corp. |
|
Auditor Opinion |
Unqualified |
Unqualified |
Unqualified with
Explanation |
Unqualified |
Unqualified |
|
|
|
|
|
|
|
|
Cash & Equivalents |
2,576.7 |
2,213.0 |
1,385.8 |
1,590.2 |
1,834.3 |
|
Short Term Investments |
- |
0.0 |
2.0 |
0.0 |
70.7 |
|
Cash and Short Term Investments |
2,576.7 |
2,213.0 |
1,387.8 |
1,590.2 |
1,905.0 |
|
Accounts Receivable -
Trade, Gross |
1,703.4 |
1,650.7 |
1,622.5 |
1,944.6 |
1,633.3 |
|
Provision for Doubtful
Accounts |
-31.9 |
-29.3 |
-44.5 |
-31.2 |
-28.6 |
|
Trade Accounts Receivable - Net |
1,671.4 |
1,621.4 |
1,578.1 |
1,913.4 |
1,604.7 |
|
Total Receivables, Net |
1,671.4 |
1,621.4 |
1,578.1 |
1,913.4 |
1,604.7 |
|
Inventories - Finished Goods |
666.6 |
610.5 |
594.1 |
655.3 |
- |
|
Inventories - Work In Progress |
240.8 |
202.4 |
214.9 |
267.3 |
- |
|
Inventories - Raw Materials |
215.4 |
157.7 |
167.8 |
190.8 |
- |
|
Total Inventory |
1,122.8 |
970.6 |
976.9 |
1,113.4 |
760.9 |
|
Deferred Income Tax - Current Asset |
393.0 |
418.1 |
373.0 |
368.9 |
273.7 |
|
Other Current Assets |
675.0 |
479.8 |
491.0 |
472.5 |
307.1 |
|
Other Current Assets, Total |
1,068.0 |
897.9 |
864.0 |
841.4 |
580.9 |
|
Total Current Assets |
6,438.9 |
5,702.9 |
4,806.8 |
5,458.4 |
4,851.5 |
|
|
|
|
|
|
|
|
Buildings |
1,641.8 |
1,476.7 |
1,462.1 |
1,268.5 |
1,088.3 |
|
Land/Improvements |
234.6 |
204.0 |
201.0 |
213.9 |
158.7 |
|
Machinery/Equipment |
2,490.6 |
2,247.7 |
2,254.0 |
2,133.2 |
1,700.0 |
|
Construction in
Progress |
34.2 |
26.4 |
34.3 |
64.3 |
9.4 |
|
Leases |
92.4 |
62.1 |
69.0 |
0.0 |
- |
|
Property/Plant/Equipment - Gross |
4,493.7 |
4,016.9 |
4,020.5 |
3,679.9 |
2,956.3 |
|
Accumulated Depreciation |
-2,772.9 |
-2,470.5 |
-2,369.0 |
-2,172.5 |
-1,769.9 |
|
Property/Plant/Equipment - Net |
1,720.9 |
1,546.4 |
1,651.4 |
1,507.4 |
1,186.4 |
|
Goodwill, Net |
2,117.2 |
2,076.9 |
1,827.9 |
3,012.0 |
666.7 |
|
Intangibles, Net |
880.0 |
766.1 |
851.3 |
1,047.2 |
183.2 |
|
LT Investment - Affiliate Companies |
35.6 |
108.1 |
- |
- |
- |
|
LT Investments - Other |
680.4 |
1,393.1 |
1,287.3 |
1,947.5 |
1,834.7 |
|
Long Term Investments |
716.0 |
1,501.2 |
1,287.3 |
1,947.5 |
1,834.7 |
|
Note Receivable - Long Term |
69.2 |
42.7 |
38.6 |
32.9 |
4.8 |
|
Deferred Income Tax - Long Term Asset |
184.9 |
101.6 |
158.6 |
97.1 |
81.4 |
|
Other Long Term Assets |
705.9 |
593.5 |
579.1 |
544.5 |
438.0 |
|
Other Long Term Assets, Total |
890.8 |
695.1 |
737.7 |
641.6 |
519.4 |
|
Total Assets |
12,832.9 |
12,331.2 |
11,201.0 |
13,646.9 |
9,246.7 |
|
|
|
|
|
|
|
|
Accounts Payable |
829.1 |
792.7 |
674.3 |
839.9 |
849.1 |
|
Accrued Expenses |
719.9 |
640.2 |
664.1 |
828.5 |
656.6 |
|
Notes Payable/Short Term Debt |
773.3 |
803.4 |
824.2 |
3,134.2 |
1,185.5 |
|
Current Portion - Long Term Debt/Capital Leases |
765.5 |
425.6 |
374.8 |
623.2 |
73.2 |
|
Income Taxes Payable |
114.0 |
182.9 |
85.1 |
141.9 |
140.9 |
|
Other Payables |
441.9 |
421.1 |
557.9 |
765.4 |
0.0 |
|
Other Current Liabilities |
289.0 |
291.9 |
281.2 |
322.4 |
568.2 |
|
Other Current liabilities, Total |
845.0 |
895.9 |
924.2 |
1,229.7 |
709.1 |
|
Total Current Liabilities |
3,932.8 |
3,557.8 |
3,461.6 |
6,655.5 |
3,473.4 |
|
|
|
|
|
|
|
|
Long Term Debt |
6,289.2 |
5,859.5 |
5,496.2 |
2,840.9 |
2,656.0 |
|
Capital Lease Obligations |
- |
33.6 |
31.9 |
- |
- |
|
Total Long Term Debt |
6,289.2 |
5,893.0 |
5,528.1 |
2,840.9 |
2,656.0 |
|
Total Debt |
7,828.0 |
7,122.0 |
6,727.1 |
6,598.2 |
3,914.6 |
|
|
|
|
|
|
|
|
Deferred Income Tax - LT Liability |
259.8 |
315.8 |
284.2 |
306.3 |
0.0 |
|
Deferred Income Tax |
259.8 |
315.8 |
284.2 |
306.3 |
0.0 |
|
Minority Interest |
37.4 |
79.8 |
75.1 |
115.8 |
90.3 |
|
Reserves |
- |
- |
0.0 |
4.5 |
3.8 |
|
Pension Benefits - Underfunded |
228.7 |
214.4 |
191.1 |
104.9 |
81.4 |
|
Other Long Term Liabilities |
109.4 |
28.9 |
27.1 |
38.9 |
111.3 |
|
Other Liabilities, Total |
338.1 |
243.4 |
218.2 |
148.3 |
196.6 |
|
Total Liabilities |
10,857.4 |
10,089.8 |
9,567.2 |
10,066.8 |
6,416.2 |
|
|
|
|
|
|
|
|
Common Stock |
583.2 |
517.3 |
489.3 |
485.6 |
409.3 |
|
Common Stock |
583.2 |
517.3 |
489.3 |
485.6 |
409.3 |
|
Additional Paid-In Capital |
661.1 |
590.4 |
739.6 |
733.9 |
618.7 |
|
Retained Earnings (Accumulated Deficit) |
2,056.5 |
1,800.5 |
1,117.8 |
2,389.3 |
1,618.6 |
|
Treasury Stock - Common |
-133.9 |
-44.3 |
-130.3 |
-26.5 |
-19.2 |
|
Unrealized Gain (Loss) |
69.6 |
92.7 |
-28.2 |
63.8 |
134.6 |
|
Translation Adjustment |
-1,216.8 |
-715.2 |
-554.4 |
-66.0 |
68.4 |
|
Minimum Pension Liability Adjustment |
-44.0 |
0.0 |
- |
- |
- |
|
Other Equity, Total |
-1,260.8 |
-715.2 |
-554.4 |
-66.0 |
68.4 |
|
Total Equity |
1,975.6 |
2,241.4 |
1,633.7 |
3,580.2 |
2,830.5 |
|
|
|
|
|
|
|
|
Total Liabilities & Shareholders’ Equity |
12,832.9 |
12,331.2 |
11,201.0 |
13,646.9 |
9,246.7 |
|
|
|
|
|
|
|
|
Shares Outstanding - Common Stock Primary
Issue |
266.9 |
270.0 |
267.2 |
270.2 |
270.3 |
|
Total Common Shares Outstanding |
266.9 |
270.0 |
267.2 |
270.2 |
270.3 |
|
Treasury Shares - Common Stock Primary Issue |
4.3 |
1.3 |
4.1 |
1.0 |
1.0 |
|
Employees |
34,391 |
35,376 |
36,503 |
35,772 |
32,958 |
|
Number of Common Shareholders |
17,720 |
14,788 |
8,473 |
7,693 |
7,214 |
|
Total Long Term Debt, Supplemental |
7,072.8 |
6,275.8 |
5,860.2 |
3,464.0 |
2,729.1 |
|
Long Term Debt Maturing within 1 Year |
765.5 |
416.3 |
364.1 |
623.2 |
73.2 |
|
Long Term Debt Maturing in Year 2 |
583.2 |
680.9 |
661.5 |
353.8 |
546.7 |
|
Long Term Debt Maturing in Year 3 |
1,260.1 |
524.7 |
596.5 |
701.2 |
308.1 |
|
Long Term Debt Maturing in Year 4 |
1,064.4 |
1,080.8 |
437.2 |
577.3 |
563.8 |
|
Long Term Debt Maturing in Year 5 |
624.7 |
939.0 |
1,010.8 |
432.3 |
485.9 |
|
Long Term Debt Maturing in 2-3 Years |
1,843.4 |
1,205.7 |
1,258.1 |
1,054.9 |
854.8 |
|
Long Term Debt Maturing in 4-5 Years |
1,689.2 |
2,019.9 |
1,448.0 |
1,009.6 |
1,049.7 |
|
Long Term Debt Matur. in Year 6 & Beyond |
2,774.8 |
2,633.9 |
2,790.1 |
776.3 |
751.4 |
|
Total Capital Leases, Supplemental |
60.6 |
42.8 |
42.6 |
- |
- |
|
Capital Lease Payments Due in Year 1 |
13.5 |
9.3 |
10.7 |
- |
- |
|
Capital Lease Payments Due in Year 2 |
14.6 |
8.3 |
10.0 |
- |
- |
|
Capital Lease Payments Due in Year 3 |
11.5 |
6.7 |
8.3 |
- |
- |
|
Capital Lease Payments Due in Year 4 |
9.1 |
5.6 |
6.4 |
- |
- |
|
Capital Lease Payments Due in Year 5 |
7.8 |
4.1 |
3.9 |
- |
- |
|
Capital Lease Payments Due in 2-3 Years |
26.1 |
15.0 |
18.3 |
- |
- |
|
Capital Lease Payments Due in 4-5 Years |
16.9 |
9.7 |
10.4 |
- |
- |
|
Cap. Lease Pymts. Due in Year 6 & Beyond |
4.2 |
8.9 |
3.2 |
- |
- |
|
Pension Obligation - Domestic |
1,566.7 |
1,453.1 |
1,285.8 |
1,245.8 |
1,045.6 |
|
Plan Assets - Domestic |
1,504.9 |
1,321.4 |
1,065.1 |
1,224.9 |
1,086.1 |
|
Funded Status - Domestic |
-61.9 |
-131.7 |
-220.7 |
-20.9 |
40.6 |
|
Total Funded Status |
-61.9 |
-131.7 |
-220.7 |
-20.9 |
40.6 |
|
Discount Rate - Domestic |
2.00% |
2.00% |
2.00% |
2.00% |
2.00% |
|
Expected Rate of Return - Domestic |
4.00% |
4.00% |
4.00% |
4.00% |
4.00% |
|
Prepaid Benefits - Domestic |
277.6 |
233.4 |
217.4 |
154.4 |
60.8 |
|
Accrued Liabilities - Domestic |
-226.8 |
-212.8 |
-189.8 |
-103.7 |
-80.7 |
|
Other Assets, Net - Domestic |
323.0 |
155.0 |
248.4 |
71.7 |
-60.4 |
|
Net Assets Recognized on Balance Sheet |
373.8 |
175.5 |
276.0 |
122.4 |
-80.3 |
|
Total Plan Obligations |
1,566.7 |
1,453.1 |
1,285.8 |
1,245.8 |
1,045.6 |
|
Total Plan Assets |
1,504.9 |
1,321.4 |
1,065.1 |
1,224.9 |
1,086.1 |
Annual
Cash Flows
Financials in: USD (mil)
|
|
31-Mar-2011 |
31-Mar-2010 |
31-Mar-2009 |
31-Mar-2008 |
31-Mar-2007 |
|
Period Length |
12 Months |
12 Months |
12 Months |
12 Months |
12 Months |
|
UpdateType/Date |
Updated Normal |
Updated Normal |
Updated Normal |
Updated Normal |
Updated Normal |
|
Filed Currency |
JPY |
JPY |
JPY |
JPY |
JPY |
|
Exchange Rate
(Period Average) |
85.691434 |
92.941082 |
100.484331 |
114.302336 |
116.944303 |
|
Auditor |
Ernst &
Young LLP |
Ernst &
Young LLP |
KPMG LLP |
KPMG LLP |
Azsa Audit Corp. |
|
Auditor Opinion |
Unqualified |
Unqualified |
Unqualified with
Explanation |
Unqualified |
Unqualified |
|
|
|
|
|
|
|
|
Income Before Tax |
265.6 |
927.5 |
-908.6 |
827.7 |
629.2 |
|
Depreciation |
401.6 |
465.6 |
445.9 |
328.3 |
260.0 |
|
Impairment Loss |
0.0 |
14.6 |
18.1 |
9.6 |
13.8 |
|
Amort-Goodwill |
167.9 |
161.4 |
1,009.7 |
70.7 |
67.3 |
|
Gain on negative goodwill |
-28.1 |
0.0 |
- |
- |
- |
|
Res-Accr.Retire Bft. |
-1.8 |
25.6 |
89.6 |
7.8 |
1.6 |
|
Prepaid Pension Cost |
-18.4 |
-8.8 |
-88.1 |
-76.6 |
5.8 |
|
Product Warranty |
-13.7 |
10.4 |
3.6 |
13.2 |
29.8 |
|
Int. and Div. Income |
-19.5 |
-20.0 |
-34.1 |
-36.4 |
-19.8 |
|
Interest Expense |
148.7 |
133.6 |
161.1 |
121.7 |
107.5 |
|
Gain/Loss-Equity Method |
-6.7 |
-3.3 |
17.0 |
24.2 |
20.5 |
|
Gains on transfer of business |
-31.5 |
-512.9 |
0.0 |
- |
- |
|
Gains on equity changes |
- |
- |
0.0 |
-16.7 |
0.0 |
|
Gain on sale of Trust |
- |
- |
- |
- |
0.0 |
|
G/L on prior period adjustments |
- |
0.0 |
154.4 |
0.0 |
- |
|
G/L Sale of Affiliates' Stock |
0.9 |
-26.1 |
0.0 |
-2.7 |
-1.4 |
|
Val.Loss-Invest.Sec |
12.3 |
65.4 |
157.2 |
13.0 |
15.0 |
|
Account Receivable |
116.3 |
-114.7 |
167.1 |
-34.6 |
-149.1 |
|
Inventories |
-40.3 |
-29.6 |
59.9 |
-125.2 |
58.3 |
|
Other Payable |
-44.6 |
-14.9 |
-56.4 |
139.4 |
0.0 |
|
Account Payable |
-66.9 |
142.0 |
-142.7 |
-80.8 |
98.6 |
|
Accrued Expense |
18.3 |
-13.5 |
-125.6 |
-0.3 |
135.7 |
|
Other Opera.Activity |
14.5 |
-47.9 |
-22.7 |
42.1 |
-17.3 |
|
Int. and Div. Rcvd. |
19.9 |
20.8 |
34.2 |
36.0 |
20.0 |
|
Interest Paid |
-152.7 |
-134.1 |
-160.6 |
-121.3 |
-106.5 |
|
Taxes Paid |
-357.8 |
-220.6 |
-364.8 |
-360.2 |
-242.0 |
|
Newly Consolid. Sub. |
- |
- |
- |
5.1 |
1.2 |
|
Excluded from Consolidation |
- |
- |
- |
-2.1 |
-0.5 |
|
Cash from Operating Activities |
384.1 |
820.4 |
414.3 |
781.7 |
927.7 |
|
|
|
|
|
|
|
|
Deposited-Time Depo |
-56.1 |
-50.9 |
-56.0 |
-340.8 |
-353.8 |
|
Withdrawn-Time Depo |
61.0 |
61.4 |
382.5 |
365.5 |
56.5 |
|
Purch-Marketable Sec |
- |
- |
- |
0.0 |
-71.5 |
|
Sale-Marketable Sec. |
- |
- |
0.0 |
20.6 |
10.8 |
|
Capital Expenditure |
-236.2 |
-425.0 |
-436.2 |
-419.5 |
-352.9 |
|
Sale of PPE |
- |
- |
0.0 |
20.2 |
5.5 |
|
Purchase of intangible assets |
-109.5 |
-58.1 |
-55.9 |
0.0 |
- |
|
Purch-Investment Sec |
-43.7 |
-53.4 |
-53.1 |
-106.1 |
-131.7 |
|
Sale/redempt.LT inv't in sec. |
826.9 |
39.9 |
403.4 |
56.8 |
37.3 |
|
Purchase of consolid. subs.' securities |
-143.9 |
-4.0 |
-1.3 |
-2,031.8 |
-20.6 |
|
Outflow due to sale subsidiaries' sec. |
0.0 |
-0.5 |
-1.2 |
0.0 |
-2.0 |
|
Sale of consol.subsidiaries' sec. |
2.3 |
189.1 |
0.0 |
5.3 |
0.0 |
|
Sale subsidiaries' securities |
- |
- |
0.0 |
1.7 |
- |
|
Purchase of subsidiaries' sec. |
-67.9 |
-644.4 |
-402.0 |
0.0 |
- |
|
Purchase of subs.' additioanl shares |
- |
- |
0.0 |
-160.6 |
0.0 |
|
Loans made |
-41.8 |
-20.5 |
-15.2 |
-86.7 |
0.0 |
|
Loans collected |
1.4 |
3.6 |
30.6 |
13.5 |
0.0 |
|
Purchase of businesses |
-76.2 |
-73.7 |
0.0 |
- |
- |
|
Disposal of businesses invested |
67.6 |
800.5 |
0.0 |
- |
- |
|
Sale of Trust |
- |
- |
- |
- |
0.0 |
|
Other Inv. Activity |
9.1 |
10.3 |
-2.0 |
-0.3 |
-2.6 |
|
Cash from Investing Activities |
193.2 |
-225.6 |
-206.3 |
-2,662.3 |
-825.0 |
|
|
|
|
|
|
|
|
ST Debt, Net |
-163.1 |
-48.8 |
-2,171.7 |
1,336.8 |
-171.2 |
|
Issued-LT Debt |
402.6 |
1,028.9 |
2,584.7 |
324.6 |
164.5 |
|
Repaid-LT Debt |
-220.7 |
-525.8 |
-334.4 |
-131.8 |
-86.7 |
|
Issue-Corporate Bond |
0.0 |
2.2 |
449.5 |
0.9 |
379.5 |
|
Stock Issued |
- |
- |
- |
- |
0.0 |
|
Redemp-Corp.Bond |
-233.9 |
-218.4 |
-350.3 |
-0.8 |
-214.6 |
|
Paid In by Minority |
- |
0.0 |
1.5 |
16.8 |
9.4 |
|
Treasury stock purchased |
-116.8 |
0.0 |
-101.9 |
0.0 |
- |
|
Dividend Paid |
-94.5 |
-43.6 |
-107.0 |
-104.0 |
-59.0 |
|
Div.Paid to Minority |
-0.5 |
-1.8 |
-1.1 |
-0.8 |
0.0 |
|
Other Finan.Activity |
-9.2 |
-5.9 |
-6.5 |
-3.2 |
-3.2 |
|
Cash from Financing Activities |
-436.0 |
186.7 |
-37.3 |
1,438.3 |
18.7 |
|
|
|
|
|
|
|
|
Foreign Exchange Effects |
-69.2 |
-31.3 |
-44.1 |
-38.5 |
11.1 |
|
Net Change in Cash |
72.1 |
750.2 |
126.5 |
-480.8 |
132.5 |
|
|
|
|
|
|
|
|
Net Cash - Beginning Balance |
2,383.0 |
1,434.1 |
1,194.3 |
1,529.3 |
1,362.2 |
|
Net Cash - Ending Balance |
2,455.1 |
2,184.3 |
1,320.8 |
1,048.5 |
1,494.7 |
|
Cash Interest Paid |
152.7 |
134.1 |
160.6 |
121.3 |
106.5 |
|
Cash Taxes Paid |
357.8 |
220.6 |
364.8 |
360.2 |
242.0 |
Annual
Income Statement
|
Financials in:
USD (mil) Except for share
items (millions) and per share items (actual units) |
|
|
31-Mar-2011 |
31-Mar-2010 |
31-Mar-2009 |
31-Mar-2008 |
31-Mar-2007 |
|
Period Length |
12 Months |
12 Months |
12 Months |
12 Months |
12 Months |
|
UpdateType/Date |
Updated Normal |
Updated Normal |
Updated Normal |
Updated Normal |
Updated Normal |
|
Filed Currency |
JPY |
JPY |
JPY |
JPY |
JPY |
|
Exchange Rate
(Period Average) |
85.691434 |
92.941082 |
100.484331 |
114.302336 |
116.944303 |
|
Auditor |
Ernst &
Young LLP |
Ernst &
Young LLP |
KPMG LLP |
KPMG LLP |
Azsa Audit Corp. |
|
Auditor Opinion |
Unqualified |
Unqualified |
Unqualified with
Explanation |
Unqualified |
Unqualified |
|
|
|
|
|
|
|
|
Net Sales |
9,885.5 |
9,501.6 |
9,760.8 |
9,876.2 |
9,079.4 |
|
Total Revenue |
9,885.5 |
9,501.6 |
9,760.8 |
9,876.2 |
9,079.4 |
|
|
|
|
|
|
|
|
Cost of Sales |
5,362.4 |
5,109.1 |
5,170.8 |
5,418.9 |
5,229.0 |
|
Advertising &
sale promotion expenses |
520.7 |
438.0 |
528.0 |
513.2 |
414.4 |
|
Provision for
doubtful accounts (SGA) |
- |
1.0 |
23.0 |
4.2 |
- |
|
Salaries |
1,197.2 |
1,133.0 |
1,133.7 |
917.9 |
804.9 |
|
Bonuses |
221.2 |
202.2 |
192.6 |
245.9 |
208.9 |
|
Accrued Retirement
Expenses |
88.0 |
98.2 |
53.7 |
27.1 |
51.1 |
|
Reserve for
officers retirement |
- |
- |
0.6 |
0.4 |
0.4 |
|
Amortization of
Consolidation Adjustment |
167.9 |
136.3 |
251.4 |
70.7 |
67.3 |
|
Research &
Development |
451.7 |
387.6 |
457.1 |
337.3 |
275.1 |
|
Depreciation |
283.6 |
296.0 |
314.4 |
198.4 |
167.2 |
|
Other SGA |
1,180.2 |
1,053.1 |
1,291.4 |
1,156.8 |
1,016.8 |
|
SP Compensation
for Delay |
- |
- |
- |
- |
0.0 |
|
SP Gain on
negative goodwill |
-28.1 |
0.0 |
- |
- |
- |
|
SP Other Special
Gains |
0.0 |
-11.4 |
0.0 |
- |
- |
|
SP Impairment Loss |
0.0 |
14.6 |
18.1 |
9.6 |
13.8 |
|
SP Valuation
Loss-Invest.Sec |
12.3 |
65.4 |
157.2 |
13.0 |
15.0 |
|
SP Loss on step
acquisitions |
3.6 |
0.0 |
- |
- |
- |
|
SP L on adjust.
for acct. assets change |
3.6 |
0.0 |
- |
- |
- |
|
SP Loss on
disaster |
7.1 |
0.0 |
- |
- |
- |
|
SP Amort. of
consol differences |
0.0 |
25.1 |
758.3 |
0.0 |
- |
|
SP L. on prior
year's adjustment |
- |
0.0 |
154.4 |
0.0 |
- |
|
SP Debt Guarantee
Reserve |
- |
- |
- |
0.0 |
0.0 |
|
SP Other Special
Losses |
0.0 |
6.8 |
0.0 |
- |
- |
|
Total Operating
Expense |
9,471.4 |
8,954.9 |
10,504.6 |
8,913.5 |
8,264.1 |
|
|
|
|
|
|
|
|
SP Gain Sale
Affiliate Stock |
0.7 |
27.3 |
0.0 |
2.7 |
1.4 |
|
SP Sale Gain-Fixed
Asst |
- |
- |
0.0 |
12.9 |
0.0 |
|
SP
Change-Eqty.Method |
- |
- |
0.0 |
16.7 |
0.0 |
|
SP Gain on
Business Transfer |
31.5 |
512.9 |
0.0 |
2.6 |
0.0 |
|
SP Sale
Gain-Invest.Sec |
11.1 |
7.7 |
6.9 |
1.0 |
4.9 |
|
SP Gain Sale Trust |
- |
- |
- |
- |
0.0 |
|
SP Loss Sale
Affiliate Stock |
-1.6 |
-1.2 |
0.0 |
- |
- |
|
SP Sale
Loss-Invest.Sec |
-36.0 |
-4.2 |
-10.5 |
0.0 |
- |
|
NOP Interest
Income |
10.4 |
12.1 |
24.1 |
28.0 |
15.4 |
|
NOP Dividend
Income |
9.1 |
8.0 |
10.0 |
8.4 |
4.4 |
|
NOP Royalty income |
3.8 |
3.8 |
3.5 |
1.1 |
3.8 |
|
NOP Exchange Gain |
30.5 |
14.7 |
49.8 |
4.0 |
0.0 |
|
NOP Gain Sale of
Investment Securities |
31.9 |
0.0 |
- |
- |
0.0 |
|
NOP Gain-Equity
Method |
6.7 |
3.3 |
0.0 |
- |
- |
|
NOP Rent Income |
- |
- |
- |
- |
0.0 |
|
NOP Other Non-op.
Income |
32.4 |
26.1 |
28.2 |
37.1 |
30.5 |
|
NOP Interest
Expense |
-148.7 |
-133.6 |
-161.1 |
-121.7 |
-107.5 |
|
NOP Exchange Loss |
- |
- |
- |
0.0 |
-35.2 |
|
NOP Loss-Equity
Method |
- |
0.0 |
-17.0 |
-24.2 |
-20.5 |
|
NOP L on equity
invt. Assoc |
- |
- |
0.0 |
-25.3 |
0.0 |
|
NOP Other
Non-op.Expense |
-130.2 |
-96.2 |
-98.8 |
-78.4 |
-83.4 |
|
Net Income
Before Taxes |
265.6 |
927.5 |
-908.6 |
827.7 |
629.2 |
|
|
|
|
|
|
|
|
Provision for Income Taxes |
174.2 |
411.7 |
257.5 |
321.6 |
223.0 |
|
Net Income After
Taxes |
91.4 |
515.8 |
-1,166.1 |
506.1 |
406.2 |
|
|
|
|
|
|
|
|
Minority Interest |
-5.2 |
-1.9 |
23.5 |
1.0 |
2.6 |
|
Net Income
Before Extra. Items |
86.1 |
513.9 |
-1,142.6 |
507.2 |
408.7 |
|
Net Income |
86.1 |
513.9 |
-1,142.6 |
507.2 |
408.7 |
|
|
|
|
|
|
|
|
Directors' Bonus |
- |
- |
- |
0.0 |
0.0 |
|
Income Available
to Com Excl ExtraOrd |
86.1 |
513.9 |
-1,142.6 |
507.2 |
408.7 |
|
|
|
|
|
|
|
|
Income Available
to Com Incl ExtraOrd |
86.1 |
513.9 |
-1,142.6 |
507.2 |
408.7 |
|
|
|
|
|
|
|
|
Basic Weighted Average Shares |
268.7 |
269.5 |
267.7 |
270.3 |
270.4 |
|
Basic EPS Excluding ExtraOrdinary Items |
0.32 |
1.91 |
-4.27 |
1.88 |
1.51 |
|
Basic EPS Including ExtraOrdinary Item |
0.32 |
1.91 |
-4.27 |
1.88 |
1.51 |
|
Dilution Adjustment |
0.0 |
0.0 |
0.0 |
-0.1 |
0.0 |
|
Diluted Net Income |
86.1 |
513.9 |
-1,142.6 |
507.1 |
408.7 |
|
Diluted Weighted Average Shares |
268.7 |
269.5 |
267.7 |
270.3 |
270.4 |
|
Diluted EPS Excluding ExtraOrd Items |
0.32 |
1.91 |
-4.27 |
1.88 |
1.51 |
|
Diluted EPS Including ExtraOrd Items |
0.32 |
1.91 |
-4.27 |
1.88 |
1.51 |
|
DPS-Common Stock |
0.35 |
0.32 |
0.20 |
0.35 |
0.30 |
|
Gross Dividends - Common Stock |
94.0 |
87.1 |
53.2 |
94.6 |
80.9 |
|
Normalized
Income Before Taxes |
400.6 |
651.3 |
430.8 |
905.4 |
725.3 |
|
|
|
|
|
|
|
|
Inc Tax Ex Impact of Sp Items |
162.7 |
217.5 |
372.8 |
324.3 |
233.3 |
|
Normalized
Income After Taxes |
237.9 |
433.8 |
57.9 |
581.1 |
492.1 |
|
|
|
|
|
|
|
|
Normalized Inc.
Avail to Com. |
232.6 |
431.9 |
81.4 |
582.1 |
494.7 |
|
|
|
|
|
|
|
|
Basic Normalized EPS |
0.87 |
1.60 |
0.30 |
2.15 |
1.83 |
|
Diluted Normalized EPS |
0.87 |
1.60 |
0.30 |
2.15 |
1.83 |
|
Interest Expense |
148.7 |
133.6 |
161.1 |
121.7 |
20.5 |
|
Amort of Goodwill |
167.9 |
161.4 |
1,009.7 |
70.7 |
67.3 |
|
R & D Expenses (SGA) |
451.7 |
387.6 |
457.1 |
337.3 |
275.1 |
|
R & D Expenses (COGS) |
333.5 |
277.9 |
239.7 |
239.5 |
199.8 |
|
Depreciation |
401.6 |
465.6 |
445.9 |
328.3 |
260.0 |
|
Advertising & sale promotion expenses |
520.7 |
438.0 |
528.0 |
513.2 |
414.4 |
|
Reported Operating Profit |
412.6 |
647.2 |
344.2 |
985.3 |
844.2 |
|
Reported Ordinary Profit |
258.5 |
485.4 |
183.0 |
814.4 |
651.8 |
|
Service Cost |
76.9 |
68.9 |
66.1 |
56.0 |
55.0 |
|
Interest Cost |
47.0 |
41.1 |
35.1 |
31.8 |
29.6 |
|
Expected Return on Plan Assets |
-64.0 |
-55.3 |
-56.9 |
-53.4 |
-47.2 |
|
Prior Service Cost |
-12.5 |
-8.6 |
-7.8 |
-6.8 |
-9.5 |
|
Actuarial Gains and Losses |
46.1 |
54.2 |
18.6 |
4.7 |
23.0 |
|
Domestic Pension Plan Expense |
93.4 |
100.3 |
55.0 |
32.4 |
50.9 |
|
Defined Contribution Expense |
3.1 |
- |
- |
- |
- |
|
Total Pension Expense |
96.5 |
100.3 |
55.0 |
32.4 |
50.9 |
|
Discount rate |
2.00% |
2.00% |
2.00% |
2.00% |
2.00% |
|
Expected rate of return |
4.00% |
4.00% |
4.00% |
4.00% |
4.00% |
Annual
Balance Sheet
Financials in: USD (mil)
|
|
31-Mar-2011 |
31-Mar-2010 |
31-Mar-2009 |
31-Mar-2008 |
31-Mar-2007 |
|
UpdateType/Date |
Updated Normal |
Updated Normal |
Updated Normal |
Updated Normal |
Updated Normal |
|
Filed Currency |
JPY |
JPY |
JPY |
JPY |
JPY |
|
Exchange Rate |
82.88 |
93.44 |
98.77 |
99.535 |
118.075 |
|
Auditor |
Ernst &
Young LLP |
Ernst &
Young LLP |
KPMG LLP |
KPMG LLP |
Azsa Audit Corp. |
|
Auditor Opinion |
Unqualified |
Unqualified |
Unqualified with
Explanation |
Unqualified |
Unqualified |
|
|
|
|
|
|
|
|
Cash and Deposit |
2,576.7 |
2,213.0 |
1,385.8 |
1,590.2 |
1,834.3 |
|
Note&Acct.Rcvbl. |
1,703.4 |
1,650.7 |
1,622.5 |
1,944.6 |
1,633.3 |
|
Lease
receivable&Lease Investment |
208.6 |
132.7 |
120.3 |
60.4 |
- |
|
Marketable Sec. |
- |
0.0 |
2.0 |
0.0 |
70.7 |
|
Inventories |
- |
- |
- |
- |
760.9 |
|
Inventories -
merchandise&finished goods |
666.6 |
610.5 |
594.1 |
655.3 |
- |
|
Inventories -
work-in-process |
240.8 |
202.4 |
214.9 |
267.3 |
- |
|
Inventories - raw
materials & supplies |
215.4 |
157.7 |
167.8 |
190.8 |
- |
|
Dfrd. Tax Asset |
393.0 |
418.1 |
373.0 |
368.9 |
273.7 |
|
Other Curr.Asset |
466.4 |
347.2 |
370.7 |
412.1 |
307.1 |
|
Doubtful Account |
-31.9 |
-29.3 |
-44.5 |
-31.2 |
-28.6 |
|
Total Current
Assets |
6,438.9 |
5,702.9 |
4,806.8 |
5,458.4 |
4,851.5 |
|
|
|
|
|
|
|
|
Buildings &
Structures |
1,641.8 |
1,476.7 |
1,462.1 |
1,268.5 |
1,088.3 |
|
Buildings &
Structures, Dep. |
-867.3 |
-747.6 |
-683.1 |
-652.6 |
- |
|
Machinery &
Equipment |
679.6 |
613.6 |
619.6 |
581.1 |
481.3 |
|
Machinery &
Equipment, Dep. |
-517.8 |
-460.6 |
-449.6 |
-396.7 |
- |
|
Tool and Fixture |
1,811.0 |
1,634.1 |
1,634.4 |
1,552.1 |
1,218.7 |
|
Tool and Fixture,
Dep. |
-1,355.6 |
-1,241.7 |
-1,202.8 |
-1,123.2 |
- |
|
Land |
234.6 |
204.0 |
201.0 |
213.9 |
158.7 |
|
Lease assets,
gross |
92.4 |
62.1 |
69.0 |
0.0 |
- |
|
Accum. depr -
lease assets |
-32.1 |
-20.7 |
-33.5 |
0.0 |
- |
|
Construction |
34.2 |
26.4 |
34.3 |
64.3 |
9.4 |
|
Depreciation |
- |
- |
- |
- |
-1,769.9 |
|
Goodwill |
2,117.2 |
2,076.9 |
1,827.9 |
3,012.0 |
666.7 |
|
Other
Intangible Asset |
880.0 |
766.1 |
851.3 |
1,047.2 |
183.2 |
|
Investment Sec. |
680.4 |
1,393.1 |
1,287.3 |
1,947.5 |
1,834.7 |
|
Equity
secs.-nonconsol affil.&sub. |
35.6 |
108.1 |
- |
- |
- |
|
LT Loan |
69.2 |
42.7 |
38.6 |
32.9 |
4.8 |
|
Dfrd. Tax Asset |
184.9 |
101.6 |
158.6 |
97.1 |
81.4 |
|
Other Assets |
714.8 |
607.1 |
591.7 |
548.6 |
442.1 |
|
Doubtful Account |
-8.9 |
-13.6 |
-12.5 |
-4.2 |
-4.1 |
|
Total Assets |
12,832.9 |
12,331.2 |
11,201.0 |
13,646.9 |
9,246.7 |
|
|
|
|
|
|
|
|
Note&Acct.
Pybl. |
829.1 |
792.7 |
674.3 |
839.9 |
849.1 |
|
ST Borrowing |
773.3 |
803.4 |
824.2 |
3,134.2 |
1,185.5 |
|
LT borrowings
(current) |
762.6 |
201.8 |
158.5 |
269.5 |
72.4 |
|
Current lease
obligations |
- |
9.3 |
10.7 |
- |
- |
|
Curr.-Corp.Bond |
2.9 |
214.5 |
205.5 |
353.7 |
0.8 |
|
Other accounts
payable |
441.9 |
421.1 |
557.9 |
765.4 |
0.0 |
|
Accrued Expense |
719.9 |
640.2 |
664.1 |
828.5 |
656.6 |
|
Income Tax Pybl. |
114.0 |
182.9 |
85.1 |
- |
- |
|
Prov-Prod.Wrrty. |
100.9 |
103.9 |
89.9 |
101.9 |
74.2 |
|
Business Tax
Payable |
- |
- |
- |
141.9 |
140.9 |
|
Other Allowance |
9.8 |
0.0 |
0.6 |
1.3 |
1.6 |
|
Other Curr.Liab. |
178.4 |
188.0 |
190.8 |
219.2 |
492.5 |
|
Total Current
Liabilities |
3,932.8 |
3,557.8 |
3,461.6 |
6,655.5 |
3,473.4 |
|
|
|
|
|
|
|
|
Corporate Bond |
1,328.7 |
1,181.1 |
1,318.2 |
1,058.9 |
1,189.8 |
|
LT Borrowing |
4,960.6 |
4,678.4 |
4,177.9 |
1,782.0 |
1,466.2 |
|
Lease obligations |
- |
33.6 |
31.9 |
- |
- |
|
Total Long Term
Debt |
6,289.2 |
5,893.0 |
5,528.1 |
2,840.9 |
2,656.0 |
|
|
|
|
|
|
|
|
Deferred tax
liabilities (non-current) |
259.8 |
315.8 |
284.2 |
306.3 |
0.0 |
|
Res-Accr.Retire |
226.8 |
212.8 |
189.8 |
103.7 |
80.7 |
|
Res-Direc.Retire |
1.9 |
1.6 |
1.3 |
1.2 |
0.7 |
|
Reserve for
Guarantee of Debts |
- |
- |
0.0 |
4.5 |
3.8 |
|
Reserve for
Affiliate Liquidation Loss |
- |
- |
- |
- |
0.0 |
|
Other Liability |
109.4 |
28.9 |
27.1 |
38.9 |
111.3 |
|
Minor. Interest |
37.4 |
79.8 |
75.1 |
115.8 |
90.3 |
|
Total
Liabilities |
10,857.4 |
10,089.8 |
9,567.2 |
10,066.8 |
6,416.2 |
|
|
|
|
|
|
|
|
Common Stock |
583.2 |
517.3 |
489.3 |
485.6 |
409.3 |
|
Paid In Capital |
661.1 |
590.4 |
739.6 |
733.9 |
618.7 |
|
Retained Earning |
2,056.5 |
1,800.5 |
1,117.8 |
2,389.3 |
1,618.6 |
|
Unreal.Gain-Sec |
78.7 |
97.4 |
-14.8 |
63.5 |
136.2 |
|
Deferred Hedge |
-9.1 |
-4.7 |
-13.5 |
0.3 |
-1.6 |
|
Translation Adj. |
-1,216.8 |
-715.2 |
-554.4 |
-66.0 |
68.4 |
|
Treasury Stock |
-133.9 |
-44.3 |
-130.3 |
-26.5 |
-19.2 |
|
Pension obligation
adjustments |
-44.0 |
0.0 |
- |
- |
- |
|
Total Equity |
1,975.6 |
2,241.4 |
1,633.7 |
3,580.2 |
2,830.5 |
|
|
|
|
|
|
|
|
Total
Liabilities & Shareholders' Equity |
12,832.9 |
12,331.2 |
11,201.0 |
13,646.9 |
9,246.7 |
|
|
|
|
|
|
|
|
S/O-Common Stock |
266.9 |
270.0 |
267.2 |
270.2 |
270.3 |
|
Total Common
Shares Outstanding |
266.9 |
270.0 |
267.2 |
270.2 |
270.3 |
|
T/S-Common Stock |
4.3 |
1.3 |
4.1 |
1.0 |
1.0 |
|
Full-Time Employees |
34,391 |
35,376 |
36,503 |
35,772 |
32,958 |
|
Number of Common Shareholders |
17,720 |
14,788 |
8,473 |
7,693 |
7,214 |
|
Debts <1Yr. |
765.5 |
416.3 |
364.1 |
623.2 |
73.2 |
|
Debts <2Yr. |
583.2 |
680.9 |
661.5 |
353.8 |
546.7 |
|
Debts <3Yr. |
1,260.1 |
524.7 |
596.5 |
701.2 |
308.1 |
|
Debts <4Yr. |
1,064.4 |
1,080.8 |
437.2 |
577.3 |
563.8 |
|
Debts <5Yr. |
624.7 |
939.0 |
1,010.8 |
432.3 |
485.9 |
|
Debts Remaining |
2,774.8 |
2,633.9 |
2,790.1 |
776.3 |
751.4 |
|
Total Long Term Debt, Supplemental |
7,072.8 |
6,275.8 |
5,860.2 |
3,464.0 |
2,729.1 |
|
Capital Leases Maturing within 1 Yr |
13.5 |
9.3 |
10.7 |
- |
- |
|
Capital Leases Maturing within 2 Yr |
14.6 |
8.3 |
10.0 |
- |
- |
|
Capital Leases Maturing within 3 Yr |
11.5 |
6.7 |
8.3 |
- |
- |
|
Capital Leases Maturing within 4 Yr |
9.1 |
5.6 |
6.4 |
- |
- |
|
Capital Leases Maturing within 5 Yr |
7.8 |
4.1 |
3.9 |
- |
- |
|
Capital Leases Remaining Maturities |
4.2 |
8.9 |
3.2 |
- |
- |
|
Total Capital Leases |
60.6 |
42.8 |
42.6 |
- |
- |
|
Pension Obligation |
1,566.7 |
1,453.1 |
1,285.8 |
1,245.8 |
1,045.6 |
|
Fair Value of Plan Assets |
1,504.9 |
1,321.4 |
1,065.1 |
1,224.9 |
1,086.1 |
|
Funded Status |
-61.9 |
-131.7 |
-220.7 |
-20.9 |
40.6 |
|
Total Funded Status |
-61.9 |
-131.7 |
-220.7 |
-20.9 |
40.6 |
|
Discount Rate |
2.00% |
2.00% |
2.00% |
2.00% |
2.00% |
|
Expected Rate of Return |
4.00% |
4.00% |
4.00% |
4.00% |
4.00% |
|
Unrecognized Prior Service Cost |
105.2 |
1.3 |
-10.2 |
-18.8 |
-23.2 |
|
Unrecognized Actuarial Gains and Losses |
217.8 |
153.6 |
258.6 |
90.5 |
-37.2 |
|
Prepaid Pension Benefits |
277.6 |
233.4 |
217.4 |
154.4 |
60.8 |
|
Reserve for accrued retirement benefits |
-226.8 |
-212.8 |
-189.8 |
-103.7 |
-80.7 |
|
Net Assets Recognized on Balance Sheet |
373.8 |
175.5 |
276.0 |
122.4 |
-80.3 |
Annual
Cash Flows
Financials in: USD (mil)
|
|
31-Mar-2011 |
31-Mar-2010 |
31-Mar-2009 |
31-Mar-2008 |
31-Mar-2007 |
|
Period Length |
12 Months |
12 Months |
12 Months |
12 Months |
12 Months |
|
UpdateType/Date |
Updated Normal |
Updated Normal |
Updated Normal |
Updated Normal |
Updated Normal |
|
Filed Currency |
JPY |
JPY |
JPY |
JPY |
JPY |
|
Exchange Rate
(Period Average) |
85.691434 |
92.941082 |
100.484331 |
114.302336 |
116.944303 |
|
Auditor |
Ernst &
Young LLP |
Ernst &
Young LLP |
KPMG LLP |
KPMG LLP |
Azsa Audit Corp. |
|
Auditor Opinion |
Unqualified |
Unqualified |
Unqualified with
Explanation |
Unqualified |
Unqualified |
|
|
|
|
|
|
|
|
Income Before Tax |
265.6 |
927.5 |
-908.6 |
827.7 |
629.2 |
|
Depreciation |
401.6 |
465.6 |
445.9 |
328.3 |
260.0 |
|
Impairment Loss |
0.0 |
14.6 |
18.1 |
9.6 |
13.8 |
|
Amort-Goodwill |
167.9 |
161.4 |
1,009.7 |
70.7 |
67.3 |
|
Gain on negative
goodwill |
-28.1 |
0.0 |
- |
- |
- |
|
Res-Accr.Retire
Bft. |
-1.8 |
25.6 |
89.6 |
7.8 |
1.6 |
|
Prepaid Pension
Cost |
-18.4 |
-8.8 |
-88.1 |
-76.6 |
5.8 |
|
Product Warranty |
-13.7 |
10.4 |
3.6 |
13.2 |
29.8 |
|
Int. and Div.
Income |
-19.5 |
-20.0 |
-34.1 |
-36.4 |
-19.8 |
|
Interest Expense |
148.7 |
133.6 |
161.1 |
121.7 |
107.5 |
|
Gain/Loss-Equity
Method |
-6.7 |
-3.3 |
17.0 |
24.2 |
20.5 |
|
Gains on transfer
of business |
-31.5 |
-512.9 |
0.0 |
- |
- |
|
Gains on equity
changes |
- |
- |
0.0 |
-16.7 |
0.0 |
|
Gain on sale of
Trust |
- |
- |
- |
- |
0.0 |
|
G/L on prior
period adjustments |
- |
0.0 |
154.4 |
0.0 |
- |
|
G/L Sale of
Affiliates' Stock |
0.9 |
-26.1 |
0.0 |
-2.7 |
-1.4 |
|
Val.Loss-Invest.Sec |
12.3 |
65.4 |
157.2 |
13.0 |
15.0 |
|
Account Receivable |
116.3 |
-114.7 |
167.1 |
-34.6 |
-149.1 |
|
Inventories |
-40.3 |
-29.6 |
59.9 |
-125.2 |
58.3 |
|
Other Payable |
-44.6 |
-14.9 |
-56.4 |
139.4 |
0.0 |
|
Account Payable |
-66.9 |
142.0 |
-142.7 |
-80.8 |
98.6 |
|
Accrued Expense |
18.3 |
-13.5 |
-125.6 |
-0.3 |
135.7 |
|
Other
Opera.Activity |
14.5 |
-47.9 |
-22.7 |
42.1 |
-17.3 |
|
Int. and Div.
Rcvd. |
19.9 |
20.8 |
34.2 |
36.0 |
20.0 |
|
Interest Paid |
-152.7 |
-134.1 |
-160.6 |
-121.3 |
-106.5 |
|
Taxes Paid |
-357.8 |
-220.6 |
-364.8 |
-360.2 |
-242.0 |
|
Newly Consolid.
Sub. |
- |
- |
- |
5.1 |
1.2 |
|
Excluded from
Consolidation |
- |
- |
- |
-2.1 |
-0.5 |
|
Cash from
Operating Activities |
384.1 |
820.4 |
414.3 |
781.7 |
927.7 |
|
|
|
|
|
|
|
|
Deposited-Time
Depo |
-56.1 |
-50.9 |
-56.0 |
-340.8 |
-353.8 |
|
Withdrawn-Time
Depo |
61.0 |
61.4 |
382.5 |
365.5 |
56.5 |
|
Purch-Marketable
Sec |
- |
- |
- |
0.0 |
-71.5 |
|
Sale-Marketable
Sec. |
- |
- |
0.0 |
20.6 |
10.8 |
|
Capital
Expenditure |
-236.2 |
-425.0 |
-436.2 |
-419.5 |
-352.9 |
|
Sale of PPE |
- |
- |
0.0 |
20.2 |
5.5 |
|
Purchase of
intangible assets |
-109.5 |
-58.1 |
-55.9 |
0.0 |
- |
|
Purch-Investment
Sec |
-43.7 |
-53.4 |
-53.1 |
-106.1 |
-131.7 |
|
Sale/redempt.LT
inv't in sec. |
826.9 |
39.9 |
403.4 |
56.8 |
37.3 |
|
Purchase of
consolid. subs.' securities |
-143.9 |
-4.0 |
-1.3 |
-2,031.8 |
-20.6 |
|
Outflow due to
sale subsidiaries' sec. |
0.0 |
-0.5 |
-1.2 |
0.0 |
-2.0 |
|
Sale of
consol.subsidiaries' sec. |
2.3 |
189.1 |
0.0 |
5.3 |
0.0 |
|
Sale subsidiaries'
securities |
- |
- |
0.0 |
1.7 |
- |
|
Purchase of
subsidiaries' sec. |
-67.9 |
-644.4 |
-402.0 |
0.0 |
- |
|
Purchase of subs.'
additioanl shares |
- |
- |
0.0 |
-160.6 |
0.0 |
|
Loans made |
-41.8 |
-20.5 |
-15.2 |
-86.7 |
0.0 |
|
Loans collected |
1.4 |
3.6 |
30.6 |
13.5 |
0.0 |
|
Purchase of
businesses |
-76.2 |
-73.7 |
0.0 |
- |
- |
|
Disposal of
businesses invested |
67.6 |
800.5 |
0.0 |
- |
- |
|
Sale of Trust |
- |
- |
- |
- |
0.0 |
|
Other Inv.
Activity |
9.1 |
10.3 |
-2.0 |
-0.3 |
-2.6 |
|
Cash from
Investing Activities |
193.2 |
-225.6 |
-206.3 |
-2,662.3 |
-825.0 |
|
|
|
|
|
|
|
|
ST Debt, Net |
-163.1 |
-48.8 |
-2,171.7 |
1,336.8 |
-171.2 |
|
Issued-LT Debt |
402.6 |
1,028.9 |
2,584.7 |
324.6 |
164.5 |
|
Repaid-LT Debt |
-220.7 |
-525.8 |
-334.4 |
-131.8 |
-86.7 |
|
Issue-Corporate
Bond |
0.0 |
2.2 |
449.5 |
0.9 |
379.5 |
|
Stock Issued |
- |
- |
- |
- |
0.0 |
|
Redemp-Corp.Bond |
-233.9 |
-218.4 |
-350.3 |
-0.8 |
-214.6 |
|
Paid In by
Minority |
- |
0.0 |
1.5 |
16.8 |
9.4 |
|
Treasury stock
purchased |
-116.8 |
0.0 |
-101.9 |
0.0 |
- |
|
Dividend Paid |
-94.5 |
-43.6 |
-107.0 |
-104.0 |
-59.0 |
|
Div.Paid to
Minority |
-0.5 |
-1.8 |
-1.1 |
-0.8 |
0.0 |
|
Other
Finan.Activity |
-9.2 |
-5.9 |
-6.5 |
-3.2 |
-3.2 |
|
Cash from
Financing Activities |
-436.0 |
186.7 |
-37.3 |
1,438.3 |
18.7 |
|
|
|
|
|
|
|
|
Foreign Exchange Effects |
-69.2 |
-31.3 |
-44.1 |
-38.5 |
11.1 |
|
Net Change in
Cash |
72.1 |
750.2 |
126.5 |
-480.8 |
132.5 |
|
|
|
|
|
|
|
|
Net Cash - Beginning Balance |
2,383.0 |
1,434.1 |
1,194.3 |
1,529.3 |
1,362.2 |
|
Net Cash - Ending Balance |
2,455.1 |
2,184.3 |
1,320.8 |
1,048.5 |
1,494.7 |
|
Cash Interest Paid |
152.7 |
134.1 |
160.6 |
121.3 |
106.5 |
|
Cash Taxes Paid |
|
|
|
|
|
Financial
Health
Financials in: USD (mil)
Except for share items (millions) and per share items (actual units)
|
|||||||||||||||||||||||||||||||||||||||||||||||||||||||||||||||||||||||||||||||||||||||||||||||||||||||||||||||||||||||||||||||
|
|||||||||||||||||||||||||||||||||||||||||||||||||||||||||||||||||||||||||||||||||||||||||||||||||||||||||||||||||||||||||||||||
|
|||||||||||||||||||||||||||||||||||||||||||||||||||||||||||||||||||||||||||||||||||||||||||||||||||||||||||||||||||||||||||||||
Ratio comparisons
|
|||||||||||||||||||||||||||||||||||||||||||||||||||||||||||||||||||||||||||||||||||||||||||||||||||||||||||||||||||||||||||||||||||||||||||||||||||||||||||||||||||||||||||||||||||||||||||||||||||||||||||||||||||||||||||||||||||||||||||||||||||||||||||||||||||||||||||||||||||||||||||||||||||||||||||||||||||||||
Annual Ratios
Financials in: USD (mil)
Except for share items (millions) and per share items (actual units)
|
|
|||||||||||||||||||||||||||||||||||||||||||||||||||||||||||||||||||||||||||||||||||||||||||||||||||||||||||||||||||||||||||||||||||||||||||||||||||||||||||||||||||||||||||||||||||||||||||||||||||||||||||||||||||||||||||||||||||||||||||||||||||||||||||||||||||
|
|||||||||||||||||||||||||||||||||||||||||||||||||||||||||||||||||||||||||||||||||||||||||||||||||||||||||||||||||||||||||||||||||||||||||||||||||||||||||||||||||||||||||||||||||||||||||||||||||||||||||||||||||||||||||||||||||||||||||||||||||||||||||||||||||||
|
|||||||||||||||||||||||||||||||||||||||||||||||||||||||||||||||||||||||||||||||||||||||||||||||||||||||||||||||||||||||||||||||||||||||||||||||||||||||||||||||||||||||||||||||||||||||||||||||||||||||||||||||||||||||||||||||||||||||||||||||||||||||||||||||||||
Stock Report
|
|
||||||||||||||||||||||||||||||||||||||||||||||||||||||||||
|
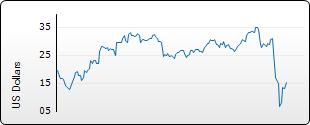
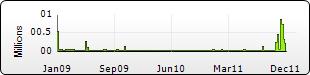
|
|
|||||||||||||||||||||||||||||||||||||||||||||||||||||||||||||||||||||||||||||||||||||||||||
|
|||||||||||||||||||||||||||||||||||||||||||||||||||||||||||||||||||||||||||||||||||||||||||
Stock Report
|
|
||||||||||||||||||||||||||||||||||||||||||||||||||||||||||
|
|
|
|||||||||||||||||||||||||||||||||||||||||||||||||||||||||||||||||||||||||||||||||||||||||||
|
|||||||||||||||||||||||||||||||||||||||||||||||||||||||||||||||||||||||||||||||||||||||||||
Annual Income Statement
Standardized
Financials in: USD (mil)
Except for share items (millions) and per share items (actual units)
|
|
31-Mar-2011 |
31-Mar-2010 |
31-Mar-2009 |
31-Mar-2008 |
31-Mar-2007 |
|
Period Length |
12 Months |
12 Months |
12 Months |
12 Months |
12 Months |
|
UpdateType/Date |
Updated Normal |
Updated Normal |
Updated Normal |
Updated Normal |
Updated Normal |
|
Filed Currency |
JPY |
JPY |
JPY |
JPY |
JPY |
|
Exchange Rate
(Period Average) |
85.691434 |
92.941082 |
100.484331 |
114.302336 |
116.944303 |
|
Auditor |
Ernst &
Young LLP |
Ernst &
Young LLP |
KPMG LLP |
KPMG LLP |
Azsa Audit Corp. |
|
Auditor Opinion |
Unqualified |
Unqualified |
Unqualified with
Explanation |
Unqualified |
Unqualified |
|
|
|
|
|
|
|
|
Net Sales |
9,885.5 |
9,501.6 |
9,760.8 |
9,876.2 |
9,079.4 |
|
Revenue |
9,885.5 |
9,501.6 |
9,760.8 |
9,876.2 |
9,079.4 |
|
Total Revenue |
9,885.5 |
9,501.6 |
9,760.8 |
9,876.2 |
9,079.4 |
|
|
|
|
|
|
|
|
Cost of Revenue |
5,362.4 |
5,109.1 |
5,170.8 |
5,418.9 |
5,229.0 |
|
Cost of Revenue, Total |
5,362.4 |
5,109.1 |
5,170.8 |
5,418.9 |
5,229.0 |
|
Gross Profit |
4,523.1 |
4,392.5 |
4,590.0 |
4,457.3 |
3,850.4 |
|
|
|
|
|
|
|
|
Selling/General/Administrative Expense |
1,180.2 |
1,054.1 |
1,314.4 |
1,161.0 |
1,016.8 |
|
Labor & Related Expense |
1,506.4 |
1,433.4 |
1,380.6 |
1,191.4 |
1,065.4 |
|
Advertising Expense |
520.7 |
438.0 |
528.0 |
513.2 |
414.4 |
|
Total Selling/General/Administrative Expenses |
3,207.3 |
2,925.5 |
3,223.0 |
2,865.6 |
2,496.6 |
|
Research & Development |
451.7 |
387.6 |
457.1 |
337.3 |
275.1 |
|
Depreciation |
283.6 |
296.0 |
314.4 |
198.4 |
167.2 |
|
Amortization of Acquisition Costs |
167.9 |
161.4 |
1,009.7 |
70.7 |
67.3 |
|
Depreciation/Amortization |
451.5 |
457.4 |
1,324.1 |
269.1 |
234.5 |
|
Impairment-Assets Held for Use |
0.0 |
14.6 |
18.1 |
9.6 |
13.8 |
|
Impairment-Assets Held for Sale |
12.3 |
65.4 |
157.2 |
13.0 |
15.0 |
|
Other Unusual Expense (Income) |
-13.8 |
-4.6 |
154.4 |
0.0 |
0.0 |
|
Unusual Expense (Income) |
-1.5 |
75.4 |
329.7 |
22.6 |
28.9 |
|
Total Operating Expense |
9,471.4 |
8,954.9 |
10,504.6 |
8,913.5 |
8,264.1 |
|
|
|
|
|
|
|
|
Operating Income |
414.1 |
546.7 |
-743.8 |
962.7 |
815.4 |
|
|
|
|
|
|
|
|
Interest Expense -
Non-Operating |
-148.7 |
-133.6 |
-161.1 |
-121.7 |
-107.5 |
|
Interest Expense, Net Non-Operating |
-148.7 |
-133.6 |
-161.1 |
-121.7 |
-107.5 |
|
Interest Income -
Non-Operating |
10.4 |
12.1 |
24.1 |
28.0 |
15.4 |
|
Investment Income -
Non-Operating |
52.4 |
55.6 |
39.3 |
-16.7 |
-45.0 |
|
Interest/Investment Income - Non-Operating |
62.8 |
67.7 |
63.4 |
11.3 |
-29.7 |
|
Interest Income (Expense) - Net Non-Operating Total |
-85.9 |
-65.9 |
-97.7 |
-110.4 |
-137.1 |
|
Gain (Loss) on Sale of Assets |
31.5 |
512.9 |
0.0 |
15.6 |
0.0 |
|
Other Non-Operating Income (Expense) |
-94.1 |
-66.2 |
-67.0 |
-40.1 |
-49.0 |
|
Other, Net |
-94.1 |
-66.2 |
-67.0 |
-40.1 |
-49.0 |
|
Income Before Tax |
265.6 |
927.5 |
-908.6 |
827.7 |
629.2 |
|
|
|
|
|
|
|
|
Total Income Tax |
174.2 |
411.7 |
257.5 |
321.6 |
223.0 |
|
Income After Tax |
91.4 |
515.8 |
-1,166.1 |
506.1 |
406.2 |
|
|
|
|
|
|
|
|
Minority Interest |
-5.2 |
-1.9 |
23.5 |
1.0 |
2.6 |
|
Net Income Before Extraord Items |
86.1 |
513.9 |
-1,142.6 |
507.2 |
408.7 |
|
Net Income |
86.1 |
513.9 |
-1,142.6 |
507.2 |
408.7 |
|
|
|
|
|
|
|
|
Miscellaneous Earnings Adjustment |
- |
- |
- |
0.0 |
0.0 |
|
Total Adjustments to Net Income |
- |
- |
- |
0.0 |
0.0 |
|
Income Available to Common Excl Extraord Items |
86.1 |
513.9 |
-1,142.6 |
507.2 |
408.7 |
|
|
|
|
|
|
|
|
Income Available to Common Incl Extraord Items |
86.1 |
513.9 |
-1,142.6 |
507.2 |
408.7 |
|
|
|
|
|
|
|
|
Basic/Primary Weighted Average Shares |
268.7 |
269.5 |
267.7 |
270.3 |
270.4 |
|
Basic EPS Excl Extraord Items |
0.32 |
1.91 |
-4.27 |
1.88 |
1.51 |
|
Basic/Primary EPS Incl Extraord Items |
0.32 |
1.91 |
-4.27 |
1.88 |
1.51 |
|
Dilution Adjustment |
0.0 |
0.0 |
0.0 |
-0.1 |
0.0 |
|
Diluted Net Income |
86.1 |
513.9 |
-1,142.6 |
507.1 |
408.7 |
|
Diluted Weighted Average Shares |
268.7 |
269.5 |
267.7 |
270.3 |
270.4 |
|
Diluted EPS Excl Extraord Items |
0.32 |
1.91 |
-4.27 |
1.88 |
1.51 |
|
Diluted EPS Incl Extraord Items |
0.32 |
1.91 |
-4.27 |
1.88 |
1.51 |
|
Dividends per Share - Common Stock Primary Issue |
0.35 |
0.32 |
0.20 |
0.35 |
0.30 |
|
Gross Dividends - Common Stock |
94.0 |
87.1 |
53.2 |
94.6 |
80.9 |
|
Interest Expense, Supplemental |
148.7 |
133.6 |
161.1 |
121.7 |
20.5 |
|
Depreciation, Supplemental |
401.6 |
465.6 |
445.9 |
328.3 |
260.0 |
|
Total Special Items |
135.0 |
-276.2 |
1,339.4 |
77.7 |
96.2 |
|
Normalized Income Before Tax |
400.6 |
651.3 |
430.8 |
905.4 |
725.3 |
|
|
|
|
|
|
|
|
Effect of Special Items on Income Taxes |
-11.5 |
-194.2 |
115.4 |
2.7 |
10.2 |
|
Inc Tax Ex Impact of Sp Items |
162.7 |
217.5 |
372.8 |
324.3 |
233.3 |
|
Normalized Income After Tax |
237.9 |
433.8 |
57.9 |
581.1 |
492.1 |
|
|
|
|
|
|
|
|
Normalized Inc. Avail to Com. |
232.6 |
431.9 |
81.4 |
582.1 |
494.7 |
|
|
|
|
|
|
|
|
Basic Normalized EPS |
0.87 |
1.60 |
0.30 |
2.15 |
1.83 |
|
Diluted Normalized EPS |
0.87 |
1.60 |
0.30 |
2.15 |
1.83 |
|
Amort of Acquisition Costs, Supplemental |
167.9 |
161.4 |
1,009.7 |
70.7 |
67.3 |
|
Advertising Expense, Supplemental |
520.7 |
438.0 |
528.0 |
513.2 |
414.4 |
|
Research & Development Exp, Supplemental |
785.2 |
665.5 |
696.7 |
576.8 |
474.8 |
|
Reported Operating Profit |
412.6 |
647.2 |
344.2 |
985.3 |
844.2 |
|
Reported Ordinary Profit |
258.5 |
485.4 |
183.0 |
814.4 |
651.8 |
|
Normalized EBIT |
412.6 |
622.1 |
-414.1 |
985.3 |
844.2 |
|
Normalized EBITDA |
982.1 |
1,249.0 |
1,041.4 |
1,384.2 |
1,171.5 |
|
Interest Cost - Domestic |
47.0 |
41.1 |
35.1 |
31.8 |
29.6 |
|
Service Cost - Domestic |
76.9 |
68.9 |
66.1 |
56.0 |
55.0 |
|
Prior Service Cost - Domestic |
-12.5 |
-8.6 |
-7.8 |
-6.8 |
-9.5 |
|
Expected Return on Assets - Domestic |
-64.0 |
-55.3 |
-56.9 |
-53.4 |
-47.2 |
|
Actuarial Gains and Losses - Domestic |
46.1 |
54.2 |
18.6 |
4.7 |
23.0 |
|
Domestic Pension Plan Expense |
93.4 |
100.3 |
55.0 |
32.4 |
50.9 |
|
Defined Contribution Expense - Domestic |
3.1 |
- |
- |
- |
- |
|
Total Pension Expense |
96.5 |
100.3 |
55.0 |
32.4 |
50.9 |
|
Discount Rate - Domestic |
2.00% |
2.00% |
2.00% |
2.00% |
2.00% |
|
Expected Rate of Return - Domestic |
4.00% |
4.00% |
4.00% |
4.00% |
4.00% |
|
Total Plan Interest Cost |
47.0 |
41.1 |
35.1 |
31.8 |
29.6 |
|
Total Plan Service Cost |
76.9 |
68.9 |
66.1 |
56.0 |
55.0 |
|
Total Plan Expected Return |
-64.0 |
-55.3 |
-56.9 |
-53.4 |
-47.2 |
Interim Income Statement
Standardized
Financials in: USD (mil)
Except for share items (millions) and per share items (actual units)
|
|
30-Jun-2011 |
31-Mar-2011 |
31-Dec-2010 |
30-Sep-2010 |
30-Jun-2010 |
|
Period Length |
3 Months |
3 Months |
3 Months |
3 Months |
3 Months |
|
UpdateType/Date |
Updated Normal |
Updated Normal |
Updated Normal |
Updated Normal |
Updated Normal |
|
Filed Currency |
JPY |
JPY |
JPY |
JPY |
JPY |
|
Exchange Rate
(Period Average) |
81.605269 |
82.241044 |
82.567473 |
85.838925 |
92.080323 |
|
|
|
|
|
|
|
|
Net Sales |
2,433.3 |
2,712.7 |
2,503.2 |
2,461.8 |
2,237.2 |
|
Revenue |
2,433.3 |
2,712.7 |
2,503.2 |
2,461.8 |
2,237.2 |
|
Total Revenue |
2,433.3 |
2,712.7 |
2,503.2 |
2,461.8 |
2,237.2 |
|
|
|
|
|
|
|
|
Cost of Revenue |
1,332.7 |
1,516.1 |
1,365.6 |
1,315.2 |
1,185.6 |
|
Cost of Revenue, Total |
1,332.7 |
1,516.1 |
1,365.6 |
1,315.2 |
1,185.6 |
|
Gross Profit |
1,100.6 |
1,196.6 |
1,137.6 |
1,146.6 |
1,051.6 |
|
|
|
|
|
|
|
|
Selling/General/Administrative Expense |
1,045.9 |
356.4 |
297.1 |
271.8 |
260.2 |
|
Labor & Related Expense |
- |
393.9 |
379.0 |
381.9 |
354.1 |
|
Advertising Expense |
- |
141.1 |
121.8 |
143.7 |
115.4 |
|
Total Selling/General/Administrative Expenses |
1,045.9 |
891.3 |
798.0 |
797.4 |
729.8 |
|
Research & Development |
- |
117.8 |
114.6 |
124.5 |
96.3 |
|
Depreciation |
- |
79.9 |
70.7 |
67.9 |
65.8 |
|
Amortization of Acquisition Costs |
- |
39.4 |
46.3 |
43.9 |
38.6 |
|
Depreciation/Amortization |
- |
119.3 |
117.0 |
111.9 |
104.4 |
|
Impairment-Assets Held for Use |
2.0 |
0.0 |
0.0 |
0.0 |
0.0 |
|
Impairment-Assets Held for Sale |
0.0 |
- |
-33.9 |
33.5 |
0.7 |
|
Other Unusual Expense (Income) |
0.0 |
-10.7 |
0.0 |
0.0 |
6.7 |
|
Unusual Expense (Income) |
2.0 |
-10.7 |
-33.9 |
33.5 |
7.4 |
|
Total Operating Expense |
2,380.6 |
2,633.7 |
2,361.3 |
2,382.6 |
2,123.5 |
|
|
|
|
|
|
|
|
Operating Income |
52.7 |
78.9 |
142.0 |
79.2 |
113.7 |
|
|
|
|
|
|
|
|
Interest Expense -
Non-Operating |
-39.5 |
-41.9 |
-37.7 |
-36.1 |
-33.5 |
|
Interest Expense, Net Non-Operating |
-39.5 |
-41.9 |
-37.7 |
-36.1 |
-33.5 |
|
Interest Income -
Non-Operating |
3.1 |
2.4 |
2.5 |
3.3 |
2.2 |
|
Investment Income -
Non-Operating |
1.5 |
2.3 |
-12.0 |
55.3 |
-0.3 |
|
Interest/Investment Income - Non-Operating |
4.6 |
4.8 |
-9.4 |
58.6 |
1.9 |
|
Interest Income (Expense) - Net Non-Operating Total |
-34.9 |
-37.2 |
-47.1 |
22.4 |
-31.6 |
|
Gain (Loss) on Sale of Assets |
- |
32.8 |
0.0 |
- |
- |
|
Other Non-Operating Income (Expense) |
-19.0 |
-80.8 |
-5.6 |
-14.9 |
9.8 |
|
Other, Net |
-19.0 |
-80.8 |
-5.6 |
-14.9 |
9.8 |
|
Income Before Tax |
-1.2 |
-6.3 |
89.2 |
86.8 |
91.9 |
|
|
|
|
|
|
|
|
Total Income Tax |
24.6 |
9.0 |
67.1 |
22.5 |
72.9 |
|
Income After Tax |
-25.8 |
-15.3 |
22.1 |
64.3 |
18.9 |
|
|
|
|
|
|
|
|
Minority Interest |
-0.6 |
-0.4 |
-2.4 |
0.3 |
-2.6 |
|
Net Income Before Extraord Items |
-26.4 |
-15.8 |
19.7 |
64.6 |
16.3 |
|
Net Income |
-26.4 |
-15.8 |
19.7 |
64.6 |
16.3 |
|
|
|
|
|
|
|
|
Income Available to Common Excl Extraord Items |
-26.4 |
-15.8 |
19.7 |
64.6 |
16.3 |
|
|
|
|
|
|
|
|
Income Available to Common Incl Extraord Items |
-26.4 |
-15.8 |
19.7 |
64.6 |
16.3 |
|
|
|
|
|
|
|
|
Basic/Primary Weighted Average Shares |
266.9 |
266.1 |
268.6 |
270.0 |
270.0 |
|
Basic EPS Excl Extraord Items |
-0.10 |
-0.06 |
0.07 |
0.24 |
0.06 |
|
Basic/Primary EPS Incl Extraord Items |
-0.10 |
-0.06 |
0.07 |
0.24 |
0.06 |
|
Dilution Adjustment |
0.0 |
0.0 |
0.0 |
0.0 |
0.0 |
|
Diluted Net Income |
-26.4 |
-15.8 |
19.7 |
64.6 |
16.3 |
|
Diluted Weighted Average Shares |
266.9 |
266.1 |
268.6 |
270.0 |
270.0 |
|
Diluted EPS Excl Extraord Items |
-0.10 |
-0.06 |
0.07 |
0.24 |
0.06 |
|
Diluted EPS Incl Extraord Items |
-0.10 |
-0.06 |
0.07 |
0.24 |
0.06 |
|
Dividends per Share - Common Stock Primary Issue |
0.00 |
0.18 |
0.00 |
0.17 |
0.00 |
|
Gross Dividends - Common Stock |
0.0 |
48.7 |
0.0 |
47.2 |
0.0 |
|
Interest Expense, Supplemental |
39.5 |
41.9 |
37.7 |
36.1 |
33.5 |
|
Depreciation, Supplemental |
102.0 |
126.9 |
97.9 |
102.0 |
77.5 |
|
Total Special Items |
45.7 |
-4.1 |
12.4 |
77.4 |
46.1 |
|
Normalized Income Before Tax |
44.5 |
-10.5 |
101.6 |
164.2 |
137.9 |
|
|
|
|
|
|
|
|
Effect of Special Items on Income Taxes |
0.7 |
-15.2 |
-11.9 |
8.7 |
2.6 |
|
Inc Tax Ex Impact of Sp Items |
25.3 |
-6.2 |
55.3 |
31.2 |
75.5 |
|
Normalized Income After Tax |
19.2 |
-4.2 |
46.3 |
133.0 |
62.4 |
|
|
|
|
|
|
|
|
Normalized Inc. Avail to Com. |
18.6 |
-4.7 |
44.0 |
133.4 |
59.8 |
|
|
|
|
|
|
|
|
Basic Normalized EPS |
0.07 |
-0.02 |
0.16 |
0.49 |
0.22 |
|
Diluted Normalized EPS |
0.07 |
-0.02 |
0.16 |
0.49 |
0.22 |
|
Amort of Acquisition Costs, Supplemental |
43.7 |
39.4 |
46.3 |
43.9 |
38.6 |
|
Advertising Expense, Supplemental |
- |
141.1 |
121.8 |
143.7 |
115.4 |
|
Research & Development Exp, Supplemental |
- |
117.8 |
114.6 |
124.5 |
96.3 |
|
Reported Operating Profit |
54.7 |
68.2 |
108.1 |
112.7 |
121.1 |
|
Reported Ordinary Profit |
0.8 |
-47.8 |
84.0 |
117.8 |
98.1 |
|
Normalized EBIT |
54.7 |
68.2 |
108.1 |
112.7 |
121.1 |
|
Normalized EBITDA |
200.4 |
234.5 |
252.2 |
258.6 |
237.3 |
Annual
Balance Sheet
Standardized
Financials in: USD (mil)
Except for share items (millions) and per share items (actual units)
|
|
31-Mar-2011 |
31-Mar-2010 |
31-Mar-2009 |
31-Mar-2008 |
31-Mar-2007 |
|
UpdateType/Date |
Updated Normal |
Updated Normal |
Updated Normal |
Updated Normal |
Updated Normal |
|
Filed Currency |
JPY |
JPY |
JPY |
JPY |
JPY |
|
Exchange Rate |
82.88 |
93.44 |
98.77 |
99.535 |
118.075 |
|
Auditor |
Ernst &
Young LLP |
Ernst &
Young LLP |
KPMG LLP |
KPMG LLP |
Azsa Audit Corp. |
|
Auditor Opinion |
Unqualified |
Unqualified |
Unqualified with
Explanation |
Unqualified |
Unqualified |
|
|
|
|
|
|
|
|
Cash & Equivalents |
2,576.7 |
2,213.0 |
1,385.8 |
1,590.2 |
1,834.3 |
|
Short Term Investments |
- |
0.0 |
2.0 |
0.0 |
70.7 |
|
Cash and Short Term Investments |
2,576.7 |
2,213.0 |
1,387.8 |
1,590.2 |
1,905.0 |
|
Accounts Receivable -
Trade, Gross |
1,703.4 |
1,650.7 |
1,622.5 |
1,944.6 |
1,633.3 |
|
Provision for Doubtful
Accounts |
-31.9 |
-29.3 |
-44.5 |
-31.2 |
-28.6 |
|
Trade Accounts Receivable - Net |
1,671.4 |
1,621.4 |
1,578.1 |
1,913.4 |
1,604.7 |
|
Total Receivables, Net |
1,671.4 |
1,621.4 |
1,578.1 |
1,913.4 |
1,604.7 |
|
Inventories - Finished Goods |
666.6 |
610.5 |
594.1 |
655.3 |
- |
|
Inventories - Work In Progress |
240.8 |
202.4 |
214.9 |
267.3 |
- |
|
Inventories - Raw Materials |
215.4 |
157.7 |
167.8 |
190.8 |
- |
|
Total Inventory |
1,122.8 |
970.6 |
976.9 |
1,113.4 |
760.9 |
|
Deferred Income Tax - Current Asset |
393.0 |
418.1 |
373.0 |
368.9 |
273.7 |
|
Other Current Assets |
675.0 |
479.8 |
491.0 |
472.5 |
307.1 |
|
Other Current Assets, Total |
1,068.0 |
897.9 |
864.0 |
841.4 |
580.9 |
|
Total Current Assets |
6,438.9 |
5,702.9 |
4,806.8 |
5,458.4 |
4,851.5 |
|
|
|
|
|
|
|
|
Buildings |
1,641.8 |
1,476.7 |
1,462.1 |
1,268.5 |
1,088.3 |
|
Land/Improvements |
234.6 |
204.0 |
201.0 |
213.9 |
158.7 |
|
Machinery/Equipment |
2,490.6 |
2,247.7 |
2,254.0 |
2,133.2 |
1,700.0 |
|
Construction in
Progress |
34.2 |
26.4 |
34.3 |
64.3 |
9.4 |
|
Leases |
92.4 |
62.1 |
69.0 |
0.0 |
- |
|
Property/Plant/Equipment - Gross |
4,493.7 |
4,016.9 |
4,020.5 |
3,679.9 |
2,956.3 |
|
Accumulated Depreciation |
-2,772.9 |
-2,470.5 |
-2,369.0 |
-2,172.5 |
-1,769.9 |
|
Property/Plant/Equipment - Net |
1,720.9 |
1,546.4 |
1,651.4 |
1,507.4 |
1,186.4 |
|
Goodwill, Net |
2,117.2 |
2,076.9 |
1,827.9 |
3,012.0 |
666.7 |
|
Intangibles, Net |
880.0 |
766.1 |
851.3 |
1,047.2 |
183.2 |
|
LT Investment - Affiliate Companies |
35.6 |
108.1 |
- |
- |
- |
|
LT Investments - Other |
680.4 |
1,393.1 |
1,287.3 |
1,947.5 |
1,834.7 |
|
Long Term Investments |
716.0 |
1,501.2 |
1,287.3 |
1,947.5 |
1,834.7 |
|
Note Receivable - Long Term |
69.2 |
42.7 |
38.6 |
32.9 |
4.8 |
|
Deferred Income Tax - Long Term Asset |
184.9 |
101.6 |
158.6 |
97.1 |
81.4 |
|
Other Long Term Assets |
705.9 |
593.5 |
579.1 |
544.5 |
438.0 |
|
Other Long Term Assets, Total |
890.8 |
695.1 |
737.7 |
641.6 |
519.4 |
|
Total Assets |
12,832.9 |
12,331.2 |
11,201.0 |
13,646.9 |
9,246.7 |
|
|
|
|
|
|
|
|
Accounts Payable |
829.1 |
792.7 |
674.3 |
839.9 |
849.1 |
|
Accrued Expenses |
719.9 |
640.2 |
664.1 |
828.5 |
656.6 |
|
Notes Payable/Short Term Debt |
773.3 |
803.4 |
824.2 |
3,134.2 |
1,185.5 |
|
Current Portion - Long Term Debt/Capital Leases |
765.5 |
425.6 |
374.8 |
623.2 |
73.2 |
|
Income Taxes Payable |
114.0 |
182.9 |
85.1 |
141.9 |
140.9 |
|
Other Payables |
441.9 |
421.1 |
557.9 |
765.4 |
0.0 |
|
Other Current Liabilities |
289.0 |
291.9 |
281.2 |
322.4 |
568.2 |
|
Other Current liabilities, Total |
845.0 |
895.9 |
924.2 |
1,229.7 |
709.1 |
|
Total Current Liabilities |
3,932.8 |
3,557.8 |
3,461.6 |
6,655.5 |
3,473.4 |
|
|
|
|
|
|
|
|
Long Term Debt |
6,289.2 |
5,859.5 |
5,496.2 |
2,840.9 |
2,656.0 |
|
Capital Lease Obligations |
- |
33.6 |
31.9 |
- |
- |
|
Total Long Term Debt |
6,289.2 |
5,893.0 |
5,528.1 |
2,840.9 |
2,656.0 |
|
Total Debt |
7,828.0 |
7,122.0 |
6,727.1 |
6,598.2 |
3,914.6 |
|
|
|
|
|
|
|
|
Deferred Income Tax - LT Liability |
259.8 |
315.8 |
284.2 |
306.3 |
0.0 |
|
Deferred Income Tax |
259.8 |
315.8 |
284.2 |
306.3 |
0.0 |
|
Minority Interest |
37.4 |
79.8 |
75.1 |
115.8 |
90.3 |
|
Reserves |
- |
- |
0.0 |
4.5 |
3.8 |
|
Pension Benefits - Underfunded |
228.7 |
214.4 |
191.1 |
104.9 |
81.4 |
|
Other Long Term Liabilities |
109.4 |
28.9 |
27.1 |
38.9 |
111.3 |
|
Other Liabilities, Total |
338.1 |
243.4 |
218.2 |
148.3 |
196.6 |
|
Total Liabilities |
10,857.4 |
10,089.8 |
9,567.2 |
10,066.8 |
6,416.2 |
|
|
|
|
|
|
|
|
Common Stock |
583.2 |
517.3 |
489.3 |
485.6 |
409.3 |
|
Common Stock |
583.2 |
517.3 |
489.3 |
485.6 |
409.3 |
|
Additional Paid-In Capital |
661.1 |
590.4 |
739.6 |
733.9 |
618.7 |
|
Retained Earnings (Accumulated Deficit) |
2,056.5 |
1,800.5 |
1,117.8 |
2,389.3 |
1,618.6 |
|
Treasury Stock - Common |
-133.9 |
-44.3 |
-130.3 |
-26.5 |
-19.2 |
|
Unrealized Gain (Loss) |
69.6 |
92.7 |
-28.2 |
63.8 |
134.6 |
|
Translation Adjustment |
-1,216.8 |
-715.2 |
-554.4 |
-66.0 |
68.4 |
|
Minimum Pension Liability Adjustment |
-44.0 |
0.0 |
- |
- |
- |
|
Other Equity, Total |
-1,260.8 |
-715.2 |
-554.4 |
-66.0 |
68.4 |
|
Total Equity |
1,975.6 |
2,241.4 |
1,633.7 |
3,580.2 |
2,830.5 |
|
|
|
|
|
|
|
|
Total Liabilities & Shareholders’ Equity |
12,832.9 |
12,331.2 |
11,201.0 |
13,646.9 |
9,246.7 |
|
|
|
|
|
|
|
|
Shares Outstanding - Common Stock Primary
Issue |
266.9 |
270.0 |
267.2 |
270.2 |
270.3 |
|
Total Common Shares Outstanding |
266.9 |
270.0 |
267.2 |
270.2 |
270.3 |
|
Treasury Shares - Common Stock Primary Issue |
4.3 |
1.3 |
4.1 |
1.0 |
1.0 |
|
Employees |
34,391 |
35,376 |
36,503 |
35,772 |
32,958 |
|
Number of Common Shareholders |
17,720 |
14,788 |
8,473 |
7,693 |
7,214 |
|
Total Long Term Debt, Supplemental |
7,072.8 |
6,275.8 |
5,860.2 |
3,464.0 |
2,729.1 |
|
Long Term Debt Maturing within 1 Year |
765.5 |
416.3 |
364.1 |
623.2 |
73.2 |
|
Long Term Debt Maturing in Year 2 |
583.2 |
680.9 |
661.5 |
353.8 |
546.7 |
|
Long Term Debt Maturing in Year 3 |
1,260.1 |
524.7 |
596.5 |
701.2 |
308.1 |
|
Long Term Debt Maturing in Year 4 |
1,064.4 |
1,080.8 |
437.2 |
577.3 |
563.8 |
|
Long Term Debt Maturing in Year 5 |
624.7 |
939.0 |
1,010.8 |
432.3 |
485.9 |
|
Long Term Debt Maturing in 2-3 Years |
1,843.4 |
1,205.7 |
1,258.1 |
1,054.9 |
854.8 |
|
Long Term Debt Maturing in 4-5 Years |
1,689.2 |
2,019.9 |
1,448.0 |
1,009.6 |
1,049.7 |
|
Long Term Debt Matur. in Year 6 & Beyond |
2,774.8 |
2,633.9 |
2,790.1 |
776.3 |
751.4 |
|
Total Capital Leases, Supplemental |
60.6 |
42.8 |
42.6 |
- |
- |
|
Capital Lease Payments Due in Year 1 |
13.5 |
9.3 |
10.7 |
- |
- |
|
Capital Lease Payments Due in Year 2 |
14.6 |
8.3 |
10.0 |
- |
- |
|
Capital Lease Payments Due in Year 3 |
11.5 |
6.7 |
8.3 |
- |
- |
|
Capital Lease Payments Due in Year 4 |
9.1 |
5.6 |
6.4 |
- |
- |
|
Capital Lease Payments Due in Year 5 |
7.8 |
4.1 |
3.9 |
- |
- |
|
Capital Lease Payments Due in 2-3 Years |
26.1 |
15.0 |
18.3 |
- |
- |
|
Capital Lease Payments Due in 4-5 Years |
16.9 |
9.7 |
10.4 |
- |
- |
|
Cap. Lease Pymts. Due in Year 6 & Beyond |
4.2 |
8.9 |
3.2 |
- |
- |
|
Pension Obligation - Domestic |
1,566.7 |
1,453.1 |
1,285.8 |
1,245.8 |
1,045.6 |
|
Plan Assets - Domestic |
1,504.9 |
1,321.4 |
1,065.1 |
1,224.9 |
1,086.1 |
|
Funded Status - Domestic |
-61.9 |
-131.7 |
-220.7 |
-20.9 |
40.6 |
|
Total Funded Status |
-61.9 |
-131.7 |
-220.7 |
-20.9 |
40.6 |
|
Discount Rate - Domestic |
2.00% |
2.00% |
2.00% |
2.00% |
2.00% |
|
Expected Rate of Return - Domestic |
4.00% |
4.00% |
4.00% |
4.00% |
4.00% |
|
Prepaid Benefits - Domestic |
277.6 |
233.4 |
217.4 |
154.4 |
60.8 |
|
Accrued Liabilities - Domestic |
-226.8 |
-212.8 |
-189.8 |
-103.7 |
-80.7 |
|
Other Assets, Net - Domestic |
323.0 |
155.0 |
248.4 |
71.7 |
-60.4 |
|
Net Assets Recognized on Balance Sheet |
373.8 |
175.5 |
276.0 |
122.4 |
-80.3 |
|
Total Plan Obligations |
1,566.7 |
1,453.1 |
1,285.8 |
1,245.8 |
1,045.6 |
|
Total Plan Assets |
1,504.9 |
1,321.4 |
1,065.1 |
1,224.9 |
1,086.1 |
Interim
Balance Sheet
Standardized
Financials in: USD (mil)
Except for share items (millions) and per share items (actual units)
|
|
30-Jun-2011 |
31-Mar-2011 |
31-Dec-2010 |
30-Sep-2010 |
30-Jun-2010 |
|
UpdateType/Date |
Updated Normal |
Updated Normal |
Updated Normal |
Updated Normal |
Updated Normal |
|
Filed Currency |
JPY |
JPY |
JPY |
JPY |
JPY |
|
Exchange Rate |
80.76 |
82.88 |
81.105 |
83.54 |
88.49 |
|
|
|
|
|
|
|
|
Cash & Equivalents |
3,305.5 |
2,576.7 |
2,319.5 |
2,451.7 |
2,189.4 |
|
Short Term Investments |
24.8 |
0.0 |
12.3 |
- |
- |
|
Cash and Short Term Investments |
3,330.3 |
2,576.7 |
2,331.8 |
2,451.7 |
2,189.4 |
|
Accounts Receivable -
Trade, Gross |
1,588.7 |
1,703.4 |
1,650.9 |
1,571.9 |
1,435.1 |
|
Provision for Doubtful
Accounts |
-33.1 |
-31.9 |
-32.6 |
-29.1 |
-26.7 |
|
Trade Accounts Receivable - Net |
1,555.6 |
1,671.4 |
1,618.3 |
1,542.8 |
1,408.4 |
|
Total Receivables, Net |
1,555.6 |
1,671.4 |
1,618.3 |
1,542.8 |
1,408.4 |
|
Inventories - Finished Goods |
690.2 |
666.6 |
691.4 |
716.8 |
704.2 |
|
Inventories - Work In Progress |
312.3 |
240.8 |
248.3 |
224.3 |
187.6 |
|
Inventories - Raw Materials |
252.4 |
215.4 |
226.6 |
208.4 |
174.6 |
|
Total Inventory |
1,254.9 |
1,122.8 |
1,166.4 |
1,149.5 |
1,066.4 |
|
Other Current Assets |
1,073.5 |
1,068.0 |
1,101.4 |
954.0 |
931.5 |
|
Other Current Assets, Total |
1,073.5 |
1,068.0 |
1,101.4 |
954.0 |
931.5 |
|
Total Current Assets |
7,214.3 |
6,438.9 |
6,217.9 |
6,098.0 |
5,595.7 |
|
|
|
|
|
|
|
|
Property/Plant/Equipment - Net |
1,739.1 |
1,720.9 |
1,668.7 |
1,653.2 |
1,560.7 |
|
Goodwill, Net |
2,083.9 |
2,117.2 |
2,224.3 |
2,261.5 |
2,194.1 |
|
Intangibles, Net |
874.4 |
880.0 |
764.6 |
759.0 |
744.7 |
|
LT Investments - Other |
708.4 |
716.0 |
1,190.9 |
1,139.8 |
1,461.4 |
|
Long Term Investments |
708.4 |
716.0 |
1,190.9 |
1,139.8 |
1,461.4 |
|
Other Long Term Assets |
969.5 |
960.0 |
872.2 |
815.1 |
841.0 |
|
Other Long Term Assets, Total |
969.5 |
960.0 |
872.2 |
815.1 |
841.0 |
|
Total Assets |
13,589.5 |
12,832.9 |
12,938.6 |
12,726.6 |
12,397.7 |
|
|
|
|
|
|
|
|
Accounts Payable |
807.3 |
829.1 |
765.0 |
692.9 |
685.4 |
|
Notes Payable/Short Term Debt |
1,534.0 |
773.3 |
1,700.1 |
1,343.5 |
985.9 |
|
Current Portion - Long Term Debt/Capital Leases |
3.0 |
765.5 |
3.0 |
0.5 |
226.5 |
|
Income Taxes Payable |
69.3 |
114.0 |
96.4 |
115.5 |
128.7 |
|
Other Current Liabilities |
1,489.0 |
1,450.9 |
1,428.7 |
1,381.2 |
1,494.6 |
|
Other Current liabilities, Total |
1,558.3 |
1,564.9 |
1,525.1 |
1,496.6 |
1,623.3 |
|
Total Current Liabilities |
3,902.6 |
3,932.8 |
3,993.2 |
3,533.5 |
3,521.1 |
|
|
|
|
|
|
|
|
Long Term Debt |
7,175.5 |
6,289.2 |
6,333.8 |
6,412.1 |
6,175.3 |
|
Total Long Term Debt |
7,175.5 |
6,289.2 |
6,333.8 |
6,412.1 |
6,175.3 |
|
Total Debt |
8,712.5 |
7,828.0 |
8,036.9 |
7,756.1 |
7,387.6 |
|
|
|
|
|
|
|
|
Minority Interest |
38.4 |
37.4 |
98.6 |
92.8 |
83.5 |
|
Reserves |
1.8 |
1.9 |
1.9 |
1.8 |
1.5 |
|
Pension Benefits - Underfunded |
235.8 |
226.8 |
238.8 |
236.8 |
224.1 |
|
Other Long Term Liabilities |
402.2 |
369.2 |
395.9 |
381.9 |
374.6 |
|
Other Liabilities, Total |
639.8 |
597.9 |
636.7 |
620.5 |
600.3 |
|
Total Liabilities |
11,756.4 |
10,857.4 |
11,062.2 |
10,658.9 |
10,380.1 |
|
|
|
|
|
|
|
|
Common Stock |
598.5 |
583.2 |
595.9 |
578.5 |
546.2 |
|
Common Stock |
598.5 |
583.2 |
595.9 |
578.5 |
546.2 |
|
Additional Paid-In Capital |
678.4 |
661.1 |
680.2 |
660.4 |
623.4 |
|
Retained Earnings (Accumulated Deficit) |
2,031.2 |
2,056.5 |
2,073.6 |
2,042.1 |
1,865.2 |
|
Treasury Stock - Common |
-138.1 |
-133.9 |
-174.3 |
-49.5 |
-46.8 |
|
Unrealized Gain (Loss) |
56.8 |
69.6 |
85.3 |
53.5 |
65.1 |
|
Translation Adjustment |
-1,349.6 |
-1,216.8 |
-1,384.3 |
-1,217.3 |
-1,035.6 |
|
Minimum Pension Liability Adjustment |
-44.1 |
-44.0 |
- |
- |
- |
|
Other Equity, Total |
-1,393.7 |
-1,260.8 |
-1,384.3 |
-1,217.3 |
-1,035.6 |
|
Total Equity |
1,833.1 |
1,975.6 |
1,876.3 |
2,067.6 |
2,017.6 |
|
|
|
|
|
|
|
|
Total Liabilities & Shareholders’ Equity |
13,589.5 |
12,832.9 |
12,938.6 |
12,726.6 |
12,397.7 |
|
|
|
|
|
|
|
|
Shares Outstanding - Common Stock Primary
Issue |
266.9 |
266.9 |
265.7 |
270.0 |
270.0 |
|
Total Common Shares Outstanding |
266.9 |
266.9 |
265.7 |
270.0 |
270.0 |
|
Treasury Shares - Common Stock Primary Issue |
4.4 |
4.3 |
5.5 |
1.3 |
1.3 |
|
Employees |
- |
34,391 |
35,882 |
35,831 |
34,929 |
Annual
Cash Flows
Standardized
Financials in: USD (mil)
Except for share items (millions) and per share items (actual units)
|
|
31-Mar-2011 |
31-Mar-2010 |
31-Mar-2009 |
31-Mar-2008 |
31-Mar-2007 |
|
Period Length |
12 Months |
12 Months |
12 Months |
12 Months |
12 Months |
|
UpdateType/Date |
Updated Normal |
Updated Normal |
Updated Normal |
Updated Normal |
Updated Normal |
|
Filed Currency |
JPY |
JPY |
JPY |
JPY |
JPY |
|
Exchange Rate
(Period Average) |
85.691434 |
92.941082 |
100.484331 |
114.302336 |
116.944303 |
|
Auditor |
Ernst &
Young LLP |
Ernst &
Young LLP |
KPMG LLP |
KPMG LLP |
Azsa Audit Corp. |
|
Auditor Opinion |
Unqualified |
Unqualified |
Unqualified with
Explanation |
Unqualified |
Unqualified |
|
|
|
|
|
|
|
|
Net Income/Starting Line |
265.6 |
927.5 |
-908.6 |
827.7 |
629.2 |
|
Depreciation |
401.6 |
465.6 |
445.9 |
328.3 |
260.0 |
|
Depreciation/Depletion |
401.6 |
465.6 |
445.9 |
328.3 |
260.0 |
|
Amortization of Acquisition Costs |
167.9 |
161.4 |
1,009.7 |
70.7 |
67.3 |
|
Amortization |
167.9 |
161.4 |
1,009.7 |
70.7 |
67.3 |
|
Unusual Items |
-46.4 |
-459.1 |
329.7 |
3.2 |
27.5 |
|
Equity in Net Earnings (Loss) |
-6.7 |
-3.3 |
17.0 |
24.2 |
20.5 |
|
Other Non-Cash Items |
113.8 |
149.5 |
220.3 |
109.2 |
119.7 |
|
Non-Cash Items |
60.7 |
-312.9 |
566.9 |
136.6 |
167.7 |
|
Accounts Receivable |
116.3 |
-114.7 |
167.1 |
-34.6 |
-149.1 |
|
Inventories |
-40.3 |
-29.6 |
59.9 |
-125.2 |
58.3 |
|
Prepaid Expenses |
-18.4 |
-8.8 |
-88.1 |
-76.6 |
5.8 |
|
Accounts Payable |
-111.5 |
127.1 |
-199.1 |
58.6 |
98.6 |
|
Accrued Expenses |
18.3 |
-13.5 |
-125.6 |
-0.3 |
135.7 |
|
Other Operating Cash Flow |
-476.0 |
-381.8 |
-513.9 |
-403.5 |
-345.8 |
|
Changes in Working Capital |
-511.7 |
-421.3 |
-699.6 |
-581.6 |
-196.5 |
|
Cash from Operating Activities |
384.1 |
820.4 |
414.3 |
781.7 |
927.7 |
|
|
|
|
|
|
|
|
Purchase of Fixed Assets |
-236.2 |
-425.0 |
-436.2 |
-419.5 |
-352.9 |
|
Purchase/Acquisition of Intangibles |
-109.5 |
-58.1 |
-55.9 |
0.0 |
- |
|
Capital Expenditures |
-345.7 |
-483.1 |
-492.1 |
-419.5 |
-352.9 |
|
Acquisition of Business |
-220.1 |
-77.7 |
-1.3 |
-2,031.8 |
-20.6 |
|
Sale of Business |
67.6 |
800.5 |
0.0 |
- |
- |
|
Sale of Fixed Assets |
- |
- |
0.0 |
20.2 |
5.5 |
|
Sale/Maturity of Investment |
890.3 |
290.4 |
786.0 |
449.9 |
104.6 |
|
Investment, Net |
0.0 |
-0.5 |
-1.2 |
0.0 |
-2.0 |
|
Purchase of Investments |
-167.7 |
-748.7 |
-511.0 |
-607.5 |
-557.1 |
|
Other Investing Cash Flow |
-31.3 |
-6.6 |
13.3 |
-73.6 |
-2.6 |
|
Other Investing Cash Flow Items, Total |
538.9 |
257.5 |
285.8 |
-2,242.7 |
-472.1 |
|
Cash from Investing Activities |
193.2 |
-225.6 |
-206.3 |
-2,662.3 |
-825.0 |
|
|
|
|
|
|
|
|
Other Financing Cash Flow |
-9.7 |
-7.8 |
-6.2 |
12.8 |
6.1 |
|
Financing Cash Flow Items |
-9.7 |
-7.8 |
-6.2 |
12.8 |
6.1 |
|
Cash Dividends Paid - Common |
-94.5 |
-43.6 |
-107.0 |
-104.0 |
-59.0 |
|
Total Cash Dividends Paid |
-94.5 |
-43.6 |
-107.0 |
-104.0 |
-59.0 |
|
Sale/Issuance of
Common |
- |
- |
- |
- |
0.0 |
|
Repurchase/Retirement
of Common |
-116.8 |
0.0 |
-101.9 |
0.0 |
- |
|
Common Stock, Net |
-116.8 |
0.0 |
-101.9 |
0.0 |
0.0 |
|
Issuance (Retirement) of Stock, Net |
-116.8 |
0.0 |
-101.9 |
0.0 |
0.0 |
|
Short Term Debt, Net |
-163.1 |
-48.8 |
-2,171.7 |
1,336.8 |
-171.2 |
|
Long Term Debt Issued |
402.6 |
1,031.1 |
3,034.2 |
325.4 |
544.1 |
|
Long Term Debt
Reduction |
-454.5 |
-744.2 |
-684.7 |
-132.6 |
-301.3 |
|
Long Term Debt, Net |
-51.9 |
286.9 |
2,349.5 |
192.8 |
242.8 |
|
Issuance (Retirement) of Debt, Net |
-215.0 |
238.1 |
177.8 |
1,529.6 |
71.6 |
|
Cash from Financing Activities |
-436.0 |
186.7 |
-37.3 |
1,438.3 |
18.7 |
|
|
|
|
|
|
|
|
Foreign Exchange Effects |
-69.2 |
-31.3 |
-44.1 |
-38.5 |
11.1 |
|
Net Change in Cash |
72.1 |
750.2 |
126.5 |
-480.8 |
132.5 |
|
|
|
|
|
|
|
|
Net Cash - Beginning Balance |
2,383.0 |
1,434.1 |
1,194.3 |
1,529.3 |
1,362.2 |
|
Net Cash - Ending Balance |
2,455.1 |
2,184.3 |
1,320.8 |
1,048.5 |
1,494.7 |
|
Cash Interest Paid |
152.7 |
134.1 |
160.6 |
121.3 |
106.5 |
|
Cash Taxes Paid |
357.8 |
220.6 |
364.8 |
360.2 |
242.0 |
Interim
Cash Flows
Standardized
Financials in: USD (mil)
Except for share items (millions) and per share items (actual units)
|
|
31-Mar-2011 |
31-Dec-2010 |
30-Sep-2010 |
30-Jun-2010 |
31-Mar-2010 |
|
Period Length |
12 Months |
9 Months |
6 Months |
3 Months |
12 Months |
|
UpdateType/Date |
Updated Normal |
Updated Normal |
Updated Normal |
Updated Normal |
Updated Normal |
|
Filed Currency |
JPY |
JPY |
JPY |
JPY |
JPY |
|
Exchange Rate
(Period Average) |
85.691434 |
86.812446 |
88.962162 |
92.080323 |
92.941082 |
|
|
|
|
|
|
|
|
Net Income/Starting Line |
265.6 |
268.2 |
178.8 |
91.9 |
927.5 |
|
Depreciation |
401.6 |
276.1 |
178.6 |
77.5 |
465.6 |
|
Depreciation/Depletion |
401.6 |
276.1 |
178.6 |
77.5 |
465.6 |
|
Amortization of Acquisition Costs |
167.9 |
128.4 |
82.4 |
38.6 |
161.4 |
|
Amortization |
167.9 |
128.4 |
82.4 |
38.6 |
161.4 |
|
Unusual Items |
-46.4 |
15.2 |
13.8 |
0.7 |
-459.1 |
|
Equity in Net Earnings (Loss) |
-6.7 |
- |
- |
- |
-3.3 |
|
Other Non-Cash Items |
113.8 |
98.9 |
68.5 |
32.6 |
149.5 |
|
Non-Cash Items |
60.7 |
114.1 |
82.3 |
33.3 |
-312.9 |
|
Accounts Receivable |
116.3 |
155.9 |
213.4 |
245.1 |
-114.7 |
|
Inventories |
-40.3 |
-112.0 |
-104.1 |
-86.6 |
-29.6 |
|
Prepaid Expenses |
-18.4 |
- |
- |
- |
-8.8 |
|
Accounts Payable |
-111.5 |
-132.9 |
-228.5 |
-110.3 |
127.1 |
|
Accrued Expenses |
18.3 |
-110.8 |
-66.1 |
-47.5 |
-13.5 |
|
Other Operating Cash Flow |
-476.0 |
-377.6 |
-234.0 |
-104.7 |
-381.8 |
|
Changes in Working Capital |
-511.7 |
-577.4 |
-419.3 |
-104.1 |
-421.3 |
|
Cash from Operating Activities |
384.1 |
209.4 |
102.8 |
137.2 |
820.4 |
|
|
|
|
|
|
|
|
Purchase of Fixed Assets |
-236.2 |
-164.1 |
-112.2 |
-55.1 |
-425.0 |
|
Purchase/Acquisition of Intangibles |
-109.5 |
-62.4 |
-32.5 |
-4.8 |
-58.1 |
|
Capital Expenditures |
-345.7 |
-226.5 |
-144.7 |
-59.9 |
-483.1 |
|
Acquisition of Business |
-220.1 |
-143.0 |
-142.7 |
0.0 |
-77.7 |
|
Sale of Business |
67.6 |
22.8 |
22.3 |
21.5 |
800.5 |
|
Sale/Maturity of Investment |
890.3 |
482.8 |
404.1 |
16.6 |
290.4 |
|
Investment, Net |
0.0 |
0.0 |
0.0 |
4.9 |
-0.5 |
|
Purchase of Investments |
-167.7 |
-127.6 |
-76.0 |
-58.9 |
-748.7 |
|
Other Investing Cash Flow |
-31.3 |
-18.3 |
-3.4 |
-89.8 |
-6.6 |
|
Other Investing Cash Flow Items, Total |
538.9 |
216.7 |
204.3 |
-105.7 |
257.5 |
|
Cash from Investing Activities |
193.2 |
-9.8 |
59.5 |
-165.6 |
-225.6 |
|
|
|
|
|
|
|
|
Other Financing Cash Flow |
-9.7 |
-6.6 |
-4.5 |
-2.1 |
-7.8 |
|
Financing Cash Flow Items |
-9.7 |
-6.6 |
-4.5 |
-2.1 |
-7.8 |
|
Cash Dividends Paid - Common |
-94.5 |
-93.3 |
-45.5 |
-41.8 |
-43.6 |
|
Total Cash Dividends Paid |
-94.5 |
-93.3 |
-45.5 |
-41.8 |
-43.6 |
|
Repurchase/Retirement
of Common |
-116.8 |
-115.2 |
- |
- |
0.0 |
|
Common Stock, Net |
-116.8 |
-115.2 |
- |
- |
0.0 |
|
Issuance (Retirement) of Stock, Net |
-116.8 |
-115.2 |
- |
- |
0.0 |
|
Short Term Debt, Net |
-163.1 |
-134.2 |
-97.7 |
-26.5 |
-48.8 |
|
Long Term Debt Issued |
402.6 |
297.0 |
281.1 |
0.1 |
1,031.1 |
|
Long Term Debt
Reduction |
-454.5 |
-288.1 |
-273.7 |
-20.4 |
-744.2 |
|
Long Term Debt, Net |
-51.9 |
9.0 |
7.4 |
-20.3 |
286.9 |
|
Issuance (Retirement) of Debt, Net |
-215.0 |
-125.3 |
-90.3 |
-46.7 |
238.1 |
|
Cash from Financing Activities |
-436.0 |
-340.4 |
-140.2 |
-90.6 |
186.7 |
|
|
|
|
|
|
|
|
Foreign Exchange Effects |
-69.2 |
-87.9 |
-64.8 |
-56.9 |
-31.3 |
|
Net Change in Cash |
72.1 |
-228.7 |
-42.7 |
-175.8 |
750.2 |
|
|
|
|
|
|
|
|
Net Cash - Beginning Balance |
2,383.0 |
2,350.6 |
2,293.8 |
2,216.1 |
1,434.1 |
|
Net Cash - Ending Balance |
2,455.1 |
2,121.8 |
2,251.1 |
2,040.3 |
2,184.3 |
|
Cash Interest Paid |
152.7 |
88.8 |
69.7 |
17.5 |
134.1 |
|
Cash Taxes Paid |
357.8 |
286.7 |
181.0 |
104.7 |
220.6 |
Annual
Income Statement
As Reported
Financials in: USD (mil)
Except for share items (millions) and per share items (actual units)
|
|
31-Mar-2011 |
31-Mar-2010 |
31-Mar-2009 |
31-Mar-2008 |
31-Mar-2007 |
|
Period Length |
12 Months |
12 Months |
12 Months |
12 Months |
12 Months |
|
UpdateType/Date |
Updated Normal |
Updated Normal |
Updated Normal |
Updated Normal |
Updated Normal |
|
Filed Currency |
JPY |
JPY |
JPY |
JPY |
JPY |
|
Exchange Rate
(Period Average) |
85.691434 |
92.941082 |
100.484331 |
114.302336 |
116.944303 |
|
Auditor |
Ernst &
Young LLP |
Ernst &
Young LLP |
KPMG LLP |
KPMG LLP |
Azsa Audit Corp. |
|
Auditor Opinion |
Unqualified |
Unqualified |
Unqualified with
Explanation |
Unqualified |
Unqualified |
|
|
|
|
|
|
|
|
Net Sales |
9,885.5 |
9,501.6 |
9,760.8 |
9,876.2 |
9,079.4 |
|
Total Revenue |
9,885.5 |
9,501.6 |
9,760.8 |
9,876.2 |
9,079.4 |
|
|
|
|
|
|
|
|
Cost of Sales |
5,362.4 |
5,109.1 |
5,170.8 |
5,418.9 |
5,229.0 |
|
Advertising & sale promotion expenses |
520.7 |
438.0 |
528.0 |
513.2 |
414.4 |
|
Provision for doubtful accounts (SGA) |
- |
1.0 |
23.0 |
4.2 |
- |
|
Salaries |
1,197.2 |
1,133.0 |
1,133.7 |
917.9 |
804.9 |
|
Bonuses |
221.2 |
202.2 |
192.6 |
245.9 |
208.9 |
|
Accrued Retirement Expenses |
88.0 |
98.2 |
53.7 |
27.1 |
51.1 |
|
Reserve for officers retirement |
- |
- |
0.6 |
0.4 |
0.4 |
|
Amortization of Consolidation Adjustment |
167.9 |
136.3 |
251.4 |
70.7 |
67.3 |
|
Research & Development |
451.7 |
387.6 |
457.1 |
337.3 |
275.1 |
|
Depreciation |
283.6 |
296.0 |
314.4 |
198.4 |
167.2 |
|
Other SGA |
1,180.2 |
1,053.1 |
1,291.4 |
1,156.8 |
1,016.8 |
|
SP Compensation for Delay |
- |
- |
- |
- |
0.0 |
|
SP Gain on negative goodwill |
-28.1 |
0.0 |
- |
- |
- |
|
SP Other Special Gains |
0.0 |
-11.4 |
0.0 |
- |
- |
|
SP Impairment Loss |
0.0 |
14.6 |
18.1 |
9.6 |
13.8 |
|
SP Valuation Loss-Invest.Sec |
12.3 |
65.4 |
157.2 |
13.0 |
15.0 |
|
SP Loss on step acquisitions |
3.6 |
0.0 |
- |
- |
- |
|
SP L on adjust. for acct. assets change |
3.6 |
0.0 |
- |
- |
- |
|
SP Loss on disaster |
7.1 |
0.0 |
- |
- |
- |
|
SP Amort. of consol differences |
0.0 |
25.1 |
758.3 |
0.0 |
- |
|
SP L. on prior year's adjustment |
- |
0.0 |
154.4 |
0.0 |
- |
|
SP Debt Guarantee Reserve |
- |
- |
- |
0.0 |
0.0 |
|
SP Other Special Losses |
0.0 |
6.8 |
0.0 |
- |
- |
|
Total Operating Expense |
9,471.4 |
8,954.9 |
10,504.6 |
8,913.5 |
8,264.1 |
|
|
|
|
|
|
|
|
SP Gain Sale Affiliate Stock |
0.7 |
27.3 |
0.0 |
2.7 |
1.4 |
|
SP Sale Gain-Fixed Asst |
- |
- |
0.0 |
12.9 |
0.0 |
|
SP Change-Eqty.Method |
- |
- |
0.0 |
16.7 |
0.0 |
|
SP Gain on Business Transfer |
31.5 |
512.9 |
0.0 |
2.6 |
0.0 |
|
SP Sale Gain-Invest.Sec |
11.1 |
7.7 |
6.9 |
1.0 |
4.9 |
|
SP Gain Sale Trust |
- |
- |
- |
- |
0.0 |
|
SP Loss Sale Affiliate Stock |
-1.6 |
-1.2 |
0.0 |
- |
- |
|
SP Sale Loss-Invest.Sec |
-36.0 |
-4.2 |
-10.5 |
0.0 |
- |
|
NOP Interest Income |
10.4 |
12.1 |
24.1 |
28.0 |
15.4 |
|
NOP Dividend Income |
9.1 |
8.0 |
10.0 |
8.4 |
4.4 |
|
NOP Royalty income |
3.8 |
3.8 |
3.5 |
1.1 |
3.8 |
|
NOP Exchange Gain |
30.5 |
14.7 |
49.8 |
4.0 |
0.0 |
|
NOP Gain Sale of Investment Securities |
31.9 |
0.0 |
- |
- |
0.0 |
|
NOP Gain-Equity Method |
6.7 |
3.3 |
0.0 |
- |
- |
|
NOP Rent Income |
- |
- |
- |
- |
0.0 |
|
NOP Other Non-op. Income |
32.4 |
26.1 |
28.2 |
37.1 |
30.5 |
|
NOP Interest Expense |
-148.7 |
-133.6 |
-161.1 |
-121.7 |
-107.5 |
|
NOP Exchange Loss |
- |
- |
- |
0.0 |
-35.2 |
|
NOP Loss-Equity Method |
- |
0.0 |
-17.0 |
-24.2 |
-20.5 |
|
NOP L on equity invt. Assoc |
- |
- |
0.0 |
-25.3 |
0.0 |
|
NOP Other Non-op.Expense |
-130.2 |
-96.2 |
-98.8 |
-78.4 |
-83.4 |
|
Net Income Before Taxes |
265.6 |
927.5 |
-908.6 |
827.7 |
629.2 |
|
|
|
|
|
|
|
|
Provision for Income Taxes |
174.2 |
411.7 |
257.5 |
321.6 |
223.0 |
|
Net Income After Taxes |
91.4 |
515.8 |
-1,166.1 |
506.1 |
406.2 |
|
|
|
|
|
|
|
|
Minority Interest |
-5.2 |
-1.9 |
23.5 |
1.0 |
2.6 |
|
Net Income Before Extra. Items |
86.1 |
513.9 |
-1,142.6 |
507.2 |
408.7 |
|
Net Income |
86.1 |
513.9 |
-1,142.6 |
507.2 |
408.7 |
|
|
|
|
|
|
|
|
Directors' Bonus |
- |
- |
- |
0.0 |
0.0 |
|
Income Available to Com Excl ExtraOrd |
86.1 |
513.9 |
-1,142.6 |
507.2 |
408.7 |
|
|
|
|
|
|
|
|
Income Available to Com Incl ExtraOrd |
86.1 |
513.9 |
-1,142.6 |
507.2 |
408.7 |
|
|
|
|
|
|
|
|
Basic Weighted Average Shares |
268.7 |
269.5 |
267.7 |
270.3 |
270.4 |
|
Basic EPS Excluding ExtraOrdinary Items |
0.32 |
1.91 |
-4.27 |
1.88 |
1.51 |
|
Basic EPS Including ExtraOrdinary Item |
0.32 |
1.91 |
-4.27 |
1.88 |
1.51 |
|
Dilution Adjustment |
0.0 |
0.0 |
0.0 |
-0.1 |
0.0 |
|
Diluted Net Income |
86.1 |
513.9 |
-1,142.6 |
507.1 |
408.7 |
|
Diluted Weighted Average Shares |
268.7 |
269.5 |
267.7 |
270.3 |
270.4 |
|
Diluted EPS Excluding ExtraOrd Items |
0.32 |
1.91 |
-4.27 |
1.88 |
1.51 |
|
Diluted EPS Including ExtraOrd Items |
0.32 |
1.91 |
-4.27 |
1.88 |
1.51 |
|
DPS-Common Stock |
0.35 |
0.32 |
0.20 |
0.35 |
0.30 |
|
Gross Dividends - Common Stock |
94.0 |
87.1 |
53.2 |
94.6 |
80.9 |
|
Normalized Income Before Taxes |
400.6 |
651.3 |
430.8 |
905.4 |
725.3 |
|
|
|
|
|
|
|
|
Inc Tax Ex Impact of Sp Items |
162.7 |
217.5 |
372.8 |
324.3 |
233.3 |
|
Normalized Income After Taxes |
237.9 |
433.8 |
57.9 |
581.1 |
492.1 |
|
|
|
|
|
|
|
|
Normalized Inc. Avail to Com. |
232.6 |
431.9 |
81.4 |
582.1 |
494.7 |
|
|
|
|
|
|
|
|
Basic Normalized EPS |
0.87 |
1.60 |
0.30 |
2.15 |
1.83 |
|
Diluted Normalized EPS |
0.87 |
1.60 |
0.30 |
2.15 |
1.83 |
|
Interest Expense |
148.7 |
133.6 |
161.1 |
121.7 |
20.5 |
|
Amort of Goodwill |
167.9 |
161.4 |
1,009.7 |
70.7 |
67.3 |
|
R & D Expenses (SGA) |
451.7 |
387.6 |
457.1 |
337.3 |
275.1 |
|
R & D Expenses (COGS) |
333.5 |
277.9 |
239.7 |
239.5 |
199.8 |
|
Depreciation |
401.6 |
465.6 |
445.9 |
328.3 |
260.0 |
|
Advertising & sale promotion expenses |
520.7 |
438.0 |
528.0 |
513.2 |
414.4 |
|
Reported Operating Profit |
412.6 |
647.2 |
344.2 |
985.3 |
844.2 |
|
Reported Ordinary Profit |
258.5 |
485.4 |
183.0 |
814.4 |
651.8 |
|
Service Cost |
76.9 |
68.9 |
66.1 |
56.0 |
55.0 |
|
Interest Cost |
47.0 |
41.1 |
35.1 |
31.8 |
29.6 |
|
Expected Return on Plan Assets |
-64.0 |
-55.3 |
-56.9 |
-53.4 |
-47.2 |
|
Prior Service Cost |
-12.5 |
-8.6 |
-7.8 |
-6.8 |
-9.5 |
|
Actuarial Gains and Losses |
46.1 |
54.2 |
18.6 |
4.7 |
23.0 |
|
Domestic Pension Plan Expense |
93.4 |
100.3 |
55.0 |
32.4 |
50.9 |
|
Defined Contribution Expense |
3.1 |
- |
- |
- |
- |
|
Total Pension Expense |
96.5 |
100.3 |
55.0 |
32.4 |
50.9 |
|
Discount rate |
2.00% |
2.00% |
2.00% |
2.00% |
2.00% |
|
Expected rate of return |
4.00% |
4.00% |
4.00% |
4.00% |
4.00% |
Interim
Income Statement
As Reported
Financials in: USD (mil)
Except for share items (millions) and per share items (actual units)
|
|
30-Jun-2011 |
31-Mar-2011 |
31-Dec-2010 |
30-Sep-2010 |
30-Jun-2010 |
|
Period Length |
3 Months |
3 Months |
3 Months |
3 Months |
3 Months |
|
UpdateType/Date |
Updated Normal |
Updated Normal |
Updated Normal |
Updated Normal |
Updated Normal |
|
Filed Currency |
JPY |
JPY |
JPY |
JPY |
JPY |
|
Exchange Rate
(Period Average) |
81.605269 |
82.241044 |
82.567473 |
85.838925 |
92.080323 |
|
|
|
|
|
|
|
|
Net sales |
2,433.3 |
2,712.7 |
2,503.2 |
2,461.8 |
2,237.2 |
|
Total Revenue |
2,433.3 |
2,712.7 |
2,503.2 |
2,461.8 |
2,237.2 |
|
|
|
|
|
|
|
|
Cost of Sales |
1,332.7 |
1,516.1 |
1,365.6 |
1,315.2 |
1,185.6 |
|
Sell.&Gen.&Admin. |
1,045.9 |
- |
- |
- |
- |
|
Sales promotion & advert. exp. |
- |
141.1 |
121.8 |
143.7 |
115.4 |
|
Salaries |
- |
315.0 |
305.3 |
298.9 |
280.5 |
|
Bonuses |
- |
56.7 |
55.7 |
58.7 |
50.5 |
|
Accrued Retirement Expenses |
- |
22.2 |
18.0 |
24.4 |
23.1 |
|
Amortization of Goodwill |
- |
39.4 |
46.3 |
43.9 |
38.6 |
|
R&D Costs |
- |
117.8 |
114.6 |
124.5 |
96.3 |
|
Depreciation |
- |
79.9 |
70.7 |
67.9 |
65.8 |
|
Other SGA |
- |
356.4 |
297.1 |
271.8 |
260.2 |
|
SP Other special gains |
- |
-29.3 |
- |
- |
- |
|
SP Impairment Loss |
2.0 |
0.0 |
0.0 |
0.0 |
0.0 |
|
SP Reserve for investment losses |
- |
- |
- |
0.0 |
- |
|
SP Val.Loss-Invest.Sec |
0.0 |
- |
-33.9 |
33.5 |
0.7 |
|
SP Loss on step acquisitions |
0.0 |
0.0 |
- |
- |
3.4 |
|
SP L on adjust. for acct. assets change |
0.0 |
0.0 |
- |
- |
3.4 |
|
SP Amortization of goodwill |
- |
0.0 |
0.0 |
- |
- |
|
SP Other Special losses |
- |
18.5 |
0.0 |
- |
- |
|
Total Operating Expense |
2,380.6 |
2,633.7 |
2,361.3 |
2,382.6 |
2,123.5 |
|
|
|
|
|
|
|
|
SP Sale Gain Affili. Stocks |
0.0 |
0.0 |
0.0 |
0.0 |
0.7 |
|
SP Gain on transfer of business |
- |
32.8 |
0.0 |
- |
- |
|
SP Sale Gain-Invest.Sec |
0.0 |
1.8 |
6.4 |
2.5 |
0.6 |
|
SP Sale Loss Affili. Stocks |
- |
-0.9 |
-0.8 |
- |
- |
|
SP Sale Loss-Invest.Sec |
0.0 |
-3.0 |
-34.3 |
0.0 |
-0.1 |
|
NOP Interest Income |
3.1 |
2.4 |
2.5 |
3.3 |
2.2 |
|
NOP Dividend Income |
5.0 |
0.5 |
3.3 |
0.8 |
4.3 |
|
NOP Exchange Gain |
- |
- |
13.4 |
33.9 |
- |
|
NOP G on sale of invest. sec. |
- |
14.4 |
- |
18.0 |
- |
|
NOP Other Non-op. Income |
9.6 |
12.8 |
7.5 |
5.2 |
16.8 |
|
NOP Interest Expense |
-39.5 |
-41.9 |
-37.7 |
-36.1 |
-33.5 |
|
NOP Exchange Loss |
-3.5 |
-10.5 |
- |
- |
-5.9 |
|
NOP Other Non-op.Expense |
-28.6 |
-93.6 |
-13.1 |
-20.1 |
-7.0 |
|
Net Income Before Taxes |
-1.2 |
-6.3 |
89.2 |
86.8 |
91.9 |
|
|
|
|
|
|
|
|
Provision for Income Taxes |
24.6 |
9.0 |
67.1 |
22.5 |
72.9 |
|
Net Income After Taxes |
-25.8 |
-15.3 |
22.1 |
64.3 |
18.9 |
|
|
|
|
|
|
|
|
Minority Interest |
-0.6 |
-0.4 |
-2.4 |
0.3 |
-2.6 |
|
Net Income Before Extra. Items |
-26.4 |
-15.8 |
19.7 |
64.6 |
16.3 |
|
Net Income |
-26.4 |
-15.8 |
19.7 |
64.6 |
16.3 |
|
|
|
|
|
|
|
|
Income Available to Com Excl ExtraOrd |
-26.4 |
-15.8 |
19.7 |
64.6 |
16.3 |
|
|
|
|
|
|
|
|
Income Available to Com Incl ExtraOrd |
-26.4 |
-15.8 |
19.7 |
64.6 |
16.3 |
|
|
|
|
|
|
|
|
Basic Weighted Average Shares |
266.9 |
266.1 |
268.6 |
270.0 |
270.0 |
|
Basic EPS Excluding ExtraOrdinary Items |
-0.10 |
-0.06 |
0.07 |
0.24 |
0.06 |
|
Basic EPS Including ExtraOrdinary Item |
-0.10 |
-0.06 |
0.07 |
0.24 |
0.06 |
|
Dilution Adjustment |
0.0 |
0.0 |
0.0 |
0.0 |
0.0 |
|
Diluted Net Income |
-26.4 |
-15.8 |
19.7 |
64.6 |
16.3 |
|
Diluted Weighted Average Shares |
266.9 |
266.1 |
268.6 |
270.0 |
270.0 |
|
Diluted EPS Excluding ExtraOrd Items |
-0.10 |
-0.06 |
0.07 |
0.24 |
0.06 |
|
Diluted EPS Including ExtraOrd Items |
-0.10 |
-0.06 |
0.07 |
0.24 |
0.06 |
|
DPS-Common Stock |
0.00 |
0.18 |
0.00 |
0.17 |
0.00 |
|
Gross Dividends - Common Stock |
0.0 |
48.7 |
0.0 |
47.2 |
0.0 |
|
Normalized Income Before Taxes |
44.5 |
-10.5 |
101.6 |
164.2 |
137.9 |
|
|
|
|
|
|
|
|
Inc Tax Ex Impact of Sp Items |
25.3 |
-6.2 |
55.3 |
31.2 |
75.5 |
|
Normalized Income After Taxes |
19.2 |
-4.2 |
46.3 |
133.0 |
62.4 |
|
|
|
|
|
|
|
|
Normalized Inc. Avail to Com. |
18.6 |
-4.7 |
44.0 |
133.4 |
59.8 |
|
|
|
|
|
|
|
|
Basic Normalized EPS |
0.07 |
-0.02 |
0.16 |
0.49 |
0.22 |
|
Diluted Normalized EPS |
0.07 |
-0.02 |
0.16 |
0.49 |
0.22 |
|
R & D Costs (SGA) |
- |
117.8 |
114.6 |
124.5 |
96.3 |
|
Sales promotion & advert. exp. |
- |
141.1 |
121.8 |
143.7 |
115.4 |
|
Interest Expense |
39.5 |
41.9 |
37.7 |
36.1 |
33.5 |
|
Depreciation |
102.0 |
126.9 |
97.9 |
102.0 |
77.5 |
|
Amortization of Goodwill |
43.7 |
39.4 |
46.3 |
43.9 |
38.6 |
|
Reported Operating Profit |
54.7 |
68.2 |
108.1 |
112.7 |
121.1 |
|
Reported Ordinary Profit |
0.8 |
-47.8 |
84.0 |
117.8 |
98.1 |
Annual
Balance Sheet
As Reported
Financials in: USD (mil)
Except for share items (millions) and per share items (actual units)
|
|
31-Mar-2011 |
31-Mar-2010 |
31-Mar-2009 |
31-Mar-2008 |
31-Mar-2007 |
|
UpdateType/Date |
Updated Normal |
Updated Normal |
Updated Normal |
Updated Normal |
Updated Normal |
|
Filed Currency |
JPY |
JPY |
JPY |
JPY |
JPY |
|
Exchange Rate |
82.88 |
93.44 |
98.77 |
99.535 |
118.075 |
|
Auditor |
Ernst &
Young LLP |
Ernst &
Young LLP |
KPMG LLP |
KPMG LLP |
Azsa Audit Corp. |
|
Auditor Opinion |
Unqualified |
Unqualified |
Unqualified with
Explanation |
Unqualified |
Unqualified |
|
|
|
|
|
|
|
|
Cash and Deposit |
2,576.7 |
2,213.0 |
1,385.8 |
1,590.2 |
1,834.3 |
|
Note&Acct.Rcvbl. |
1,703.4 |
1,650.7 |
1,622.5 |
1,944.6 |
1,633.3 |
|
Lease receivable&Lease Investment |
208.6 |
132.7 |
120.3 |
60.4 |
- |
|
Marketable Sec. |
- |
0.0 |
2.0 |
0.0 |
70.7 |
|
Inventories |
- |
- |
- |
- |
760.9 |
|
Inventories - merchandise&finished goods |
666.6 |
610.5 |
594.1 |
655.3 |
- |
|
Inventories - work-in-process |
240.8 |
202.4 |
214.9 |
267.3 |
- |
|
Inventories - raw materials & supplies |
215.4 |
157.7 |
167.8 |
190.8 |
- |
|
Dfrd. Tax Asset |
393.0 |
418.1 |
373.0 |
368.9 |
273.7 |
|
Other Curr.Asset |
466.4 |
347.2 |
370.7 |
412.1 |
307.1 |
|
Doubtful Account |
-31.9 |
-29.3 |
-44.5 |
-31.2 |
-28.6 |
|
Total Current Assets |
6,438.9 |
5,702.9 |
4,806.8 |
5,458.4 |
4,851.5 |
|
|
|
|
|
|
|
|
Buildings & Structures |
1,641.8 |
1,476.7 |
1,462.1 |
1,268.5 |
1,088.3 |
|
Buildings & Structures, Dep. |
-867.3 |
-747.6 |
-683.1 |
-652.6 |
- |
|
Machinery & Equipment |
679.6 |
613.6 |
619.6 |
581.1 |
481.3 |
|
Machinery & Equipment, Dep. |
-517.8 |
-460.6 |
-449.6 |
-396.7 |
- |
|
Tool and Fixture |
1,811.0 |
1,634.1 |
1,634.4 |
1,552.1 |
1,218.7 |
|
Tool and Fixture, Dep. |
-1,355.6 |
-1,241.7 |
-1,202.8 |
-1,123.2 |
- |
|
Land |
234.6 |
204.0 |
201.0 |
213.9 |
158.7 |
|
Lease assets, gross |
92.4 |
62.1 |
69.0 |
0.0 |
- |
|
Accum. depr - lease assets |
-32.1 |
-20.7 |
-33.5 |
0.0 |
- |
|
Construction |
34.2 |
26.4 |
34.3 |
64.3 |
9.4 |
|
Depreciation |
- |
- |
- |
- |
-1,769.9 |
|
Goodwill |
2,117.2 |
2,076.9 |
1,827.9 |
3,012.0 |
666.7 |
|
Other Intangible Asset |
880.0 |
766.1 |
851.3 |
1,047.2 |
183.2 |
|
Investment Sec. |
680.4 |
1,393.1 |
1,287.3 |
1,947.5 |
1,834.7 |
|
Equity secs.-nonconsol affil.&sub. |
35.6 |
108.1 |
- |
- |
- |
|
LT Loan |
69.2 |
42.7 |
38.6 |
32.9 |
4.8 |
|
Dfrd. Tax Asset |
184.9 |
101.6 |
158.6 |
97.1 |
81.4 |
|
Other Assets |
714.8 |
607.1 |
591.7 |
548.6 |
442.1 |
|
Doubtful Account |
-8.9 |
-13.6 |
-12.5 |
-4.2 |
-4.1 |
|
Total Assets |
12,832.9 |
12,331.2 |
11,201.0 |
13,646.9 |
9,246.7 |
|
|
|
|
|
|
|
|
Note&Acct. Pybl. |
829.1 |
792.7 |
674.3 |
839.9 |
849.1 |
|
ST Borrowing |
773.3 |
803.4 |
824.2 |
3,134.2 |
1,185.5 |
|
LT borrowings (current) |
762.6 |
201.8 |
158.5 |
269.5 |
72.4 |
|
Current lease obligations |
- |
9.3 |
10.7 |
- |
- |
|
Curr.-Corp.Bond |
2.9 |
214.5 |
205.5 |
353.7 |
0.8 |
|
Other accounts payable |
441.9 |
421.1 |
557.9 |
765.4 |
0.0 |
|
Accrued Expense |
719.9 |
640.2 |
664.1 |
828.5 |
656.6 |
|
Income Tax Pybl. |
114.0 |
182.9 |
85.1 |
- |
- |
|
Prov-Prod.Wrrty. |
100.9 |
103.9 |
89.9 |
101.9 |
74.2 |
|
Business Tax Payable |
- |
- |
- |
141.9 |
140.9 |
|
Other Allowance |
9.8 |
0.0 |
0.6 |
1.3 |
1.6 |
|
Other Curr.Liab. |
178.4 |
188.0 |
190.8 |
219.2 |
492.5 |
|
Total Current Liabilities |
3,932.8 |
3,557.8 |
3,461.6 |
6,655.5 |
3,473.4 |
|
|
|
|
|
|
|
|
Corporate Bond |
1,328.7 |
1,181.1 |
1,318.2 |
1,058.9 |
1,189.8 |
|
LT Borrowing |
4,960.6 |
4,678.4 |
4,177.9 |
1,782.0 |
1,466.2 |
|
Lease obligations |
- |
33.6 |
31.9 |
- |
- |
|
Total Long Term Debt |
6,289.2 |
5,893.0 |
5,528.1 |
2,840.9 |
2,656.0 |
|
|
|
|
|
|
|
|
Deferred tax liabilities (non-current) |
259.8 |
315.8 |
284.2 |
306.3 |
0.0 |
|
Res-Accr.Retire |
226.8 |
212.8 |
189.8 |
103.7 |
80.7 |
|
Res-Direc.Retire |
1.9 |
1.6 |
1.3 |
1.2 |
0.7 |
|
Reserve for Guarantee of Debts |
- |
- |
0.0 |
4.5 |
3.8 |
|
Reserve for Affiliate Liquidation Loss |
- |
- |
- |
- |
0.0 |
|
Other Liability |
109.4 |
28.9 |
27.1 |
38.9 |
111.3 |
|
Minor. Interest |
37.4 |
79.8 |
75.1 |
115.8 |
90.3 |
|
Total Liabilities |
10,857.4 |
10,089.8 |
9,567.2 |
10,066.8 |
6,416.2 |
|
|
|
|
|
|
|
|
Common Stock |
583.2 |
517.3 |
489.3 |
485.6 |
409.3 |
|
Paid In Capital |
661.1 |
590.4 |
739.6 |
733.9 |
618.7 |
|
Retained Earning |
2,056.5 |
1,800.5 |
1,117.8 |
2,389.3 |
1,618.6 |
|
Unreal.Gain-Sec |
78.7 |
97.4 |
-14.8 |
63.5 |
136.2 |
|
Deferred Hedge |
-9.1 |
-4.7 |
-13.5 |
0.3 |
-1.6 |
|
Translation Adj. |
-1,216.8 |
-715.2 |
-554.4 |
-66.0 |
68.4 |
|
Treasury Stock |
-133.9 |
-44.3 |
-130.3 |
-26.5 |
-19.2 |
|
Pension obligation adjustments |
-44.0 |
0.0 |
- |
- |
- |
|
Total Equity |
1,975.6 |
2,241.4 |
1,633.7 |
3,580.2 |
2,830.5 |
|
|
|
|
|
|
|
|
Total Liabilities & Shareholders' Equity |
12,832.9 |
12,331.2 |
11,201.0 |
13,646.9 |
9,246.7 |
|
|
|
|
|
|
|
|
S/O-Common Stock |
266.9 |
270.0 |
267.2 |
270.2 |
270.3 |
|
Total Common Shares Outstanding |
266.9 |
270.0 |
267.2 |
270.2 |
270.3 |
|
T/S-Common Stock |
4.3 |
1.3 |
4.1 |
1.0 |
1.0 |
|
Full-Time Employees |
34,391 |
35,376 |
36,503 |
35,772 |
32,958 |
|
Number of Common Shareholders |
17,720 |
14,788 |
8,473 |
7,693 |
7,214 |
|
Debts <1Yr. |
765.5 |
416.3 |
364.1 |
623.2 |
73.2 |
|
Debts <2Yr. |
583.2 |
680.9 |
661.5 |
353.8 |
546.7 |
|
Debts <3Yr. |
1,260.1 |
524.7 |
596.5 |
701.2 |
308.1 |
|
Debts <4Yr. |
1,064.4 |
1,080.8 |
437.2 |
577.3 |
563.8 |
|
Debts <5Yr. |
624.7 |
939.0 |
1,010.8 |
432.3 |
485.9 |
|
Debts Remaining |
2,774.8 |
2,633.9 |
2,790.1 |
776.3 |
751.4 |
|
Total Long Term Debt, Supplemental |
7,072.8 |
6,275.8 |
5,860.2 |
3,464.0 |
2,729.1 |
|
Capital Leases Maturing within 1 Yr |
13.5 |
9.3 |
10.7 |
- |
- |
|
Capital Leases Maturing within 2 Yr |
14.6 |
8.3 |
10.0 |
- |
- |
|
Capital Leases Maturing within 3 Yr |
11.5 |
6.7 |
8.3 |
- |
- |
|
Capital Leases Maturing within 4 Yr |
9.1 |
5.6 |
6.4 |
- |
- |
|
Capital Leases Maturing within 5 Yr |
7.8 |
4.1 |
3.9 |
- |
- |
|
Capital Leases Remaining Maturities |
4.2 |
8.9 |
3.2 |
- |
- |
|
Total Capital Leases |
60.6 |
42.8 |
42.6 |
- |
- |
|
Pension Obligation |
1,566.7 |
1,453.1 |
1,285.8 |
1,245.8 |
1,045.6 |
|
Fair Value of Plan Assets |
1,504.9 |
1,321.4 |
1,065.1 |
1,224.9 |
1,086.1 |
|
Funded Status |
-61.9 |
-131.7 |
-220.7 |
-20.9 |
40.6 |
|
Total Funded Status |
-61.9 |
-131.7 |
-220.7 |
-20.9 |
40.6 |
|
Discount Rate |
2.00% |
2.00% |
2.00% |
2.00% |
2.00% |
|
Expected Rate of Return |
4.00% |
4.00% |
4.00% |
4.00% |
4.00% |
|
Unrecognized Prior Service Cost |
105.2 |
1.3 |
-10.2 |
-18.8 |
-23.2 |
|
Unrecognized Actuarial Gains and Losses |
217.8 |
153.6 |
258.6 |
90.5 |
-37.2 |
|
Prepaid Pension Benefits |
277.6 |
233.4 |
217.4 |
154.4 |
60.8 |
|
Reserve for accrued retirement benefits |
-226.8 |
-212.8 |
-189.8 |
-103.7 |
-80.7 |
|
Net Assets Recognized on Balance Sheet |
373.8 |
175.5 |
276.0 |
122.4 |
-80.3 |
Interim
Balance Sheet
As Reported
Financials in: USD
(mil)
Except for share
items (millions) and per share items (actual units)
|
|
30-Jun-2011 |
31-Mar-2011 |
31-Dec-2010 |
30-Sep-2010 |
30-Jun-2010 |
|
UpdateType/Date |
Updated Normal |
Updated Normal |
Updated Normal |
Updated Normal |
Updated Normal |
|
Filed Currency |
JPY |
JPY |
JPY |
JPY |
JPY |
|
Exchange Rate |
80.76 |
82.88 |
81.105 |
83.54 |
88.49 |
|
|
|
|
|
|
|
|
Cash and Deposit |
3,305.5 |
2,576.7 |
2,319.5 |
2,451.7 |
2,189.4 |
|
Note&Acct.Receivable |
1,588.7 |
1,703.4 |
1,650.9 |
1,571.9 |
1,435.1 |
|
Marketable Security |
24.8 |
0.0 |
12.3 |
- |
- |
|
Inventories - merchandise&finished goods |
690.2 |
666.6 |
691.4 |
716.8 |
704.2 |
|
Inventories - work-in-process |
312.3 |
240.8 |
248.3 |
224.3 |
187.6 |
|
Inventories - raw materials & supplies |
252.4 |
215.4 |
226.6 |
208.4 |
174.6 |
|
Other Current Asset |
1,073.5 |
1,068.0 |
1,101.4 |
954.0 |
931.5 |
|
Allowance for doubtful accounts |
-33.1 |
-31.9 |
-32.6 |
-29.1 |
-26.7 |
|
Total Current Assets |
7,214.3 |
6,438.9 |
6,217.9 |
6,098.0 |
5,595.7 |
|
|
|
|
|
|
|
|
Building&Structure |
769.8 |
774.5 |
768.4 |
776.9 |
747.0 |
|
Machineries, equipment, &vehicles, net |
159.7 |
161.8 |
150.9 |
151.4 |
150.6 |
|
Tools, furniture, & fixtures, net |
465.0 |
455.4 |
435.8 |
424.5 |
393.2 |
|
Land, net |
240.4 |
234.6 |
235.0 |
230.3 |
216.7 |
|
Lease assets |
63.5 |
60.3 |
57.1 |
53.9 |
43.9 |
|
Construction-in-progress |
40.7 |
34.2 |
21.6 |
16.2 |
9.2 |
|
Goodwill |
2,083.9 |
2,117.2 |
2,224.3 |
2,261.5 |
2,194.1 |
|
Other Intangible Asset |
874.4 |
880.0 |
764.6 |
759.0 |
744.7 |
|
Investment Sec. |
708.4 |
716.0 |
1,190.9 |
1,139.8 |
1,461.4 |
|
Other Assets |
978.0 |
968.9 |
888.2 |
829.9 |
855.2 |
|
Allowance for doubtful accounts |
-8.5 |
-8.9 |
-16.0 |
-14.8 |
-14.2 |
|
Total Assets |
13,589.5 |
12,832.9 |
12,938.6 |
12,726.6 |
12,397.7 |
|
|
|
|
|
|
|
|
Note&Acct. Payable |
807.3 |
829.1 |
765.0 |
692.9 |
685.4 |
|
ST Borrowing |
1,534.0 |
773.3 |
1,700.1 |
1,343.5 |
985.9 |
|
LT borrowings (current) |
- |
762.6 |
- |
- |
- |
|
Cur.Port-Corp.Bond |
3.0 |
2.9 |
3.0 |
0.5 |
226.5 |
|
Income Tax Payable |
69.3 |
114.0 |
96.4 |
115.5 |
128.7 |
|
Prov-Product Wrrty. |
97.7 |
100.9 |
103.3 |
103.8 |
99.8 |
|
Other Reserves |
9.4 |
9.8 |
0.0 |
0.0 |
0.0 |
|
Other Curr.Liability |
1,381.9 |
1,340.2 |
1,325.4 |
1,277.4 |
1,394.8 |
|
Total Current Liabilities |
3,902.6 |
3,932.8 |
3,993.2 |
3,533.5 |
3,521.1 |
|
|
|
|
|
|
|
|
Corporate Bond |
1,363.3 |
1,328.7 |
1,357.7 |
1,320.8 |
1,246.9 |
|
LT Borrowing |
5,812.2 |
4,960.6 |
4,976.1 |
5,091.3 |
4,928.4 |
|
Total Long Term Debt |
7,175.5 |
6,289.2 |
6,333.8 |
6,412.1 |
6,175.3 |
|
|
|
|
|
|
|
|
Res-Accr.Retire Bft. |
235.8 |
226.8 |
238.8 |
236.8 |
224.1 |
|
Other reserves, LT |
1.8 |
1.9 |
1.9 |
1.8 |
1.5 |
|
Other LT Liabilities |
402.2 |
369.2 |
395.9 |
381.9 |
374.6 |
|
Minority Interest |
38.4 |
37.4 |
98.6 |
92.8 |
83.5 |
|
Total Liabilities |
11,756.4 |
10,857.4 |
11,062.2 |
10,658.9 |
10,380.1 |
|
|
|
|
|
|
|
|
Common Stock |
598.5 |
583.2 |
595.9 |
578.5 |
546.2 |
|
Paid In Capital |
678.4 |
661.1 |
680.2 |
660.4 |
623.4 |
|
Retained Earning |
2,031.2 |
2,056.5 |
2,073.6 |
2,042.1 |
1,865.2 |
|
Treasury Stock |
-138.1 |
-133.9 |
-174.3 |
-49.5 |
-46.8 |
|
Unrealized Gain-Sec |
59.2 |
78.7 |
83.0 |
59.0 |
56.0 |
|
Deferred Hedge |
-2.3 |
-9.1 |
2.3 |
-5.5 |
9.1 |
|
Pension obligation adjustments |
-44.1 |
-44.0 |
- |
- |
- |
|
Translation Adjust |
-1,349.6 |
-1,216.8 |
-1,384.3 |
-1,217.3 |
-1,035.6 |
|
Total Equity |
1,833.1 |
1,975.6 |
1,876.3 |
2,067.6 |
2,017.6 |
|
|
|
|
|
|
|
|
Total Liabilities & Shareholders' Equity |
13,589.5 |
12,832.9 |
12,938.6 |
12,726.6 |
12,397.7 |
|
|
|
|
|
|
|
|
S/O-Common Stock |
266.9 |
266.9 |
265.7 |
270.0 |
270.0 |
|
Total Common Shares Outstanding |
266.9 |
266.9 |
265.7 |
270.0 |
270.0 |
|
T/S-Common Stock |
4.4 |
4.3 |
5.5 |
1.3 |
1.3 |
|
Full-Time Employees |
- |
34,391 |
35,882 |
35,831 |
34,929 |
Annual
Cash Flows
As Reported
Financials in: USD
(mil)
Except for share
items (millions) and per share items (actual units)
|
|
31-Mar-2011 |
31-Mar-2010 |
31-Mar-2009 |
31-Mar-2008 |
31-Mar-2007 |
|
Period Length |
12 Months |
12 Months |
12 Months |
12 Months |
12 Months |
|
UpdateType/Date |
Updated Normal |
Updated Normal |
Updated Normal |
Updated Normal |
Updated Normal |
|
Filed Currency |
JPY |
JPY |
JPY |
JPY |
JPY |
|
Exchange Rate
(Period Average) |
85.691434 |
92.941082 |
100.484331 |
114.302336 |
116.944303 |
|
Auditor |
Ernst &
Young LLP |
Ernst &
Young LLP |
KPMG LLP |
KPMG LLP |
Azsa Audit Corp. |
|
Auditor Opinion |
Unqualified |
Unqualified |
Unqualified with
Explanation |
Unqualified |
Unqualified |
|
|
|
|
|
|
|
|
Income Before Tax |
265.6 |
927.5 |
-908.6 |
827.7 |
629.2 |
|
Depreciation |
401.6 |
465.6 |
445.9 |
328.3 |
260.0 |
|
Impairment Loss |
0.0 |
14.6 |
18.1 |
9.6 |
13.8 |
|
Amort-Goodwill |
167.9 |
161.4 |
1,009.7 |
70.7 |
67.3 |
|
Gain on negative goodwill |
-28.1 |
0.0 |
- |
- |
- |
|
Res-Accr.Retire Bft. |
-1.8 |
25.6 |
89.6 |
7.8 |
1.6 |
|
Prepaid Pension Cost |
-18.4 |
-8.8 |
-88.1 |
-76.6 |
5.8 |
|
Product Warranty |
-13.7 |
10.4 |
3.6 |
13.2 |
29.8 |
|
Int. and Div. Income |
-19.5 |
-20.0 |
-34.1 |
-36.4 |
-19.8 |
|
Interest Expense |
148.7 |
133.6 |
161.1 |
121.7 |
107.5 |
|
Gain/Loss-Equity Method |
-6.7 |
-3.3 |
17.0 |
24.2 |
20.5 |
|
Gains on transfer of business |
-31.5 |
-512.9 |
0.0 |
- |
- |
|
Gains on equity changes |
- |
- |
0.0 |
-16.7 |
0.0 |
|
Gain on sale of Trust |
- |
- |
- |
- |
0.0 |
|
G/L on prior period adjustments |
- |
0.0 |
154.4 |
0.0 |
- |
|
G/L Sale of Affiliates' Stock |
0.9 |
-26.1 |
0.0 |
-2.7 |
-1.4 |
|
Val.Loss-Invest.Sec |
12.3 |
65.4 |
157.2 |
13.0 |
15.0 |
|
Account Receivable |
116.3 |
-114.7 |
167.1 |
-34.6 |
-149.1 |
|
Inventories |
-40.3 |
-29.6 |
59.9 |
-125.2 |
58.3 |
|
Other Payable |
-44.6 |
-14.9 |
-56.4 |
139.4 |
0.0 |
|
Account Payable |
-66.9 |
142.0 |
-142.7 |
-80.8 |
98.6 |
|
Accrued Expense |
18.3 |
-13.5 |
-125.6 |
-0.3 |
135.7 |
|
Other Opera.Activity |
14.5 |
-47.9 |
-22.7 |
42.1 |
-17.3 |
|
Int. and Div. Rcvd. |
19.9 |
20.8 |
34.2 |
36.0 |
20.0 |
|
Interest Paid |
-152.7 |
-134.1 |
-160.6 |
-121.3 |
-106.5 |
|
Taxes Paid |
-357.8 |
-220.6 |
-364.8 |
-360.2 |
-242.0 |
|
Newly Consolid. Sub. |
- |
- |
- |
5.1 |
1.2 |
|
Excluded from Consolidation |
- |
- |
- |
-2.1 |
-0.5 |
|
Cash from Operating Activities |
384.1 |
820.4 |
414.3 |
781.7 |
927.7 |
|
|
|
|
|
|
|
|
Deposited-Time Depo |
-56.1 |
-50.9 |
-56.0 |
-340.8 |
-353.8 |
|
Withdrawn-Time Depo |
61.0 |
61.4 |
382.5 |
365.5 |
56.5 |
|
Purch-Marketable Sec |
- |
- |
- |
0.0 |
-71.5 |
|
Sale-Marketable Sec. |
- |
- |
0.0 |
20.6 |
10.8 |
|
Capital Expenditure |
-236.2 |
-425.0 |
-436.2 |
-419.5 |
-352.9 |
|
Sale of PPE |
- |
- |
0.0 |
20.2 |
5.5 |
|
Purchase of intangible assets |
-109.5 |
-58.1 |
-55.9 |
0.0 |
- |
|
Purch-Investment Sec |
-43.7 |
-53.4 |
-53.1 |
-106.1 |
-131.7 |
|
Sale/redempt.LT inv't in sec. |
826.9 |
39.9 |
403.4 |
56.8 |
37.3 |
|
Purchase of consolid. subs.' securities |
-143.9 |
-4.0 |
-1.3 |
-2,031.8 |
-20.6 |
|
Outflow due to sale subsidiaries' sec. |
0.0 |
-0.5 |
-1.2 |
0.0 |
-2.0 |
|
Sale of consol.subsidiaries' sec. |
2.3 |
189.1 |
0.0 |
5.3 |
0.0 |
|
Sale subsidiaries' securities |
- |
- |
0.0 |
1.7 |
- |
|
Purchase of subsidiaries' sec. |
-67.9 |
-644.4 |
-402.0 |
0.0 |
- |
|
Purchase of subs.' additioanl shares |
- |
- |
0.0 |
-160.6 |
0.0 |
|
Loans made |
-41.8 |
-20.5 |
-15.2 |
-86.7 |
0.0 |
|
Loans collected |
1.4 |
3.6 |
30.6 |
13.5 |
0.0 |
|
Purchase of businesses |
-76.2 |
-73.7 |
0.0 |
- |
- |
|
Disposal of businesses invested |
67.6 |
800.5 |
0.0 |
- |
- |
|
Sale of Trust |
- |
- |
- |
- |
0.0 |
|
Other Inv. Activity |
9.1 |
10.3 |
-2.0 |
-0.3 |
-2.6 |
|
Cash from Investing Activities |
193.2 |
-225.6 |
-206.3 |
-2,662.3 |
-825.0 |
|
|
|
|
|
|
|
|
ST Debt, Net |
-163.1 |
-48.8 |
-2,171.7 |
1,336.8 |
-171.2 |
|
Issued-LT Debt |
402.6 |
1,028.9 |
2,584.7 |
324.6 |
164.5 |
|
Repaid-LT Debt |
-220.7 |
-525.8 |
-334.4 |
-131.8 |
-86.7 |
|
Issue-Corporate Bond |
0.0 |
2.2 |
449.5 |
0.9 |
379.5 |
|
Stock Issued |
- |
- |
- |
- |
0.0 |
|
Redemp-Corp.Bond |
-233.9 |
-218.4 |
-350.3 |
-0.8 |
-214.6 |
|
Paid In by Minority |
- |
0.0 |
1.5 |
16.8 |
9.4 |
|
Treasury stock purchased |
-116.8 |
0.0 |
-101.9 |
0.0 |
- |
|
Dividend Paid |
-94.5 |
-43.6 |
-107.0 |
-104.0 |
-59.0 |
|
Div.Paid to Minority |
-0.5 |
-1.8 |
-1.1 |
-0.8 |
0.0 |
|
Other Finan.Activity |
-9.2 |
-5.9 |
-6.5 |
-3.2 |
-3.2 |
|
Cash from Financing Activities |
-436.0 |
186.7 |
-37.3 |
1,438.3 |
18.7 |
|
|
|
|
|
|
|
|
Foreign Exchange Effects |
-69.2 |
-31.3 |
-44.1 |
-38.5 |
11.1 |
|
Net Change in Cash |
72.1 |
750.2 |
126.5 |
-480.8 |
132.5 |
|
|
|
|
|
|
|
|
Net Cash - Beginning Balance |
2,383.0 |
1,434.1 |
1,194.3 |
1,529.3 |
1,362.2 |
|
Net Cash - Ending Balance |
2,455.1 |
2,184.3 |
1,320.8 |
1,048.5 |
1,494.7 |
|
Cash Interest Paid |
152.7 |
134.1 |
160.6 |
121.3 |
106.5 |
|
Cash Taxes Paid |
357.8 |
220.6 |
364.8 |
360.2 |
242.0 |
Interim
Cash Flows
As Reported
Financials in: USD (mil)
Except for share items (millions) and per share items (actual units)
|
|
31-Mar-2011 |
31-Dec-2010 |
30-Sep-2010 |
30-Jun-2010 |
31-Mar-2010 |
|
Period Length |
12 Months |
9 Months |
6 Months |
3 Months |
12 Months |
|
UpdateType/Date |
Updated Normal |
Updated Normal |
Updated Normal |
Updated Normal |
Updated Normal |
|
Filed Currency |
JPY |
JPY |
JPY |
JPY |
JPY |
|
Exchange Rate
(Period Average) |
85.691434 |
86.812446 |
88.962162 |
92.080323 |
92.941082 |
|
|
|
|
|
|
|
|
Income Before Tax |
265.6 |
268.2 |
178.8 |
91.9 |
927.5 |
|
Depreciation |
401.6 |
276.1 |
178.6 |
77.5 |
465.6 |
|
Impairment Loss |
0.0 |
0.0 |
0.0 |
- |
14.6 |
|
Amortization of Goodwill |
167.9 |
128.4 |
82.4 |
38.6 |
161.4 |
|
Gain on negative goodwill |
-28.1 |
- |
- |
- |
0.0 |
|
Res-Accr.Retire Bft. |
-1.8 |
8.2 |
9.7 |
5.6 |
25.6 |
|
Reserve for investment losses |
- |
0.0 |
0.0 |
- |
- |
|
Prepaid Pension Cost |
-18.4 |
- |
- |
- |
-8.8 |
|
Product Warranty |
-13.7 |
- |
- |
- |
10.4 |
|
Int. and Div. Income |
-19.5 |
-16.4 |
-10.6 |
-6.5 |
-20.0 |
|
Interest Expense |
148.7 |
107.1 |
69.5 |
33.5 |
133.6 |
|
Gain/Los-Eqty.Method |
-6.7 |
- |
- |
- |
-3.3 |
|
Gains on transfer of business |
-31.5 |
0.0 |
0.0 |
- |
-512.9 |
|
G/L on prior period adjustments |
- |
- |
- |
- |
0.0 |
|
G/L-Sale of Affiliate Stock |
0.9 |
0.1 |
- |
- |
-26.1 |
|
Sale Gain-Invest.Sec |
- |
13.6 |
-19.2 |
- |
- |
|
Val.Loss-Invest.Sec |
12.3 |
1.6 |
33.0 |
0.7 |
65.4 |
|
Account Receivable |
116.3 |
155.9 |
213.4 |
245.1 |
-114.7 |
|
Inventories |
-40.3 |
-112.0 |
-104.1 |
-86.6 |
-29.6 |
|
Account Payable |
-66.9 |
-137.7 |
-186.0 |
-142.5 |
142.0 |
|
Other Payable |
-44.6 |
4.8 |
-42.6 |
32.2 |
-14.9 |
|
Accured Expense |
18.3 |
-110.8 |
-66.1 |
-47.5 |
-13.5 |
|
Other Opera.Activity |
14.5 |
-19.0 |
5.6 |
10.8 |
-47.9 |
|
Int. and Div. Rcvd. |
19.9 |
16.9 |
11.1 |
6.7 |
20.8 |
|
Interest Paid |
-152.7 |
-88.8 |
-69.7 |
-17.5 |
-134.1 |
|
Taxes Paid |
-357.8 |
-286.7 |
-181.0 |
-104.7 |
-220.6 |
|
Cash from Operating Activities |
384.1 |
209.4 |
102.8 |
137.2 |
820.4 |
|
|
|
|
|
|
|
|
Deposited-Time Depo |
-56.1 |
-53.0 |
-45.0 |
-33.0 |
-50.9 |
|
Withdrawn-Time Depo |
61.0 |
47.8 |
33.5 |
7.2 |
61.4 |
|
Capital Expenditure |
-236.2 |
-164.1 |
-112.2 |
-55.1 |
-425.0 |
|
Purchase of intangible assets |
-109.5 |
-62.4 |
-32.5 |
-4.8 |
-58.1 |
|
Purchase of LT inv't in sec. |
-43.7 |
-37.8 |
-24.9 |
-20.0 |
-53.4 |
|
Sale/redempt.LT inv't in sec. |
826.9 |
432.6 |
368.3 |
7.2 |
39.9 |
|
Inflow due to purch. new consolid.subsid |
- |
- |
- |
4.9 |
- |
|
Purchase of consolid. subs.' securities |
-143.9 |
-143.0 |
-142.7 |
- |
-4.0 |
|
Outflow due to sale subsidiaries' sec. |
0.0 |
0.0 |
0.0 |
0.0 |
-0.5 |
|
Sale of consol.subsidiaries' sec. |
2.3 |
2.3 |
2.3 |
2.2 |
189.1 |
|
Purchase of subsidiaries' sec. |
-67.9 |
-36.8 |
-6.1 |
-5.9 |
-644.4 |
|
Purchase of businesses |
-76.2 |
0.0 |
0.0 |
0.0 |
-73.7 |
|
Disposal of businesses invested |
67.6 |
22.8 |
22.3 |
21.5 |
800.5 |
|
Loans made |
-41.8 |
- |
- |
- |
-20.5 |
|
Loans collected |
1.4 |
- |
- |
- |
3.6 |
|
Payments for acquisition in deposits |
- |
- |
- |
-80.0 |
- |
|
Other Inv. Activity |
9.1 |
-18.3 |
-3.4 |
-9.8 |
10.3 |
|
Cash from Investing Activities |
193.2 |
-9.8 |
59.5 |
-165.6 |
-225.6 |
|
|
|
|
|
|
|
|
ST Debt, Net |
-163.1 |
-134.2 |
-97.7 |
-26.5 |
-48.8 |
|
Issued-LT Debt |
402.6 |
297.0 |
281.1 |
0.1 |
1,028.9 |
|
Repaid-LT Debt |
-220.7 |
-57.2 |
-48.7 |
-20.2 |
-525.8 |
|
Issue-Corporate Bond |
0.0 |
0.0 |
- |
- |
2.2 |
|
Redemp-Corp.Bond |
-233.9 |
-230.8 |
-225.0 |
-0.2 |
-218.4 |
|
Treasury stock purchased |
-116.8 |
-115.2 |
- |
- |
0.0 |
|
Paid In by Minority |
- |
- |
- |
- |
0.0 |
|
Dividend Paid |
-94.5 |
-93.3 |
-45.5 |
-41.8 |
-43.6 |
|
Div.Paid to Minority |
-0.5 |
- |
- |
- |
-1.8 |
|
Other Finan.Activity |
-9.2 |
-6.6 |
-4.5 |
-2.1 |
-5.9 |
|
Cash from Financing Activities |
-436.0 |
-340.4 |
-140.2 |
-90.6 |
186.7 |
|
|
|
|
|
|
|
|
Foreign Exchange Effects |
-69.2 |
-87.9 |
-64.8 |
-56.9 |
-31.3 |
|
Net Change in Cash |
72.1 |
-228.7 |
-42.7 |
-175.8 |
750.2 |
|
|
|
|
|
|
|
|
Net Cash - Beginning Balance |
2,383.0 |
2,350.6 |
2,293.8 |
2,216.1 |
1,434.1 |
|
Net Cash - Ending Balance |
2,455.1 |
2,121.8 |
2,251.1 |
2,040.3 |
2,184.3 |
|
Cash Interest Paid |
152.7 |
88.8 |
69.7 |
17.5 |
134.1 |
|
Cash Taxes Paid |
357.8 |
286.7 |
181.0 |
104.7 |
220.6 |
FOREIGN EXCHANGE RATES
|
Currency |
Unit
|
Indian Rupees |
|
US Dollar |
1 |
Rs.51.05 |
|
UK Pound |
1 |
Rs.81.09 |
|
Euro |
1 |
Rs.67.39 |
RATING EXPLANATIONS
|
RATING |
STATUS |
PROPOSED CREDIT LINE |
|
|
>86 |
Aaa |
Possesses an extremely sound financial base with the strongest
capability for timely payment of interest and principal sums |
Unlimited |
|
71-85 |
Aa |
Possesses adequate working capital. No caution needed for credit
transaction. It has above average (strong) capability for payment of interest
and principal sums |
Large |
|
56-70 |
A |
Financial & operational base are regarded healthy. General
unfavourable factors will not cause fatal effect. Satisfactory capability for
payment of interest and principal sums |
Fairly Large |
|
41-55 |
Ba |
Overall operation is considered normal. Capable to meet normal
commitments. |
Satisfactory |
|
26-40 |
B |
Capability to overcome financial difficulties seems comparatively
below average. |
Small |
|
11-25 |
Ca |
Adverse factors are apparent. Repayment of interest and principal sums
in default or expected to be in default upon maturity |
Limited with
full security |
|
<10 |
C |
Absolute credit risk exists. Caution needed to be exercised |
Credit not
recommended |
|
---- |
NB |
New Business |
---- |
This score serves as a reference to assess SC’s credit risk
and to set the amount of credit to be extended. It is calculated from a
composite of weighted scores obtained from each of the major sections of this
report. The assessed factors and their relative weights (as indicated through
%) are as follows:
Financial
condition (40%) Ownership
background (20%) Payment
record (10%)
Credit history
(10%) Market trend
(10%) Operational
size (10%)
This report is issued at your request without any
risk and responsibility on the part of MIRA INFORM PRIVATE LIMITED (MIPL)
or its officials.