MIRa INFORM REPORT
|
Report Date : |
10.04.2012 |
IDENTIFICATION DETAILS
|
Name : |
DONALD WARD LTD. |
|
|
|
|
Registered Office : |
|
|
|
|
|
Country : |
|
|
|
|
|
Financials (as on) : |
31.03.2010 |
|
|
|
|
Date of Incorporation : |
24.12.1976 |
|
|
|
|
Com. Reg. No.: |
01292288 |
|
|
|
|
Legal Form : |
Private Parent Company |
|
|
|
|
Line of Business : |
Metal recycling and waste management solutions for businesses of all
sizes |
|
|
|
|
No. of Employees : |
131 |
RATING & COMMENTS
|
MIRA’s Rating : |
Ba |
|
RATING |
STATUS |
PROPOSED CREDIT LINE |
|
|
41-55 |
Ba |
Overall operation is considered normal. Capable to meet normal
commitments. |
Satisfactory |
|
Status : |
Satisfactory |
|
|
|
|
Payment
Behaviour : |
No Complaints |
|
|
|
|
Litigation : |
Clear |
NOTES :
Any query related to this report can be made
on e-mail : infodept@mirainform.com
while quoting report number, name and date.
ECGC Country Risk Classification List – September 30th, 2011
|
Country Name |
Previous Rating (30.06.2011) |
Current Rating (30.09.2011) |
|
|
a1 |
a1 |
|
Risk Category |
ECGC
Classification |
|
Insignificant |
A1 |
|
Low |
A2 |
|
Moderate |
B1 |
|
High |
B2 |
|
Very High |
C1 |
|
Restricted |
C2 |
|
Off-credit |
D |
Company name & address
Donald Ward Ltd.
Woodville
Swadlincote, DE11 8DG
Tel: 01283217192
Fax: 01283212515
Synthesis
Employees: 131
Company Type: Private Parent
Corporate Family: 1
Companies
Quoted Status: Non-quoted Company
Incorporation Date:
24-Dec-1976
Auditor: Cooper Parry LLP
Financials in: USD
(Millions)
Fiscal Year End:
31-Mar-2010
Reporting Currency: British Pound
Sterling
Annual Sales: 83.3
1
Net Income: 1.2
Total Assets: 25.9
Business Description
Metal recycling and waste management solutions for businesses of all
sizes.
Industry
Industry Waste Management Services
ANZSIC 2006: 3322 - Metal and
Mineral Wholesaling
NACE 2002: 5157 - Wholesale
of waste and scrap
NAICS 2002: 423930 -
Recyclable Material Merchant Wholesalers
UK SIC 2003: 5157 - Wholesale
of waste and scrap
US SIC 1987: 5093 - Scrap and
Waste Materials
Key Executives
|
Name |
Title |
|
Janet Ward |
Secretary |
|
James Jonathan Balfour |
Director |
|
Dennis Michael Bell |
Director |
|
Toby Potter |
Director |
|
David Ward |
Director |
News
|
Title |
Date |
|
Ken Burns
delves into Prohibition in new PBS documentary |
3-Oct-2011 |
|
FBI,
Southfield Police nab man connected to 2 bank robberies |
22-Jul-2011 |
|
Last orders
at Elaine's, where celebs did lunch ..or got punched |
3-Jun-2011 |
|
Last orders
at Elaine's, where celebs did lunch ..or got punched |
3-Jun-2011 |
|
|
|
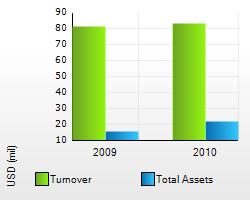
Financial Summary
FYE: 31-Mar-2010 USD (mil)
Key Figures
Current Assets 13.29
Fixed Assets 12.65
Total Liabilities 11.06
Net Worth 10.75
Key Ratios
Current Ratio 1.20
Acid Test 1.02
Debt Gearing 28.14
Registered No.(
1 - Profit & Loss Item Exchange Rate: USD 1 = GBP 0.6277937
2 - Balance Sheet Item Exchange Rate: USD 1 = GBP 0.6592392
Corporate Overview
Location
Woodville
Swadlincote, DE11 8DG
Tel: 01283217192
Fax: 01283212515
Sales GBP(mil): 52.3
Assets GBP(mil): 17.1
Employees: 131
Fiscal Year End: 31-Mar-2010
Industry: Waste
Management Services
Registered
Address:
Rawdon Works
Woodville, Nr Burton On
Incorporation Date: 24-Dec-1976
Company Type: Private
Parent
Quoted Status: Not
Quoted
Registered No.(
Director: James
Jonathan Balfour
Contents
Industry Codes
Business Description
Financial Data
Key Corporate Relationships
Industry Codes
ANZSIC 2006 Codes:
3322 - Metal and Mineral Wholesaling
NACE 2002 Codes:
5157 - Wholesale of waste and scrap
NAICS 2002 Codes:
423930 - Recyclable Material Merchant Wholesalers
US SIC 1987:
5093 - Scrap and Waste Materials
5157 - Wholesale of waste and scrap
Business
Description
Metal recycling and waste management solutions for businesses of all
sizes.
More Business
Descriptions
Skip Hire
|
||||||||||||||||||||||||||||||||||||||||||||||||||||||||||||||||||||||||||||||||||||||||||||||||
|
Corporate Family |
Corporate Structure News: |
|
|
|
|
Total Corporate Family Members: 1 |
|
|
|
|
|
|
|
|
Company Name |
Company
Type |
Location |
Country |
Industry |
Sales |
Employees |
|
|
Parent |
Swadlincote |
|
Waste Management Services |
83.3 |
131 |
|
Executive report
|
Board of Directors |
|
|
|
|
|||
|
Director |
Director/Board Member |
|
|||
|
Director |
Director/Board Member |
|
|||
|
Director |
Director/Board Member |
|
|||
|
Director |
Director/Board Member |
|
|||
|
Director |
Director/Board Member |
|
|
Executives |
|
|
|
|
||||
|
Secretary |
Company Secretary |
|
Directors and Shareholders Report
|
Main Office Address: |
Tel: 01283217192 |
Annual Return Date: 06
Jan 2011 |
|
Individual Directors |
|||||||
|
|
|||||||
|
Name |
Status |
DOB |
Filed Address |
Appointment Date |
Resignation Date |
Summary of Directorships |
|
|
Current |
27 Jun 1957 |
Heritage |
31 Dec 1990 |
NA |
Current:3 |
|
|
|
Current |
04 Apr 1975 |
|
05 Feb 2007 |
NA |
Current:1 |
|
|
|
Current |
15 Oct 1952 |
|
01 Dec 2002 |
NA |
Current:2 |
|
|
|
Current |
29 Oct 1969 |
|
01 Dec 2002 |
NA |
Current:1 |
|
|
|
Current |
12 Dec 1961 |
Spinney Manor, |
31 Dec 1990 |
NA |
Current:2 |
|
|
|
Current |
13 Apr 1937 |
Coach House, |
31 Dec 1990 |
NA |
Current:2 |
|
|
|
Previous |
28 Oct 1932 |
Caldder Barn, |
31 Dec 1990 |
14 Sep 2004 |
Current:0 |
|
|
|
|
|
||||||
|
|
|
||||||
|
|
|
|
|
|
|
|
|
|
Corporate Directors |
|
|
|
There are no corporate directors for this company. |
|
|
|
Individual Secretaries |
|||||||
|
|
|||||||
|
Name |
Status |
DOB |
Filed Address |
Appointment Date |
Resignation Date |
Summary of Directorships |
|
|
Current |
13 Apr 1937 |
Coach House, |
31 Dec 1990 |
NA |
Current:2 |
|
|
|
|
|
||||||
|
|
|
||||||
|
|
|
|
|
|
|
|
|
|
Corporate Secretaries |
|
|
|
There are no corporate secretaries for this company. |
|
|
|
Individual Shareholders |
||||||
|
|
||||||
|
Name |
Share Details |
Share Type |
# of Shares |
Share Price (GBP) |
Share Value (GBP) |
% of Total Shares |
|
David Ward |
35089 Ordinary GBP 1.00 |
Ordinary |
35,089 |
1.00 |
35,089.00 |
43.76 |
|
David Ward JNR |
2500 Ordinary GBP 1.00 |
Ordinary |
2,500 |
1.00 |
2,500.00 |
3.12 |
|
David Ward SNR |
2500 Ordinary GBP 1.00 |
Ordinary |
2,500 |
1.00 |
2,500.00 |
3.12 |
|
Donald Ward JNR |
1667 Ordinary GBP 1.00 |
Ordinary |
1,667 |
1.00 |
1,667.00 |
2.08 |
|
Janet Ward |
1 Ordinary GBP 1.00 |
Ordinary |
1 |
1.00 |
1.00 |
<0.01 |
|
Michael Ward |
35089 Ordinary GBP 1.00 |
Ordinary |
35,089 |
1.00 |
35,089.00 |
43.76 |
|
Michael Ward JNR |
1667 Ordinary GBP 1.00 |
Ordinary |
1,667 |
1.00 |
1,667.00 |
2.08 |
|
Michael Ward SNR |
1666 Ordinary GBP 1.00 |
Ordinary |
1,666 |
1.00 |
1,666.00 |
2.08 |
|
|
|
|
|
|
|
|
|
Corporate Shareholders |
|
|
|
There are no corporate shareholders for this company. |
|
|
Annual Profit & Loss
Financials in: USD
(mil)
Except for share
items (millions) and per share items (actual units)
|
|
31-Mar-2010 |
31-Mar-2009 |
31-Mar-2008 |
31-Mar-2007 |
31-Mar-2006 |
|
Period
Length |
52
Weeks |
52
Weeks |
52
Weeks |
52
Weeks |
52
Weeks |
|
Filed
Currency |
GBP |
GBP |
GBP |
GBP |
GBP |
|
Exchange
Rate (Period Average) |
0.627794 |
0.592803 |
0.498361 |
0.528925 |
0.560422 |
|
Consolidated |
No |
No |
No |
No |
No |
|
|
|
|
|
|
|
|
Turnover ( |
64.3 |
78.3 |
- |
- |
- |
|
Turnover (Exports) |
19.0 |
2.8 |
- |
- |
- |
|
Total Turnover |
83.3 |
81.1 |
- |
- |
- |
|
Cost of Sales |
66.0 |
62.9 |
- |
- |
- |
|
Gross Profit |
17.4 |
18.2 |
20.8 |
17.0 |
12.3 |
|
Depreciation |
2.6 |
2.2 |
2.4 |
2.4 |
1.7 |
|
Other Expenses |
16.0 |
17.5 |
17.3 |
15.1 |
11.8 |
|
Operating Profit |
1.3 |
0.7 |
- |
- |
0.5 |
|
Other Income |
0.4 |
0.1 |
0.2 |
0.0 |
0.1 |
|
Interest Paid |
0.1 |
0.2 |
0.1 |
0.1 |
0.1 |
|
Exceptional Income |
0.0 |
0.0 |
0.0 |
0.0 |
0.0 |
|
Discontinued Operations |
0.0 |
0.0 |
0.0 |
0.0 |
- |
|
Profit Before Taxes |
1.6 |
0.6 |
3.6 |
1.8 |
0.5 |
|
Tax Payable / Credit |
0.4 |
0.2 |
1.1 |
0.6 |
0.1 |
|
Extraordinary Items/Debits |
0.0 |
0.0 |
0.0 |
0.0 |
0.0 |
|
Dividends |
0.0 |
0.0 |
0.0 |
0.0 |
0.0 |
|
Profit After Taxes |
1.2 |
0.4 |
2.5 |
1.3 |
0.4 |
|
Minority Interests (Profit & Loss) |
0.0 |
0.0 |
0.0 |
0.0 |
0.0 |
|
Audit Fees |
0.0 |
0.0 |
0.0 |
0.0 |
0.0 |
|
Non Audit Fees |
0.0 |
0.0 |
- |
- |
- |
|
Number of Employees |
131 |
120 |
110 |
108 |
93 |
|
Wages |
6.2 |
6.8 |
7.5 |
6.6 |
6.3 |
|
Social Security Costs |
0.7 |
0.8 |
0.9 |
0.7 |
0.0 |
|
Pensions |
- |
0.8 |
0.4 |
0.6 |
0.1 |
|
Other Pension Costs |
0.0 |
1.0 |
0.6 |
0.6 |
0.1 |
|
Employees Remuneration |
7.0 |
8.6 |
9.0 |
7.9 |
6.4 |
|
Directors Emoluments |
- |
1.4 |
2.3 |
2.8 |
2.2 |
|
Other Costs |
- |
0.0 |
0.0 |
0.0 |
0.0 |
|
Directors Remuneration |
0.9 |
2.2 |
2.7 |
3.4 |
2.3 |
|
Highest Paid Director |
0.3 |
1.0 |
1.2 |
1.7 |
1.1 |
Annual Balance Sheet
Financials
in: USD (mil)
|
|
31-Mar-2010 |
31-Mar-2009 |
31-Mar-2008 |
31-Mar-2007 |
31-Mar-2006 |
|
Filed
Currency |
GBP |
GBP |
GBP |
GBP |
GBP |
|
Exchange
Rate |
0.659239 |
0.697666 |
0.503145 |
0.509853 |
0.576518 |
|
Consolidated |
No |
No |
No |
No |
No |
|
|
|
|
|
|
|
|
Land & Buildings |
1.4 |
1.6 |
6.5 |
2.6 |
2.3 |
|
Fixtures & Fittings |
0.3 |
0.4 |
0.5 |
0.3 |
0.0 |
|
Plant & Vehicles |
11.0 |
11.0 |
6.3 |
7.5 |
6.2 |
|
Total Tangible Fixed Assets |
12.6 |
13.0 |
13.3 |
10.5 |
8.5 |
|
Intangible Assets |
0.0 |
0.0 |
0.0 |
0.1 |
0.2 |
|
Investments |
0.0 |
0.0 |
0.0 |
0.0 |
0.0 |
|
Total Fixed Assets |
12.6 |
13.0 |
13.3 |
10.5 |
8.7 |
|
Stocks |
2.0 |
0.9 |
0.6 |
0.4 |
- |
|
Work in Progress |
0.0 |
0.0 |
0.0 |
0.0 |
- |
|
Total Stocks Work In Progress |
2.0 |
0.9 |
0.6 |
0.4 |
0.5 |
|
Trade Debtors |
8.5 |
6.5 |
10.9 |
10.4 |
5.7 |
|
Inter-Company Debtors |
- |
0.1 |
- |
- |
- |
|
Other Debtors |
0.7 |
0.8 |
0.3 |
0.3 |
0.2 |
|
Total Debtors |
9.3 |
7.4 |
11.2 |
10.7 |
5.9 |
|
Cash and Equivalents |
2.1 |
2.1 |
0.4 |
0.5 |
0.7 |
|
Other Current Assets |
0.0 |
0.0 |
0.0 |
0.0 |
0.0 |
|
Total Current Assets |
13.3 |
10.4 |
12.2 |
11.5 |
7.1 |
|
Total Assets |
25.9 |
23.4 |
25.5 |
22.1 |
15.8 |
|
Trade Creditors |
9.0 |
7.9 |
7.4 |
6.1 |
3.9 |
|
Bank Overdraft |
0.4 |
0.4 |
0.1 |
- |
0.0 |
|
Inter-Company Creditors |
- |
- |
- |
- |
0.0 |
|
Director Loans (Current Liability) |
- |
- |
- |
- |
0.0 |
|
Hire Purchase (Current Liability) |
- |
- |
- |
- |
0.0 |
|
Finance Lease (Current Liability) |
- |
- |
- |
- |
0.0 |
|
Total Finance Lease/Hire Purchase (Current Liability) |
0.2 |
0.1 |
0.3 |
0.6 |
0.0 |
|
Total Short Term Loans |
0.0 |
0.1 |
0.1 |
0.4 |
0.4 |
|
Accruals/Deferred Income (Current Liability) |
0.5 |
1.1 |
1.3 |
1.6 |
1.0 |
|
Social Security/VAT |
0.3 |
0.4 |
1.5 |
1.4 |
1.3 |
|
Corporation Tax |
0.4 |
0.0 |
0.7 |
0.5 |
0.1 |
|
Dividends (Current Liability) |
- |
- |
- |
- |
0.0 |
|
Other Current Liabilities |
0.2 |
0.1 |
0.1 |
0.2 |
0.0 |
|
Total Current Liabilities |
11.1 |
10.1 |
11.5 |
10.9 |
6.7 |
|
Group Loans (Long Term Liability) |
0.0 |
- |
0.0 |
0.0 |
0.0 |
|
Director Loans (Long Term Liability) |
0.0 |
- |
0.0 |
0.0 |
0.0 |
|
Hire Purchase (Long Term Liability) |
- |
- |
- |
- |
0.0 |
|
Leasing (Long Term Liability) |
- |
- |
- |
- |
0.0 |
|
Total Hire Purchase Loans (Long Term Liability) |
0.3 |
0.2 |
0.5 |
0.8 |
0.0 |
|
Other Long Term Loans |
2.7 |
3.1 |
0.2 |
0.0 |
1.2 |
|
Accruals/Deferred Income (Long Term Liability) |
0.0 |
0.0 |
0.0 |
0.0 |
0.0 |
|
Other Long Term Liabilities |
0.0 |
0.0 |
0.0 |
0.0 |
0.0 |
|
Total Long Term Liabilities |
3.0 |
3.3 |
0.6 |
0.8 |
1.2 |
|
Deferred Taxation |
1.1 |
1.0 |
1.2 |
0.9 |
0.7 |
|
Other Provisions |
0.0 |
0.0 |
0.0 |
0.0 |
0.0 |
|
Total Provisions |
1.1 |
1.0 |
1.2 |
0.9 |
0.7 |
|
Issued Capital |
0.1 |
0.1 |
0.2 |
0.2 |
0.1 |
|
Share Premium Accounts |
0.0 |
0.0 |
0.0 |
0.0 |
0.0 |
|
Revaluation Reserve |
0.0 |
0.0 |
0.0 |
0.0 |
0.0 |
|
Retained Earnings |
10.6 |
9.0 |
12.0 |
9.4 |
7.1 |
|
Other Reserves |
0.0 |
0.0 |
0.0 |
0.0 |
0.0 |
|
Minority Interests (Balance Sheet) |
0.0 |
0.0 |
0.0 |
0.0 |
0.0 |
|
Total Shareholders Funds |
10.8 |
9.1 |
12.1 |
9.5 |
7.3 |
|
Net Worth |
10.8 |
9.1 |
12.1 |
9.5 |
7.1 |
Annual Cash Flows
Financials
in: USD (mil)
|
|
31-Mar-2010 |
31-Mar-2009 |
31-Mar-2008 |
31-Mar-2007 |
31-Mar-2006 |
|
Period
Length |
52
Weeks |
52
Weeks |
52
Weeks |
52
Weeks |
52
Weeks |
|
Filed
Currency |
GBP |
GBP |
GBP |
GBP |
GBP |
|
Exchange
Rate (Period Average) |
0.627794 |
0.592803 |
0.498361 |
0.528925 |
0.560422 |
|
Consolidated |
No |
No |
No |
No |
No |
|
|
|
|
|
|
|
|
Net Cash Flow From Operating Activities |
1.5 |
5.4 |
6.1 |
3.2 |
-0.2 |
|
Net Cash Flow from ROI and Servicing of Finance |
-0.1 |
-0.1 |
0.1 |
-0.1 |
0.0 |
|
Taxation |
-0.2 |
-0.7 |
-0.5 |
-0.1 |
-0.1 |
|
Capital Expenditures |
-0.2 |
-6.0 |
-5.1 |
-2.3 |
-2.8 |
|
Acquisitions and Disposals |
0.0 |
0.0 |
0.0 |
0.0 |
0.0 |
|
Paid Up Equity |
0.0 |
0.0 |
0.0 |
0.0 |
0.0 |
|
Management of Liquid Resources |
0.0 |
0.0 |
0.0 |
0.0 |
0.0 |
|
Net Cash Flow From Financing |
-1.0 |
3.6 |
-0.7 |
-1.0 |
0.4 |
|
Increase in Cash |
-0.1 |
2.2 |
-0.2 |
-0.3 |
-2.6 |
Annual Ratios
Financials
in: USD (mil)
|
|
31-Mar-2010 |
31-Mar-2009 |
31-Mar-2008 |
31-Mar-2007 |
31-Mar-2006 |
|
Period
Length |
52
Weeks |
52
Weeks |
52
Weeks |
52
Weeks |
52
Weeks |
|
Filed
Currency |
GBP |
GBP |
GBP |
GBP |
GBP |
|
Exchange
Rate |
0.659239 |
0.697666 |
0.503145 |
0.509853 |
0.576518 |
|
Consolidated |
No |
No |
No |
No |
No |
|
|
|
|
|
|
|
|
Current Ratio |
1.20 |
1.04 |
1.06 |
1.06 |
1.07 |
|
Liquidity Ratio |
1.02 |
0.94 |
1.01 |
1.02 |
0.99 |
|
Stock Turnover |
40.46 |
73.41 |
- |
- |
- |
|
Credit Period (Days) |
39.30 |
34.66 |
- |
- |
- |
|
Working Capital by Sales |
2.80% |
0.51% |
- |
- |
- |
|
Trade Credit by Debtors |
1.05 |
1.20 |
0.68 |
0.59 |
0.68 |
|
Return on Capital |
10.44% |
3.93% |
25.56% |
17.01% |
5.20% |
|
Return on Assets |
5.99% |
2.24% |
14.00% |
8.62% |
3.01% |
|
Profit Margin |
1.96% |
0.76% |
- |
- |
- |
|
Return on Shareholders Funds |
14.44% |
5.78% |
29.47% |
19.92% |
6.54% |
|
Borrowing Ratio |
34.11% |
41.96% |
9.92% |
18.03% |
22.62% |
|
Equity Gearing |
41.45% |
38.79% |
47.52% |
43.26% |
46.02% |
|
Debt Gearing |
28.14% |
35.79% |
5.36% |
8.23% |
16.60% |
|
Interest Coverage |
14.29 |
3.40 |
34.31 |
18.10 |
8.71 |
|
Sales by Tangible Assets |
6.28 |
5.29 |
- |
- |
- |
|
Average Remuneration per Employee |
0.1 |
0.1 |
0.1 |
0.1 |
0.1 |
|
Profit per Employee |
0.0 |
0.0 |
0.0 |
0.0 |
0.0 |
|
Sales per Employee |
0.6 |
0.6 |
- |
- |
- |
|
Capital Employed per Employee |
0.1 |
0.1 |
0.1 |
0.1 |
0.1 |
|
Tangible Assets per Employee |
0.1 |
0.1 |
0.1 |
0.1 |
0.1 |
|
Total Assets per Employee |
0.2 |
0.2 |
0.2 |
0.2 |
0.2 |
|
Employee Remuneration by Sales |
8.40% |
10.55% |
- |
- |
- |
|
Creditor Days (Cost of Sales Based) |
52.15 |
53.80 |
- |
- |
- |
|
Creditor Days (Sales Based) |
41.28 |
41.75 |
- |
- |
- |
FOREIGN EXCHANGE RATES
|
Currency |
Unit
|
Indian Rupees |
|
US Dollar |
1 |
Rs.51.28 |
|
|
1 |
Rs.81.38 |
|
Euro |
1 |
Rs.67.01 |
RATING EXPLANATIONS
|
RATING |
STATUS |
PROPOSED CREDIT LINE |
|
|
>86 |
Aaa |
Possesses an extremely sound financial base with the strongest
capability for timely payment of interest and principal sums |
Unlimited |
|
71-85 |
Aa |
Possesses adequate working capital. No caution needed for credit
transaction. It has above average (strong) capability for payment of interest
and principal sums |
Large |
|
56-70 |
A |
Financial & operational base are regarded healthy. General unfavourable
factors will not cause fatal effect. Satisfactory capability for payment of
interest and principal sums |
Fairly Large |
|
41-55 |
Ba |
Overall operation is considered normal. Capable to meet normal
commitments. |
Satisfactory |
|
26-40 |
B |
Capability to overcome financial difficulties seems comparatively
below average. |
Small |
|
11-25 |
Ca |
Adverse factors are apparent. Repayment of interest and principal sums
in default or expected to be in default upon maturity |
Limited with full
security |
|
<10 |
C |
Absolute credit risk exists. Caution needed to be exercised |
Credit not
recommended |
|
---- |
NB |
New Business |
---- |
This score serves as a reference to assess SC’s credit risk and
to set the amount of credit to be extended. It is calculated from a composite
of weighted scores obtained from each of the major sections of this report. The
assessed factors and their relative weights (as indicated through %) are as
follows:
Financial
condition (40%) Ownership
background (20%) Payment
record (10%)
Credit history
(10%) Market trend
(10%) Operational
size (10%)
This report is issued at your request without any
risk and responsibility on the part of MIRA INFORM PRIVATE LIMITED (MIPL)
or its officials.