MIRA INFORM REPORT
|
Report Date : |
10.04.2012 |
IDENTIFICATION DETAILS
|
Name : |
VANDAPAC
CO., LTD. |
|
|
|
|
Registered Office : |
700/135 Moo
5, Klongtumru, Muang,
Chonburi 20000 |
|
|
|
|
Country : |
|
|
|
|
|
Financials (as on) : |
31.12.2010 |
|
|
|
|
Date of Incorporation : |
14.11.1988 |
|
|
|
|
Com. Reg. No.: |
0105531089545 |
|
|
|
|
Legal Form : |
Private Limited
Company |
|
|
|
|
Line of Business : |
Manufacturer,
Distributor and Exporter
of Plastic and Synthetic
Rubber Products |
|
|
|
|
No. of Employees
: |
1,500 |
RATING & COMMENTS
|
MIRA’s Rating : |
Ba |
|
RATING |
STATUS |
PROPOSED CREDIT LINE |
|
|
41-55 |
Ba |
Overall operation is considered normal. Capable to meet normal
commitments. |
Satisfactory |
|
Status : |
Good |
|
Payment
Behaviour : |
No Complaints |
|
Litigation : |
Clear |
NOTES:
Any query related to this report can be made
on e-mail : infodept@mirainform.com
while quoting report number, name and date.
ECGC Country Risk Classification List – March 31st, 2012
|
Country Name |
Previous Rating (31.12.2011) |
Current Rating (31.03.2012) |
|
Thailand |
b1 |
b1 |
|
Risk Category |
ECGC
Classification |
|
Insignificant |
A1 |
|
Low |
A2 |
|
Moderate |
B1 |
|
High |
B2 |
|
Very High |
C1 |
|
Restricted |
C2 |
|
Off-credit |
D |
Company name
VANDAPAC CO., LTD.
SUMMARY
BUSINESS
ADDRESS : 700/135 MOO
5, KLONGTUMRU, MUANG,
CHONBURI 20000,
THAILAND
TELEPHONE : [66] 38
743-582-3
FAX :
[66] 38
743-730
E-MAIL
ADDRESS : mail@vandapac.com
REGISTRATION
ADDRESS : SAME
AS BUSINESS ADDRESS
ESTABLISHED
: 1988
REGISTRATION
NO. : 0105531089545 [Former : 8956/2531]
CAPITAL REGISTERED : BHT. 200,000,000
CAPITAL PAID-UP : BHT.
200,000,000
SHAREHOLDER’S PROPORTION : THAI : 100%
FISCAL YEAR CLOSING DATE : DECEMBER 31
LEGAL
STATUS : PRIVATE LIMITED
COMPANY
EXECUTIVE : MR.
WATANA TANGKIJWATE, THAI
MANAGING DIRECTOR
NO.
OF STAFF : 1,500
LINES
OF BUSINESS : PLASTIC AND
SYNTHETIC RUBBER PRODUCTS
MANUFACTURER, DISTRIBUTOR
AND EXPORTER
CORPORATE PROFILE
OPERATING
TREND : STABLE
PRESENT
SITUATION : OPERATING NORMALLY
REPUTATION : GOOD
WITH NORMAL BUSINESS
ENGAGEMENT
MANAGEMENT
STANDARD : MANAGEMENT WITH
GOOD PERFORMANCE
HISTORY
The
subject was established
on November 14,
1988 as a
private limited company
under the name
style VANDAPAC CO.,
LTD., by Thai
groups, to manufacture
wide range of
plastic and synthetic
rubber products for
both domestic and
international markets. It
currently employs approximately
1,500 staff.
The
subject also achieved
the quality system
ISO : 9002 certificate for
vehicle lines production.
The
subject’s registered address is
700/135 Moo 5, Klongtumru, Muang,
Chonburi 20000, and
this is the
company’s current operation
address.
THE BOARD OF DIRECTORS
|
Name |
|
Nationality |
Age |
|
|
|
|
|
|
Mr. Sanan Ang-ubonkul |
|
Thai |
66 |
|
Mr. Sombat Lertsamitrakul |
[x] |
Thai |
- |
|
Mr. Watana Tangkijwate |
[x] |
Thai |
66 |
|
Mr. Amorn Tangkijwate |
|
Thai |
58 |
|
Mr. Pipat Kongsaksirikul |
[x] |
Thai |
67 |
|
Ms. Kanokrat Piyanaetitham |
|
Thai |
65 |
AUTHORIZED PERSON
Two of the
mentioned directors [x]
can jointly sign
on behalf of
the subject with
company’s affixed.
MANAGEMENT
Mr. Watana Tangkijwate is
the Managing Director.
He is Thai nationality with
the age of 66 years
old.
Mrs. Areerat Eksomtaramek is
the Accounting &
Financial Manager.
She is Thai
nationality.
Mr. Lertrith Karnchanuprakrit is
the Personnel Manager.
He is Thai
nationality.
Mr. Montri Osothsilp is
the Sales Manager.
He is Thai
nationality.
Mr. Sommitr Kotarawiboon is
the Purchasing Manager.
He is Thai
nationality.
Mr. Varawong Tangkijwate is
the Marketing Manager.
He is Thai
nationality.
Mr. Somchai Rakangthong is
the Production Manager 1.
He is Thai
nationality.
Mr. Pasatorn Varawieng is
the Production Manager
2.
He is Thai
nationality.
Mr. Ananchai Angsunark is
the Factory Manager.
He is Thai
nationality.
Mr. Surapun Thintermsap is the Production
Manager 3.
He is Thai
nationality.
BUSINESS OPERATIONS
The subject is engaged in
manufacturing of three-fold and includes the manufacturing of sheet plastic
from various raw materials such as PS, PE, PP, ABS, PET, production of thermoform
products, and die making and design, which
are divided into 4 main
divisions as the
followings:
·
Insulation
Division; specializes in
closed cell elastomeric
thermal insulation, such
as insulation tubes,
standard flat insulation
sheets, continuous sheet
rolls, pre-cut sheet
insulation, with aluminum
foil insulation
·
Automotive
Division, specializes in vehicle
liners
·
Packaging
Division, specializes in thermoformed plastic packaging products, such
as plastic cups
and containers.
·
Industrial
Plastic Division, specializes
in plastic pallets,
uses for plastic
solution and material
handling industry.
MAJOR BRANDS
“MAX FLEX”, “MAXLINER”,
“MAX TAPE”, “MAX-D-GASKET” and
etc.
PURCHASE
Raw materials and machinery are purchased
from both local and overseas suppliers
mainly in Germany,
Taiwan, Republic of
China, Singapore and
United States of
America.
SALES
The products are sold to both
domestic and overseas customers in United States of America,
Europe, Singapore, Taiwan, Japan, Republic of China, Australia,
Malaysia, Indonesia, Vietnam and Hong
Kong.
SUBSIDIARY AND AFFILIATED
COMPANY
The subject is
not found to have any
subsidiary nor affiliated
company here in
Thailand.
LITIGATION
Bankruptcy and
Receivership
There are no
litigation on bankruptcy
and receivership cases
filed against the
subject found at
Legal Execution Department
for the past
five years.
Others
There are no
legal suits filed
against the subject
for the past
two years.
CREDIT
Sales are by
cash or on
the credits term
of 30-60 days.
Local bills are
paid by cash
or on the
credits term of
30-60 days.
Imports are by
L/C at sight
or T/T.
Exports are against
L/C at sight
or T/T.
BANKING
Bangkok
Bank Public Co.,
Ltd.
Kasikornbank
Public Co., Ltd.
EMPLOYMENT
The
subject employs approximately
1,500 staff. [office,
sales staff and
factory workers]
LOCATION
DETAILS
The
premise is owned
for operating head
office, factory I
and warehouse at
the heading address.
Premise is located
in provincial.
Factory
II is located
at 93 Moo
15, Kingkaew Rd.,
Bangpleeyai, Bangplee, Samutprakarn
10540.
Tel.:
[66] 2312-4147-50, 2750-1560
Fax : [66] 2312-4151, 2750-4141
REMARK
MAXIMUM
CREDIT SHOULD BE
GRANTED AT EUR
10,000,000.
COMMENT
The subject has
become one of the region’s
largest plastic manufacturers. It
has continually expanded
to keep pace with
recent market trends
including production of
thermoform products and die
making and design. The products have measured up to the highest international
standards of quality.
The
subject has a
solid business and products
strengthen serving various industries
worldwide.
FINANCIAL INFORMATION
The
capital was registered
at Bht. 30,000,000
divided into 300,000
shares of Bht.
100 each.
The
capital was increased
later as follows:
Bht. 40,000,000
on July 1,
1991
Bht. 50,000,000
on December 18,
1992
Bht. 70,000,000
on February 5,
1993
Bht. 100,000,000
on November 29,
1996
Bht. 200,000,000
on December 21,
2001
The
latest registered capital
was increased to
Bht. 200,000,000 divided
into 2,000,000 shares
of Bht. 100
each with fully
paid.
MAIN
SHAREHOLDERS : [as
at April 29,
2011]
|
NAME |
HOLDING
|
% |
|
|
|
|
|
Mr. Watana Tangkijwate Nationality: Thai Address : 3800
Rama 4 Rd.,
Klongton, Klongtoey,
Bangkok |
200,000 |
10.00 |
|
Mr. Amorn Tangkijwate Nationality: Thai Address : 3800
Rama 4 Rd.,
Klongton, Klongtoey, Bangkok |
200,000 |
10.00 |
|
Mr. Varawong Tangkijwate Nationality: Thai Address : 3800
Rama 4 Rd.,
Klongton,
Klongtoey, Bangkok |
200,000 |
10.00 |
|
Mr. Veerawong Tangkijwate Nationality: Thai Address : 3800
Rama 4 Rd.,
Klongton,
Klongtoey, Bangkok |
200,000 |
10.00 |
|
Mr. Yuthasith Kongsaksirikul Nationality: Thai Address : 31
Phaholyothin Rd., Samsennai,
Phyathai,
Bangkok |
150,000 |
7.50 |
|
Mr. Yuwapol Kongsaksirikul Nationality: Thai Address : 31
Phaholyothin Rd., Samsennai,
Phyathai, Bangkok |
150,000 |
7.50 |
|
Ms. Yupaporn Kongsaksirikul Nationality: Thai Address : 31
Phaholyothin Rd., Samsennai,
Phyathai, Bangkok |
150,000 |
7.50 |
|
Others |
750,000 |
37.50 |
Total Shareholders : 15
Share Structure [as
at April 29, 20111]
|
Nationality |
Shareholders |
No. of Share |
% Shares |
|
|
|
|
|
|
Thai |
15 |
2,000,000 |
100.00 |
|
Foreign |
- |
- |
- |
|
Total |
15 |
2,000,000 |
100.00 |
NAME OF AUDITOR
& CERTIFIED PUBLIC
ACCOUNTANT NO. :
Mrs. Kesaree Narongdej No.
0076
Note.
The 2011 financial
statement has yet
been submitted to
the Commercial Registration
Department during investigation.
BALANCE SHEET [BAHT]
The latest financial figures published
as at December
31, 2010 &
2009 were:
ASSETS
|
Current Assets |
2010 |
2009 |
|
|
|
|
|
Cash in hand
& at Bank
|
24,701,273.04 |
61,679,958.59 |
|
Trade Accounts Receivable |
377,423,171.64 |
267,340,240.26 |
|
Inventories |
613,197,420.90 |
430,519,619.04 |
|
Other Current Assets |
|
|
|
Custom Tax
Compensation |
18,610,090.95 |
6,117,581.73 |
|
Others |
13,156,371.78 |
12,288,759.47 |
|
|
|
|
|
Total Current Assets
|
1,047,088,328.31 |
777,946,159.09 |
|
Fixed Assets |
1,351,319,943.88 |
1,319,421,425.21 |
|
Intangible Assets |
3,888,654.26 |
1,013,031.26 |
|
Other Assets |
2,075,471.98 |
3,560,471.98 |
|
Total Assets |
2,404,372,398.43 |
2,101,941,087.54 |
LIABILITIES &
SHAREHOLDERS' EQUITY [BAHT]
|
Current
Liabilities |
2010 |
2009 |
|
|
|
|
|
Bank Overdraft &
Short-term Loan from Financial Institution |
275,080,824.75 |
102,798,416.27 |
|
Trade Accounts Payable |
178,377,049.34 |
113,927,195.85 |
|
Current Portion of
Financial Lease Contract Liabilities |
340,268.70 |
- |
|
Current Portion of
Long-term Loan |
74,456,000.00 |
143,251,250.00 |
|
Other Current Liabilities Accrued Expenses |
45,434,610.21 |
38,842,797.63 |
|
Accrued Income Tax |
1,188,833.06 |
- |
|
Accrued Dividend |
30,000,000.00 |
- |
|
Advance from
Goods |
14,537,866.00 |
10,082,080.40 |
|
Assets Purchased
Payable |
7,716,018.10 |
5,716,977.44 |
|
Others |
9,800,263.70 |
9,057,890.67 |
|
|
|
|
|
Total Current Liabilities |
636,931,733.86 |
423,676,608.26 |
|
Financial Lease Contract
Payable, net |
1,041,588.02 |
- |
|
Long-term Loan, net |
82,482,534.24 |
156,938,534.24 |
|
Total Liabilities |
720,455,856.12 |
580,615,142.50 |
|
|
|
|
|
Shareholders' Equity |
|
|
|
|
|
|
|
Share capital : Baht 100
par value Authorized, issued
and fully paid share
capital 2,000,000 shares |
200,000,000.00 |
200,000,000.00 |
|
|
|
|
|
Capital Paid |
200,000,000.00 |
200,000,000.00 |
|
Retained Earning Appropriated for
Statutory Reserve |
20,000,000.00 |
20,000,000.00 |
|
Unappropriated |
1,463,916,542.31 |
1,301,325,945.04 |
|
Total Shareholders' Equity |
1,683,916,542.31 |
1,521,325,945.04 |
|
Total Liabilities &
Shareholders' Equity |
2,404,372,398.43 |
2,101,941,087.54 |
PROFIT & LOSS ACCOUNT
|
Revenue |
2010 |
2009 |
|
|
|
|
|
Sales Income |
2,254,228,371.28 |
1,629,747,167.40 |
|
Other Income |
|
|
|
- Export Compensation |
37,027,577.74 |
15,794,515.70 |
|
- Devalue Inventories |
- |
1,987,601.87 |
|
- Others |
3,789,799.42 |
6,072,452.92 |
|
Total Revenues |
2,295,045,748.44 |
1,653,601,737.89 |
|
Expenses |
|
|
|
|
|
|
|
Cost of Goods
Sold |
1,761,231,753.12 |
1,288,729,252.79 |
|
Selling Expenses |
204,097,605.17 |
172,941,006.58 |
|
Administrative Expenses |
93,555,222.53 |
82,777,147.45 |
|
Other Expenses - Loss on
Exchange Rate |
5,876,559.40 |
10,278,914.31 |
|
Total Expenses |
2,064,761,140.22 |
1,554,726,321.13 |
|
|
|
|
|
Profit before Financial Cost &
Income Tax |
230,284,608.22 |
98,875,416.76 |
|
Financial Cost |
[16,330,940.32] |
[27,368,972.82] |
|
Profit before Income Tax |
213,953,668.10 |
71,506,443.94 |
|
Income Tax |
[1,363,070.83] |
- |
|
|
|
|
|
Net Profit / [Loss] |
212,590,597.27 |
71,506,443.94 |
FINANCIAL ANALYSIS
|
ITEM |
UNIT |
2010 |
2009 |
|
|
|
|
|
|
LIQUIDITY RATIO |
|
|
|
|
CURRENT RATIO |
TIMES |
1.64 |
1.84 |
|
QUICK RATIO |
TIMES |
0.63 |
0.78 |
|
|
|
|
|
|
ACTIVITY RATIO |
|
|
|
|
FIXED ASSETS TURNOVER |
TIMES |
1.67 |
1.24 |
|
TOTAL ASSETS TURNOVER |
TIMES |
0.94 |
0.78 |
|
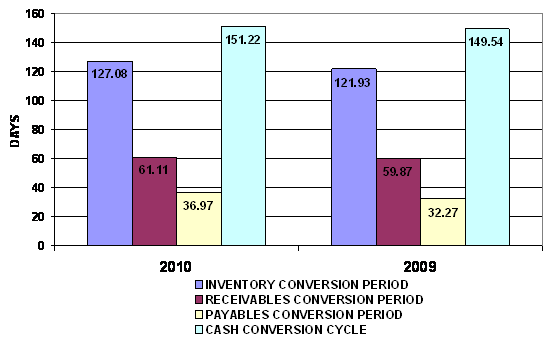
INVENTORY CONVERSION PERIOD |
DAYS |
127.08 |
121.93 |
|
INVENTORY TURNOVER |
TIMES |
2.87 |
2.99 |
|
RECEIVABLES CONVERSION PERIOD |
DAYS |
61.11 |
59.87 |
|
RECEIVABLES TURNOVER |
TIMES |
5.97 |
6.10 |
|
PAYABLES CONVERSION PERIOD |
DAYS |
36.97 |
32.27 |
|
CASH CONVERSION CYCLE |
DAYS |
151.22 |
149.54 |
|
|
|
|
|
|
PROFITABILITY
RATIO |
|
|
|
|
COST OF GOODS SOLD |
% |
78.13 |
79.08 |
|
SELLING & ADMINISTRATION |
% |
13.20 |
15.69 |
|
INTEREST |
% |
0.72 |
1.68 |
|
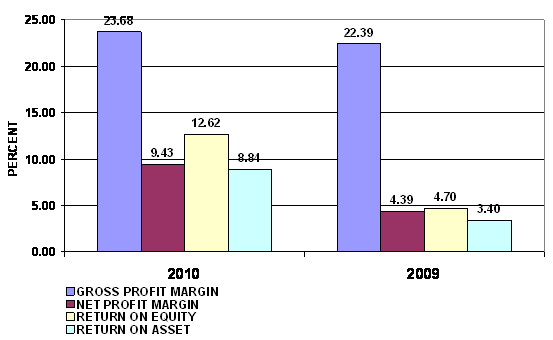
GROSS PROFIT MARGIN |
% |
23.68 |
22.39 |
|
NET PROFIT MARGIN BEFORE EX. ITEM |
% |
10.22 |
6.07 |
|
NET PROFIT MARGIN |
% |
9.43 |
4.39 |
|
RETURN ON EQUITY |
% |
12.62 |
4.70 |
|
RETURN ON ASSET |
% |
8.84 |
3.40 |
|
EARNING PER SHARE |
BAHT |
106.30 |
35.75 |
|
|
|
|
|
|
LEVERAGE RATIO |
|
|
|
|
DEBT RATIO |
TIMES |
0.30 |
0.28 |
|
DEBT TO EQUITY RATIO |
TIMES |
0.43 |
0.38 |
|
TIME INTEREST EARNED |
TIMES |
14.10 |
3.61 |
|
|
|
|
|
|
ANNUAL GROWTH |
|
|
|
|
SALES GROWTH |
% |
38.32 |
|
|
OPERATING PROFIT |
% |
132.90 |
|
|
NET PROFIT |
% |
197.30 |
|
|
FIXED ASSETS |
% |
2.42 |
|
|
TOTAL ASSETS |
% |
14.39 |
|
PROFITABILITY
RATIO
|
Gross Profit Margin |
23.68 |
Impressive |
Industrial
Average |
14.60 |
|
Net Profit Margin |
9.43 |
Impressive |
Industrial
Average |
2.88 |
|
Return on Assets |
8.84 |
Impressive |
Industrial
Average |
4.00 |
|
Return on Equity |
12.62 |
Impressive |
Industrial
Average |
9.62 |
Gross Profit Margin used to assess a firm's financial health by revealing
the proportion of money left over from revenues after accounting for the cost
of goods sold. Gross profit margin serves as the source for paying additional
expenses and future savings. The company’s figure is 23.68%. When compared with the industry
average, the ratio of the company was higher, this indicated that company was
more profitable than the same industry.
Net Profit Margin is the indicator of the company's efficiency in that
net profit takes into consideration all expenses of the company. A low profit
margin indicates a low margin of safety, higher risk that a decline in sales
will erase profits and result in a net loss. The company’s figure is 9.43% compared with those of its average
competitors in the same industry, indicated that business was an efficient
operator in a dominant position within
its industry.
Return on Assets measures how efficiently profits are being generated
from the assets employed in the business when compared with the ratios of firms
in a similar business. A low ratio in comparison with industry averages
indicates an inefficient use of business assets. Return on Assets ratio is
8.84%, higher figure when compared with those of its average competitors
in the same industry, indicated that
business was an efficient profit in a
dominant position within its industry.
eturn on Equity indicates how profitable a company is by comparing its
net income to its average shareholders' equity, ROE measures how much the
shareholders earned for their investment in the company. Return on Equity ratio is 12.62%, higher
figure when compared with those of its average competitors in the same
industry, indicated that business was an efficient profit in a dominant position within its industry.
Trend of the
average competitors in the same industry for last 5 years
Return on Assets Uptrend
Return on Equity Uptrend
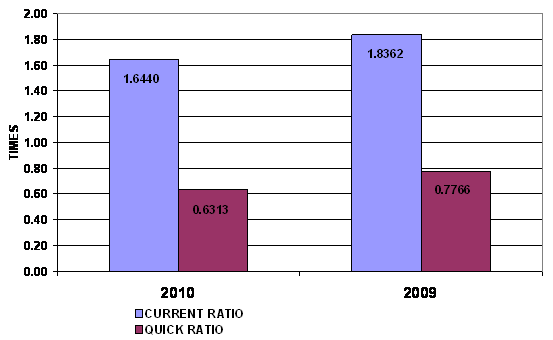
LIQUIDITY RATIO
|
Current Ratio |
1.64 |
Impressive |
Industrial
Average |
1.26 |
|
Quick Ratio |
0.63 |
|
|
|
|
Cash Conversion Cycle |
151.22 |
|
|
|
The Current Ratio is to ascertain whether a company's short-term assets
are readily available to pay off its short-term liabilities. The company's
figure is 1.64 times in 2010, decreased from 1.84 times, then it is generally
considered to have good short-term financial strength. When compared with the
industry average, the ratio of the company was higher, indicated that company
was an efficient operator in a dominant position within its industry.
The Quick Ratio is a liquidity indicator that further refines the
current ratio by measuring the amount of the most liquid current assets there
are to cover current liabilities. The company's figure is 0.63 times in 2010,
decreased from 0.78 times, then the company has not enough current assets that
presumably can be quickly converted to cash for pay financial obligations.
The Cash Conversion Cycle measures the number of days a company's cash
is tied up in the production and sales process of its operations and the benefit
from payment terms from its creditors. It meant the company could survive when
no cash inflow was received from sale for 152 days.
Trend of the
average competitors in the same industry for last 5 years
Current Ratio Uptrend
LEVERAGE RATIO
|
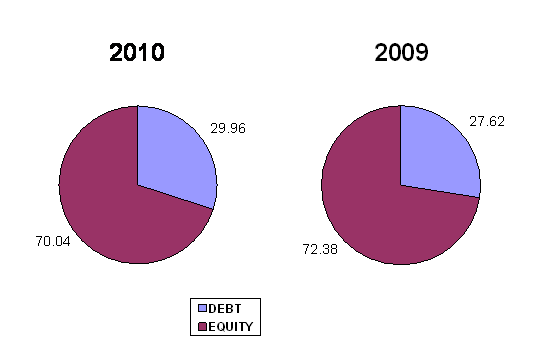
Debt Ratio |
0.30 |
Impressive |
Industrial
Average |
0.57 |
|
Debt to Equity Ratio |
0.43 |
Impressive |
Industrial
Average |
1.33 |
|
Times Interest Earned |
14.10 |
Impressive |
Industrial
Average |
3.41 |
Debt to Equity Ratio a measurement of how much suppliers, lenders,
creditors and obligors have committed to the company versus what the
shareholders have committed. A lower the percentage means that the company is
using less leverage and has a stronger equity position.
Times Interest Earned measuring a company's ability to meet its debt
obligations. Ratio is 14.11 higher than 1, so the company can pay interest
expenses on outstanding debt.
Debt Ratio shows the proportion of a company's assets which are financed
through debt. The company's figure is 0.3 less than 0.5, most of the company's
assets are financed through equity.
Trend of the
average competitors in the same industry for last 5 years
Debt Ratio Downtrend
Times Interest Earned Uptrend
ACTIVITY RATIO
|
Fixed Assets Turnover |
1.67 |
Acceptable |
Industrial
Average |
2.83 |
|
Total Assets Turnover |
0.94 |
Acceptable |
Industrial
Average |
1.39 |
|
Inventory Conversion Period |
127.08 |
|
|
|
|
Inventory Turnover |
2.87 |
Deteriorated |
Industrial
Average |
6.64 |
|
Receivables Conversion Period |
61.11 |
|
|
|
|
Receivables Turnover |
5.97 |
Impressive |
Industrial
Average |
4.95 |
|
Payables Conversion Period |
36.97 |
|
|
|
Trend of the average
competitors in the same industry for last 5 years
Fixed Assets Turnover Uptrend
Total Assets Turnover Uptrend
Inventory Turnover Uptrend
Receivables Turnover Uptrend
FOREIGN EXCHANGE RATES
|
Currency |
Unit
|
Indian Rupees |
|
US Dollar |
1 |
Rs.51.28 |
|
UK Pound |
1 |
Rs.81.38 |
|
Euro |
1 |
Rs.67.01 |
RATING EXPLANATIONS
|
RATING |
STATUS |
PROPOSED CREDIT LINE |
|
|
>86 |
Aaa |
Possesses an extremely sound financial base with the strongest capability
for timely payment of interest and principal sums |
Unlimited |
|
71-85 |
Aa |
Possesses adequate working capital. No caution needed for credit
transaction. It has above average (strong) capability for payment of interest
and principal sums |
Large |
|
56-70 |
A |
Financial & operational base are regarded healthy. General
unfavourable factors will not cause fatal effect. Satisfactory capability for
payment of interest and principal sums |
Fairly Large |
|
41-55 |
Ba |
Overall operation is considered normal. Capable to meet normal
commitments. |
Satisfactory |
|
26-40 |
B |
Capability to overcome financial difficulties seems comparatively
below average. |
Small |
|
11-25 |
Ca |
Adverse factors are apparent. Repayment of interest and principal sums
in default or expected to be in default upon maturity |
Limited with
full security |
|
<10 |
C |
Absolute credit risk exists. Caution needed to be exercised |
Credit not
recommended |
|
---- |
NB |
New Business |
---- |
This score serves as a reference to assess SC’s credit risk
and to set the amount of credit to be extended. It is calculated from a
composite of weighted scores obtained from each of the major sections of this
report. The assessed factors and their relative weights (as indicated through
%) are as follows:
Financial
condition (40%) Ownership
background (20%) Payment
record (10%)
Credit history (10%) Market trend (10%) Operational size
(10%)
This report is issued at your request without any
risk and responsibility on the part of MIRA INFORM PRIVATE LIMITED (MIPL)
or its officials.