MIRA
INFORM REPORT
|
Report Date : |
14.08.2012 |
IDENTIFICATION DETAILS
|
Name : |
MARTINELI-M.M. OOD |
|
|
|
|
Registered Office : |
Ul. Debar 7, 9000 Varna |
|
|
|
|
Country : |
Bulgaria |
|
|
|
|
Financials (as on) : |
31.12.2011 |
|
|
|
|
Date of Incorporation : |
1996 |
|
|
|
|
Legal Form : |
Limited
Liability Company (OOD) |
|
|
|
|
Line of Business : |
Retail sale of furniture, lighting
equipment and household articles |
|
|
|
|
No. of Employees : |
142 |
RATING & COMMENTS
|
MIRA’s Rating : |
Ba |
|
RATING |
STATUS |
PROPOSED CREDIT LINE |
|
|
41-55 |
Ba |
Overall operation is considered normal. Capable to meet normal
commitments. |
Satisfactory |
|
Status : |
Satisfactory |
|
Payment Behaviour : |
No complaints |
|
Litigation : |
Clear |
NOTES :
Any query related to this report can be made
on e-mail: infodept@mirainform.com
while quoting report number, name and date.
ECGC Country Risk Classification List – March 31st, 2012
|
Country Name |
Previous Rating (31.12.2011) |
Current Rating (31.03.2012) |
|
Bulgaria |
B1 |
B1 |
|
Risk Category |
ECGC
Classification |
|
Insignificant |
A1 |
|
Low |
A2 |
|
Moderate |
B1 |
|
High |
B2 |
|
Very High |
C1 |
|
Restricted |
C2 |
|
Off-credit |
D |
COMPANY DETAILS
Local
name: MARTINELI-M.M. OOD
International
name: MARTINELLI-M.M. OOD
Registered address:
ul. Debar 7
9000 Varna
Bulgaria
Telephone: +359-52-664200
Fax: +359-52-664250
E-Mail: accounting@martineli.com, office@martineli.com
Internet: http://www.martineli.com
ESTABLISHMENT & REGISTRATION:
Established:
1996
Registered at Varna district court
Court number 3880/1996
Bulstat/VAT number: 103096918
LEGAL FORM:
Limited
Liability Company (OOD)
REGISTERED CAPITAL:
BGN 5
000.00
BANKERS:
Unicredit Bulbank AD, www.bulbank.bg
SHAREHOLDERS/MANAGEMENT
SHAREHOLDERS:
Martin Nestorov Nestorov - 50%
ID 7611071124, born 07.11.1976
Yordanka Mileva Nestorova - 50%
ID 5507121017, born 12.07.1955
MANAGEMENT:
Martin Nestorov Nestorov - manager
Yordanka Mileva Nestorova - manager
RELATED COMPANIES:
Company
ID Company Name
200774349 MANDARIN - MN
103833960 EMONA 2003
103805344 MARTINELI
103172419 NESTOR-MARTINI
BUSINESS ACTIVITY
BUSINESS
OPERATION:
NACE 1.1: 52.44 Retail sale of
furniture, lighting equipment and household articles n.e.c.
Activity:
Luxury Italian bathroom equipment:
bath tubs for Hydro-massage, bathroom furniture, sanitary faience, shower
faucets and a rich range of accessories. More than 2,000 models of faience, terracotta,
granitogres - direct import from Italy and Spain.
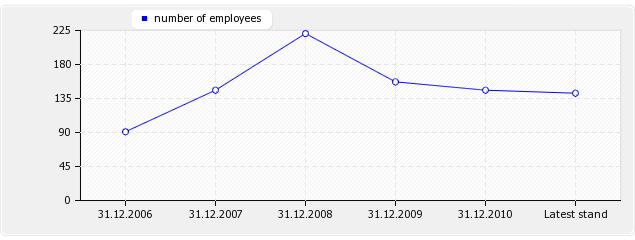
NUMBER
OF EMPLOYEES:
|
As at date |
Value |
|
31.12.2006 |
91 |
|
31.12.2007 |
146 |
|
31.12.2008 |
221 |
|
31.12.2009 |
157 |
|
31.12.2010 |
146 |
|
Latest stand |
142 |
EXPORT:
GR
IMPORT:
IT, ES, GR
REAL
ESTATE:
None
FINANCIAL DATA
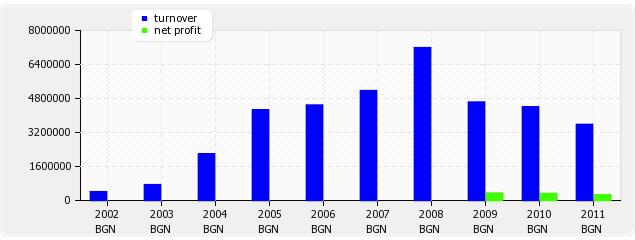
TURNOVER:
|
Year |
Currency |
Value |
|
2002 |
BGN |
416 000.00 |
|
2003 |
BGN |
747 000.00 |
|
2004 |
BGN |
2 190 000.00 |
|
2005 |
BGN |
4 261 000.00 |
|
2006 |
BGN |
4 492 000.00 |
|
2007 |
BGN |
5 173 000.00 |
|
2008 |
BGN |
7 195 000.00 |
|
2009 |
BGN |
4 633 000.00 |
|
2010 |
BGN |
4 406 000.00 |
|
2011 |
BGN |
3 583 000.00 |
MODES OF
PAYMENT:
Payments are made within agreed
terms.
DEBT
COLLECTION:
No debt collection cases are registered
against the company.
BANK
DISTRAINTS:
No shares of the company are under
bank distraint.
UNPAID
TAXES/ CONTRIBUTIONS TO GOVERNMENT:
There is no publication about
overdue unpaid taxes.
INVOLVEMENT
IN LEGAL DISPUTES:
There is no publication about legal
claims or disputes against the company.
OTHER
PAYMENT INFORMATION:
No adverse payment information is
available.
BRANCH
INDICATOR:
The company's payment behaviour is average for the branch.
GENERAL
PAYMENT ASSESSMENT:
FINANCIAL
OPINION:
Exchange since for 1998 BGN
(denominated lev) = 0.51 EUR
|
Ratio |
2009 |
2010 |
2011 |
|
Debt ratio |
0.35 |
0.25 |
0.22 |
|
Quick ratio |
0.20 |
0.09 |
0.12 |
|
Current ratio |
2.67 |
3.81 |
4.46 |
|
Days purchase in payables |
132.29 |
87.73 |
100.37 |
|
Operating margin in % |
9.25 |
8.45 |
8.45 |
|
Cash ratio (acid ratio) |
0.18 |
0.04 |
0.05 |
|
Return on sales ROS in % |
8.34 |
7.61 |
7.61 |
|
Return on assets ROA in % |
7.85 |
7.81 |
6.06 |
|
Return on equity ROE in % |
12.00 |
10.41 |
7.79 |
|
Days supply in inventory |
327.64 |
326.72 |
435.10 |
|
Days sales in receivables |
2.26 |
4.25 |
7.25 |
|
BALANCE SHEET in BGN'000 |
2009 |
2010 |
2011 |
|
Accounting period: |
1.1.2009 - |
1.1.2010 - |
1.1.2011 - |
|
A.UNPAID CAPITAL |
|
|
|
|
B. FIXED ASSETS |
|
|
|
|
I Fixed Intangible Assets: |
|
|
|
|
R&D Products |
|
|
|
|
Concessions, patents, trade-marks
etc |
|
|
|
|
Goodwill |
|
|
|
|
Intangible fixed assets under
construction |
|
|
|
|
thereof advances |
|
|
|
|
Total I: |
|
|
|
|
II Fixed Tangible Assets |
|
|
|
|
Land and Buildings |
|
|
|
|
thereof Land |
|
|
|
|
thereof Buildings |
|
|
|
|
Machines, Vehicles |
|
|
|
|
Equipment |
14 |
11 |
7 |
|
Tangible fixed assets under
construction |
|
|
|
|
thereof advances |
|
|
|
|
Total II |
14 |
11 |
7 |
|
III. Fixed Financial Assets |
|
|
|
|
Shares in group companies |
|
|
|
|
Loans granted to group companies |
|
|
|
|
Shares in joint ventures |
|
|
|
|
Long term investments |
|
|
|
|
Other loans |
|
|
|
|
Bought back own shares |
|
|
|
|
Total III |
|
|
|
|
IV. Deferred Taxes |
|
|
|
|
B. FIXED ASSETS TOTAL |
14 |
11 |
7 |
|
C. CURRENT ASSETS |
|
|
|
|
I. Inventories |
|
|
|
|
Raw Materials |
|
|
|
|
Work in progress |
|
|
|
|
thereof young animals |
|
|
|
|
Trading goods |
3633 |
3312 |
3821 |
|
thereof production |
|
|
|
|
thereof goods for sale |
3633 |
3312 |
3821 |
|
Advances |
144 |
684 |
501 |
|
Total I |
3777 |
3996 |
4322 |
|
II. Receivables |
|
|
|
|
Receivables from customers |
11 |
38 |
66 |
|
thereof more than 1 year |
|
|
|
|
Receivables from group companies |
|
|
|
|
thereof more than 1 year |
|
|
|
|
Receivables from joint ventures |
|
|
|
|
thereof more than 1 year |
|
|
|
|
Other receivables |
15 |
14 |
6 |
|
thereof more than 1 year |
5 |
5 |
5 |
|
Total II |
26 |
52 |
72 |
|
III. Current Financial Assets |
|
|
|
|
Current investments in related
companies |
|
|
|
|
Bought back own shares |
|
|
|
|
Other current financial assets |
|
|
|
|
Total III |
|
|
|
|
IV. Cash equivalents |
|
|
|
|
Cash and accounts in the country |
274 |
41 |
51 |
|
thereof cash |
27 |
13 |
39 |
|
Thereof cash in foreign currency (equivalent) |
|
|
|
|
thereof current accounts |
247 |
28 |
12 |
|
thereof blocked accounts |
|
|
|
|
thereof cash equivalents |
|
|
|
|
Cash and accounts abroad |
|
|
|
|
thereof cash |
|
|
|
|
Thereof cash in foreign currency
(equivalent) |
|
|
|
|
thereof current accounts |
|
|
|
|
thereof blocked accounts |
|
|
|
|
Total IV |
274 |
41 |
51 |
|
C. CURRENT ASSETS TOTAL |
4077 |
4089 |
4445 |
|
D. Deferred expenses |
318 |
192 |
36 |
|
TOTAL ASSETS |
4409 |
4292 |
4488 |
|
A. OWNERS EQUITY |
|
|
|
|
I. Share capital |
5 |
5 |
5 |
|
II. Issue premium |
|
|
|
|
III. Revaluation reserves |
|
|
|
|
thereof revaluation reserves of
financial instruments |
|
|
|
|
IV. Reserves |
|
|
|
|
legal reserves |
|
|
|
|
reserve related to bought back own
shares |
|
|
|
|
reserve from company foundation |
|
|
|
|
other reserves |
1357 |
1703 |
1703 |
|
Total IV |
1357 |
1703 |
1703 |
|
V. Result from previous period |
|
|
|
|
Undistributed profit |
1176 |
1176 |
1511 |
|
Uncovered loss |
|
|
|
|
Total V |
1176 |
1176 |
1511 |
|
VI. Current result profit (loss) |
346 |
335 |
272 |
|
A. OWNERS EQUITY TOTAL |
2884 |
3219 |
3491 |
|
B. PROVISIONS |
|
|
|
|
Provisions for pensions |
|
|
|
|
Provisions for taxes |
|
|
|
|
thereof deferred taxes |
|
|
|
|
Other provisions |
|
|
|
|
B. PROVISIONS TOTAL |
|
|
|
|
C. LIABILITIES |
|
|
|
|
Bond-backed loans |
|
|
|
|
less than 1 year |
|
|
|
|
more than 1 year |
|
|
|
|
Bank loans |
|
|
|
|
less than 1 year |
|
|
|
|
more than 1 year |
|
|
|
|
Advances received |
1071 |
410 |
202 |
|
less than 1 year |
1071 |
410 |
202 |
|
more than 1 year |
|
|
|
|
Payables to suppliers |
295 |
524 |
578 |
|
less than 1 year |
295 |
524 |
578 |
|
more than 1 year |
|
|
|
|
Liabilities on policies |
|
|
|
|
less than 1 year |
|
|
|
|
more than 1 year |
|
|
|
|
Liabilities to group companies |
|
|
|
|
less than 1 year |
|
|
|
|
more than 1 year |
|
|
|
|
Liabilities to joint-venture
companies |
|
|
|
|
less than 1 year |
|
|
|
|
more than 1 year |
|
|
|
|
Other liabiliies |
159 |
139 |
217 |
|
less than 1 year |
159 |
139 |
217 |
|
more than 1 year |
|
|
|
|
thereof to personnel |
38 |
40 |
40 |
|
less than 1 year |
38 |
40 |
40 |
|
more than 1 year |
|
|
|
|
thereof to social insurance |
15 |
15 |
16 |
|
less than 1 year |
15 |
15 |
16 |
|
more than 1 year |
|
|
|
|
thereof for taxes |
69 |
44 |
16 |
|
less than 1 year |
69 |
44 |
16 |
|
more than 1 year |
|
|
|
|
C. LIABILITIES TOTAL |
1525 |
1073 |
997 |
|
less than 1 year |
1525 |
1073 |
997 |
|
more than 1 year |
|
|
|
|
D. FINANCING AND DEFERRED INCOME |
|
|
|
|
thereof |
|
|
|
|
Financing |
|
|
|
|
Deferred income |
|
|
|
|
TOTAL EQUITY AND LIABILITIES |
4409 |
4292 |
4488 |
|
P&L ACCOUNT in BGN'000 |
2009 |
2010 |
2011 |
|
Accounting period: |
1.1.2009 - |
1.1.2010 - |
1.1.2011 - |
|
A. EXPENSES |
|
|
|
|
I. OPERATION EXPENSES |
|
|
|
|
Decrease of inventories |
108 |
|
|
|
thereof for materials |
95 |
54 |
40 |
|
thereof for services |
826 |
1087 |
927 |
|
Personnel expenses |
767 |
699 |
768 |
|
thereof wages |
650 |
595 |
651 |
|
thereof social insurance |
117 |
104 |
117 |
|
thereof pensions |
|
|
|
|
Depreciation |
19 |
5 |
5 |
|
thereof Depreciation of fixed
assets |
|
|
4 |
|
Other expenses |
2422 |
2170 |
1519 |
|
thereof Book value of sold assets (without
production) |
2416 |
2168 |
1516 |
|
I. OPERATION EXPENSES TOTAL |
4237 |
4015 |
3259 |
|
II. Financial expenditures |
|
|
|
|
Depreciation of financial assets |
207 |
70 |
97 |
|
thereof exchange rate losses |
207 |
70 |
97 |
|
Paid interest |
19 |
24 |
18 |
|
thereof interest to group
companies |
|
|
|
|
Thereof expenditures for
securities operations |
|
|
|
|
II. Financial expenditures Total |
226 |
94 |
115 |
|
B. Profit on ordinary activity |
384 |
372 |
302 |
|
III. Extraordinary expenses |
|
|
|
|
thereof expenses on disasters and
emergency expenses |
|
|
|
|
C. Total expenses (I+II+III) |
4463 |
4109 |
3374 |
|
D. Accounting profit |
384 |
372 |
302 |
|
IV. Taxation on profit |
38 |
37 |
30 |
|
V. Other taxes |
|
|
|
|
E. Net profit |
346 |
335 |
272 |
|
Total expenses |
4847 |
4481 |
3676 |
|
A. REVENUES |
|
|
|
|
I . OPERATING REVENUES |
|
|
|
|
Net sales |
4150 |
4403 |
3576 |
|
Production |
|
|
|
|
Goods |
3963 |
3235 |
2950 |
|
Services |
176 |
1121 |
626 |
|
Increase of production and work in
progress |
|
|
|
|
Expenses on acquisition of assets |
|
|
|
|
Other revenues |
494 |
50 |
7 |
|
thereof financing |
|
|
|
|
I. TOTAL OPERATING REVENUES |
4633 |
4406 |
3583 |
|
II FINANCIAL REVENUES |
|
|
|
|
Income from shares |
|
|
|
|
thereof income from shares in
group companies |
|
|
|
|
Income from investments and loans |
|
|
|
|
thereof from investments in group
companies |
|
|
|
|
Income from interest |
|
|
|
|
thereof from interest from group
companies |
|
|
|
|
II FINANCIAL REVENUES TOTAL |
211 |
75 |
93 |
|
TOTAL REVENUES FROM ORDINARY
ACTIVITIES |
4847 |
4481 |
3676 |
|
LOSS |
|
|
|
|
Extraordinary revenues |
|
|
|
|
AFTER TAX LOSS |
|
|
|
|
TOTAL REVENUES |
4847 |
4481 |
3676 |
FOREIGN EXCHANGE RATES
|
Currency |
Unit
|
Indian Rupees |
|
US Dollar |
1 |
Rs.55.41 |
|
|
1 |
Rs.86.77 |
|
Euro |
1 |
Rs.55.41 |
INFORMATION DETAILS
|
Report Prepared
by : |
PDT |
RATING EXPLANATIONS
|
RATING |
STATUS |
PROPOSED CREDIT LINE |
|
|
>86 |
Aaa |
Possesses an extremely sound financial base with the strongest capability
for timely payment of interest and principal sums |
Unlimited |
|
71-85 |
Aa |
Possesses adequate working capital. No caution needed for credit
transaction. It has above average (strong) capability for payment of interest
and principal sums |
Large |
|
56-70 |
A |
Financial & operational base are regarded healthy. General unfavourable factors will not cause fatal effect.
Satisfactory capability for payment of interest and principal sums |
Fairly Large |
|
41-55 |
Ba |
Overall operation is considered normal. Capable to meet normal
commitments. |
Satisfactory |
|
26-40 |
B |
Capability to overcome financial difficulties seems comparatively
below average. |
Small |
|
11-25 |
Ca |
Adverse factors are apparent. Repayment of interest and principal sums
in default or expected to be in default upon maturity |
Limited with
full security |
|
<10 |
C |
Absolute credit risk exists. Caution needed to be exercised |
Credit not
recommended |
|
-- |
NB |
New Business |
-- |
This score serves as a reference to assess SC’s credit risk
and to set the amount of credit to be extended. It is calculated from a composite
of weighted scores obtained from each of the major sections of this report. The
assessed factors and their relative weights (as indicated through %) are as
follows:
Financial
condition (40%) Ownership
background (20%) Payment
record (10%)
Credit history
(10%) Market trend
(10%) Operational
size (10%)
This report is issued at your request without any
risk and responsibility on the part of MIRA INFORM PRIVATE LIMITED (MIPL)
or its officials.