MIRA
INFORM REPORT
|
Report Date : |
17.08.2012 |
IDENTIFICATION DETAILS
|
Name : |
MGC TRADING
[THAILAND] LTD. |
|
|
|
|
Registered Office : |
Unit 1810,
18th Floor, Empire
Tower, South
Sathorn Road, Yannawa, Sathorn, Bangkok
10120 |
|
|
|
|
Country : |
Thailand |
|
|
|
|
Financials (as on) : |
31.12.2011 |
|
|
|
|
Date of Incorporation : |
2006 |
|
|
|
|
Com. Reg. No.: |
0105549059273 |
|
|
|
|
Legal Form : |
Private Limited
Company |
|
|
|
|
Line of Business : |
Importer and Distributor
of Industrial Chemicals |
|
|
|
|
No. of Employees : |
7 |
RATING & COMMENTS
|
MIRA’s Rating : |
B |
|
RATING |
STATUS |
PROPOSED CREDIT LINE |
|
|
26-40 |
B |
Capability to overcome financial difficulties seems comparatively
below average. |
Small |
|
Status : |
Moderate |
|
Payment Behaviour : |
Slow |
|
Litigation : |
Clear |
NOTES :
Any query related to this report can be made
on e-mail: infodept@mirainform.com
while quoting report number, name and date.
ECGC Country Risk Classification List – March 31st, 2012
|
Country Name |
Previous Rating (31.12.2011) |
Current Rating (31.03.2012) |
|
Thailand |
B1 |
B1 |
|
Risk Category |
ECGC
Classification |
|
Insignificant |
A1 |
|
Low |
A2 |
|
Moderate |
B1 |
|
High |
B2 |
|
Very High |
C1 |
|
Restricted |
C2 |
|
Off-credit |
D |
Company name
MGC TRADING
[THAILAND] LTD.
SUMMARY
BUSINESS ADDRESS : UNIT
1810, 18th FLOOR,
EMPIRE TOWER,
195
SOUTH
SATHORN ROAD, YANNAWA,
SATHORN, BANGKOK
10120, THAILAND
TELEPHONE
: [66] 2670-3417
FAX :
[66] 2670-3419
E-MAIL ADDRESS : bee@mgc.co.th
REGISTRATION ADDRESS : SAME
AS BUSINESS ADDRESS
ESTABLISHED : 2006
REGISTRATION NO. : 0105549059273
TAX ID NO. : 3032243537
CAPITAL REGISTERED : BHT.
200,000,000
CAPITAL PAID-UP
: BHT. 50,000,000
SHAREHOLDER’S PROPORTION : FOREIGN : 100%
FISCAL YEAR CLOSING DATE : DECEMBER 31
LEGAL STATUS : PRIVATE LIMITED
COMPANY
EXECUTIVE
: MR. KAZUYA KUSAKABE,
JAPANESE
PRESIDENT
NO. OF
STAFF : 7
LINES OF
BUSINESS : INDUSTRIAL CHEMICALS
IMPORTER AND
DISTRIBUTOR
CORPORATE PROFILE
OPERATING TREND : STABLE
PRESENT SITUATION : OPERATING NORMALLY
REPUTATION : GOOD
WITH NORMAL BUSINESS
ENGAGEMENT
MANAGEMENT STANDARD : MANAGEMENT WITH
FAIR PERFORMANCE
HISTORY
The subject
was established on
May 15, 2006
as a private
limited company under the
registered name MGC
TRADING [THAILAND] LTD.,
by foreign groups, with
the business objective
to import and
distribute wide range
of industrial chemicals
to domestic market.
It currently employs
7 staff.
The subject
is a subsidiary
of Mitsubishi Gas
Chemical Company Inc., Japan.
The subject’s
registered address is
Unit 1810, 18th Flr., Empire
Tower, 195 South Sathorn
Rd., Yannawa, Sathorn,
Bangkok 10120, and
this is the
subject’s current operation
address.
THE BOARD
OF DIRECTOR
|
Name |
|
Nationality |
Age |
|
|
|
|
|
|
Mr. Yoshishige
Yamazaki |
|
Japanese |
62 |
|
Mr. Kunio Kawa |
|
Japanese |
57 |
|
Mr. Jin Hata |
|
Japanese |
62 |
|
Mr. Kazuya Kusakabe |
[x] |
Japanese |
53 |
|
Mr. Yoshihiro
Kawamoto |
[x] |
Japanese |
45 |
AUTHORIZED PERSON
One of the
mentioned directors [x]
can sign on
behalf of the
subject with company’s
affixed.
MANAGEMENT
Mr. Kazuya Kusakabe is
the President.
He is Japanese
nationality with the
age of 53
years old.
BUSINESS OPERATIONS
The subject
is engaged in
importing and distributing
wide range of
industrial chemicals, e.g. Melamine, Phenol, Phthalic
anhydride for various industries,
such as electronics,
consumer goods, cosmetics,
plastics, foods, pharmaceuticals, coating
and painting, oil & gas, petrochemical
and other industries.
PURCHASE
80% of the
products is imported
from Japan, Singapore,
Taiwan and Republic
of China, the
remaining 20% is
purchased from local
suppliers.
MAJOR SUPPLIERS
Mitsubishi Gas
Chemical Company Inc. : Japan
MGC Pure
Chemicals Singapore Pte.
Ltd. : Singapore
SALES
100% of the
products is sold
locally by wholesale
to manufacturers and
end-users.
SUBSIDIARY AND AFFILIATED
COMPANY
The subject is
not found to
have any subsidiary
or affiliated company
here in Thailand.
LITIGATION
Bankruptcy and Receivership
There are no
litigation on bankruptcy
and receivership cases
filed against the
subject found at
Legal Execution Department
for the past
five years.
Others
There are no
legal suits filed
against the subject
for the past
two years.
CREDIT
Sales are by
cash or on
the credits term
of 30-60 days.
Local bills are
paid by cash
or on the
credits term of
30-60 days.
Imports are by
T/T.
BANKING
The Bank
of Tokyo-Mitsubishi UFJ.
Ltd.
[Bangkok Branch, 54
North Sathorn Rd.,
Silom, Bangrak, Bangkok]
EMPLOYMENT
The subject
currently employs 7
staff.
LOCATION DETAILS
The premise
is rented for administrative office
at the heading
address. Premise is
located in prime
commercial area.
COMMENT
The subject was
formed in 2006
as a distributor
of industrial chemicals.
The products were in
relation with industrial
consumption. Consumer spending
increased has been
driven by industrial upturn
which had positive
gain of subject’s
sales in 2011.
The subject
developed strong relationships with third-party chemical producers over
the years and provide sales for a variety of their items to regional customers.
FINANCIAL INFORMATION
The capital
was registered at
Bht. 200,000,000 divided
into 200,000 shares
of Bht. 1,000
each, with the
current capital paid-up
at Bht. 50,000,000
or 25% of
the total shares.
THE SHAREHOLDERS
LISTED WERE : [as at
April 30, 2012]
at Bht. 50,000,000
of capitalization
|
NAME |
HOLDING |
% |
|
|
|
|
|
Mitsubishi Gas Chemical
Company Inc. Nationality:
Japanese Address : 5-2
Mitsubishi Building, Marunouji
2-Chome,
Chiyoda-ku, Tokyo, Japan
|
179,500 |
89.75 |
|
Mitsubishi Gas Chemical
Singapore Pte. Ltd. Nationality:
Singaporean Address : 24
Raffles Place 16-01
Clifford Center,
Singapore |
20,000 |
10.00 |
|
MGC Pure Chemicals
Singapore Pte. Ltd. Nationality:
Singaporean Address : 29
Tuas West Street,
Singapore |
100 |
0.05 |
|
Tokyo Shokai Ltd. Nationality:
Japanese Address : 6-1
Kanda Surakadai 3- Chome,
Chiyoda-ku, Tokyo, Japan |
100 |
0.05 |
|
Ryoko Chemical Company
Ltd. Nationality:
Japanese Address : 12-20
PMO Nihonbashi-Honshu Building,
4-Chome, Chow-ku, Tokyo,
Japan |
100 |
0.05 |
|
Ryoyo Trading Company
Ltd. Nationality:
Japanese Address : 1-3
Tokyo Sakurada Building,
Nishi-Shinbashi 1- Chome, Minato-ku,
Tokyo, Japan |
100 |
0.05 |
|
Ryowa
Enterprise Company Ltd. Nationality:
Japanese Address : 5-2
Mitsubishi Building, Marunouji
2-Chome,
Chiyoda-ku, Tokyo, Japan
|
100 |
0.05 |
Total
Shareholders : 7
Share Structure [as at
April 30, 2012]
|
Nationality |
Shareholders |
No.
of Share |
% Shares |
|
|
|
|
|
|
Thai |
- |
- |
- |
|
Foreign |
7 |
200,000 |
100.00 |
|
Total |
7 |
200,000 |
100.00 |
NAME OF AUDITOR
& CERTIFIED PUBLIC
ACCOUNTANT NO. :
Mr. Prasit
Yuengsrikul No. 4174
BALANCE SHEET [BAHT]
The latest
financial figures published
for December 31,
2011 & 2010
were:
ASSETS
|
Current
Assets |
2011 |
2010 |
|
|
|
|
|
Cash and Cash
Equivalents |
27,432,301 |
32,432,979 |
|
Trade Accounts & Other Receivable |
184,884,273 |
193,149,245 |
|
Inventories
|
46,962,137 |
69,131,469 |
|
Financial
Derivative Contract Receivable
|
227,783 |
- |
|
Other Current Assets
|
3,404,679 |
4,880,198 |
|
|
|
|
|
Total Current Assets |
262,911,173 |
299,593,891 |
|
Fixed Assets
|
133,712 |
195,328 |
|
Intangible Assets |
93,833 |
86,979 |
|
Other Non current
Assets |
216,107 |
216,107 |
|
Total Assets |
263,354,825 |
300,092,305 |
LIABILITIES
& SHAREHOLDERS’ EQUITY [BAHT]
|
Current
Liabilities |
2011 |
2010 |
|
|
|
|
|
Trade Accounts
& Other Payable |
206,644,449 |
238,912,981 |
|
Accrued Income
Tax |
- |
2,394,688 |
|
Other Current Liabilities |
154,463 |
84,974 |
|
|
|
|
|
Total Current Liabilities |
206,798,912 |
241,392,643 |
|
|
|
|
|
Estimated Liabilities from
Employee’s Benefit |
411,939 |
- |
|
Total Liabilities |
207,210,851 |
241,392,643 |
|
|
|
|
|
Shareholders' Equity |
|
|
|
|
|
|
|
Share capital : Baht 1,000
value Authorized &
issued share capital
200,000 shares |
200,000,000 |
200,000,000 |
|
|
|
|
|
Capital Paid |
50,000,000 |
50,000,000 |
|
Retained Earning
Appropriated for
Statutory Reserve |
407,479 |
- |
|
Unappropriated |
5,736,495 |
8,699,662 |
|
Total Shareholders' Equity
|
56,143,974 |
58,699,662 |
|
Total Liabilities
& Shareholders' Equity |
263,354,825 |
300,092,305 |
PROFIT &
LOSS ACCOUNT
|
Revenue |
2011 |
2010 |
|
|
|
|
|
Sales
|
800,284,390 |
576,045,240 |
|
Other Income |
5,448,078 |
10,606,581 |
|
Total Revenues |
805,732,468 |
586,651,821 |
|
Expenses |
|
|
|
|
|
|
|
Cost of Goods
Sold |
782,140,441 |
563,501,939 |
|
Selling Expenses |
1,164,233 |
840,028 |
|
Administrative
Expenses |
12,071,903 |
10,579,312 |
|
Other Expenses - Loss
on Exchange Rate |
10,050,609 |
- |
|
Total Expenses |
805,427,186 |
574,921,279 |
|
|
|
|
|
Profit before Income Tax |
305,282 |
11,730,542 |
|
Income Tax |
[147,903] |
[3,580,970] |
|
Net Profit / [Loss]
|
157,379 |
8,149,572 |
FINANCIAL ANALYSIS
|
ITEM |
UNIT |
2011 |
2010 |
|
|
|
|
|
|
LIQUIDITY
RATIO |
|
|
|
|
CURRENT RATIO |
TIMES |
1.27 |
1.24 |
|
QUICK RATIO |
TIMES |
1.03 |
0.93 |
|
|
|
|
|
|
ACTIVITY
RATIO |
|
|
|
|
FIXED ASSETS TURNOVER |
TIMES |
5,985.14 |
2,949.12 |
|
TOTAL ASSETS TURNOVER |
TIMES |
3.04 |
1.92 |
|
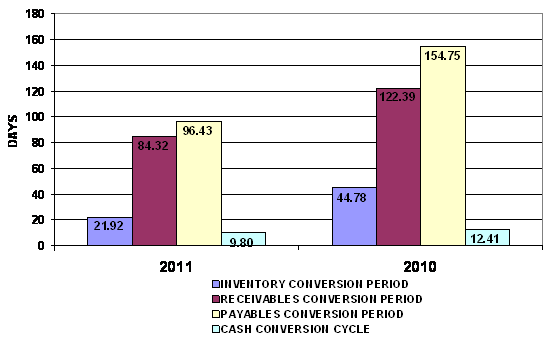
INVENTORY CONVERSION PERIOD |
DAYS |
21.92 |
44.78 |
|
INVENTORY TURNOVER |
TIMES |
16.65 |
8.15 |
|
RECEIVABLES CONVERSION PERIOD |
DAYS |
84.32 |
122.39 |
|
RECEIVABLES TURNOVER |
TIMES |
4.33 |
2.98 |
|
PAYABLES CONVERSION PERIOD |
DAYS |
96.43 |
154.75 |
|
CASH CONVERSION CYCLE |
DAYS |
9.80 |
12.41 |
|
|
|
|
|
|
PROFITABILITY
RATIO |
|
|
|
|
COST OF GOODS SOLD |
% |
97.73 |
97.82 |
|
SELLING & ADMINISTRATION |
% |
1.65 |
1.98 |
|
INTEREST |
% |
- |
- |
|
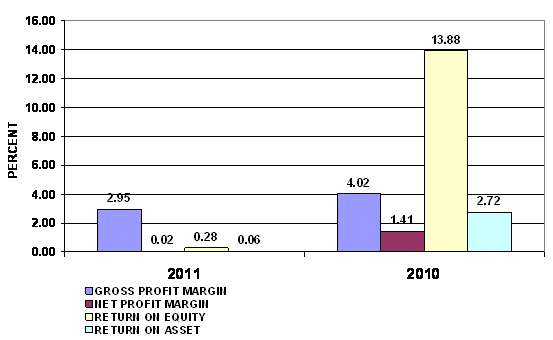
GROSS PROFIT MARGIN |
% |
2.95 |
4.02 |
|
NET PROFIT MARGIN BEFORE EX. ITEM |
% |
0.04 |
2.04 |
|
NET PROFIT MARGIN |
% |
0.02 |
1.41 |
|
RETURN ON EQUITY |
% |
0.28 |
13.88 |
|
RETURN ON ASSET |
% |
0.06 |
2.72 |
|
EARNING PER SHARE |
BAHT |
3.15 |
162.99 |
|
|
|
|
|
|
LEVERAGE
RATIO |
|
|
|
|
DEBT RATIO |
TIMES |
0.79 |
0.80 |
|
DEBT TO EQUITY RATIO |
TIMES |
3.69 |
4.11 |
|
TIME INTEREST EARNED |
TIMES |
- |
- |
|
|
|
|
|
|
ANNUAL
GROWTH |
|
|
|
|
SALES GROWTH |
% |
38.93 |
|
|
OPERATING PROFIT |
% |
(97.40) |
|
|
NET PROFIT |
% |
(98.07) |
|
|
FIXED ASSETS |
% |
(31.54) |
|
|
TOTAL ASSETS |
% |
(12.24) |
|
PROFITABILITY
RATIO
|
Gross Profit Margin |
2.95 |
Deteriorated |
Industrial
Average |
12.07 |
|
Net Profit Margin |
0.02 |
Deteriorated |
Industrial
Average |
1.82 |
|
Return on Assets |
0.06 |
Deteriorated |
Industrial
Average |
4.28 |
|
Return on Equity |
0.28 |
Deteriorated |
Industrial
Average |
11.66 |
Gross Profit Margin used to assess a firm's financial health
by revealing the proportion of money left over from revenues after accounting
for the cost of goods sold. Gross profit margin serves as the source for paying
additional expenses and future savings. The company's figure is 2.95%. When
compared with the industry average, the ratio of the company was lower,
indicated that company was originated from the problems with control over its
costs.
Net Profit Margin is the indicator of the company's
efficiency in that net profit takes into consideration all expenses of the
company. A low profit margin indicates a low margin of safety, higher risk that
a decline in sales will erase profits and result in a net loss. The company's
figure is 0.02%. When compared with the industry average, the ratio of the
company was lower.
Return on Assets measures how efficiently profits are being
generated from the assets employed in the business when compared with the
ratios of firms in a similar business. A low ratio in comparison with industry
averages indicates an inefficient use of business assets. When compared with
the industry average, it was lower, the company's figure is 0.06%.
Return on Equity indicates how profitable a company is by
comparing its net income to its average shareholders' equity, ROE measures how
much the shareholders earned for their investment in the company. When compared
with the industry average, it was lower, the company's figure is 0.28%.
Trend
of the average competitors in the same industry for last 5 years
Return on Assets Uptrend
Return on Equity Uptrend
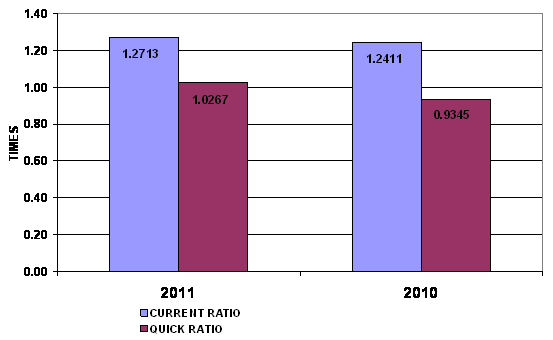
LIQUIDITY
RATIO
|
Current Ratio |
1.27 |
Satisfactory |
Industrial
Average |
1.50 |
|
Quick Ratio |
1.03 |
|
|
|
|
Cash Conversion Cycle |
9.80 |
|
|
|
The Current Ratio is to ascertain whether a company's short-term
assets are readily available to pay off its short-term liabilities. The
company's figure is 1.27 times in 2011, increased from 1.24 times, then it is
generally considered to have good short-term financial strength. When compared
with the industry average, the ratio of the company was lower.
The Quick Ratio is a liquidity indicator that further
refines the current ratio by measuring the amount of the most liquid current
assets there are to cover current liabilities. The company's figure is 1.03 times
in 2011, increased from 0.93 times,
although excluding inventory so the company still have good short-term
financial strength.
The Cash Conversion Cycle measures the number of days a company's
cash is tied up in the production and sales process of its operations and the
benefit from payment terms from its creditors. It meant the company could
survive when no cash inflow was received from sale for 10 days.
Trend
of the average competitors in the same industry for last 5 years
Current Ratio Uptrend
LEVERAGE
RATIO
|
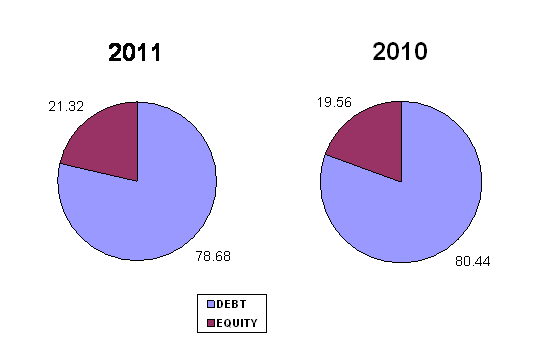
Debt Ratio |
0.79 |
Acceptable |
Industrial
Average |
0.58 |
|
Debt to Equity Ratio |
3.69 |
Risky |
Industrial
Average |
1.51 |
|
Times Interest Earned |
- |
|
Industrial
Average |
3.36 |
Debt to Equity Ratio a measurement of how much suppliers,
lenders, creditors and obligors have committed to the company versus what the
shareholders have committed. A lower the percentage means that the company is using
less leverage and has a stronger equity position.
Debt Ratio shows the proportion of a company's assets which
are financed through debt. The company's figure is 0.79 greater than 0.5, most
of the company's assets are financed through debt.
Trend
of the average competitors in the same industry for last 5 years
Debt Ratio Downtrend
Times Interest Earned Uptrend
ACTIVITY
RATIO
|
Fixed Assets Turnover |
5,985.14 |
Impressive |
Industrial
Average |
10.00 |
|
Total Assets Turnover |
3.04 |
Impressive |
Industrial
Average |
2.32 |
|
Inventory Conversion Period |
21.92 |
|
|
|
|
Inventory Turnover |
16.65 |
Impressive |
Industrial
Average |
6.90 |
|
Receivables Conversion Period |
84.32 |
|
|
|
|
Receivables Turnover |
4.33 |
Satisfactory |
Industrial
Average |
4.46 |
|
Payables Conversion Period |
96.43 |
|
|
|
Trend
of the average competitors in the same industry for last 5 years
Fixed Assets Turnover Downtrend
Total Assets Turnover Downtrend
Inventory Turnover Downtrend
Receivables Turnover Uptrend
FOREIGN EXCHANGE RATES
|
Currency |
Unit
|
Indian Rupees |
|
US Dollar |
1 |
Rs.55.98 |
|
|
1 |
Rs.87.55 |
|
Euro |
1 |
Rs.68.68 |
INFORMATION DETAILS
|
Report Prepared
by : |
PDT |
RATING EXPLANATIONS
|
RATING |
STATUS |
PROPOSED CREDIT LINE |
|
|
>86 |
Aaa |
Possesses an extremely sound financial base with the strongest
capability for timely payment of interest and principal sums |
Unlimited |
|
71-85 |
Aa |
Possesses adequate working capital. No caution needed for credit
transaction. It has above average (strong) capability for payment of interest
and principal sums |
Large |
|
56-70 |
A |
Financial & operational base are regarded healthy. General unfavourable
factors will not cause fatal effect. Satisfactory capability for payment of
interest and principal sums |
Fairly Large |
|
41-55 |
Ba |
Overall operation is considered normal. Capable to meet normal
commitments. |
Satisfactory |
|
26-40 |
B |
Capability to overcome financial difficulties seems comparatively
below average. |
Small |
|
11-25 |
Ca |
Adverse factors are apparent. Repayment of interest and principal sums
in default or expected to be in default upon maturity |
Limited with full
security |
|
<10 |
C |
Absolute credit risk exists. Caution needed to be exercised |
Credit not
recommended |
|
-- |
NB |
New Business |
-- |
This score serves as a reference to assess SC’s credit risk and
to set the amount of credit to be extended. It is calculated from a composite
of weighted scores obtained from each of the major sections of this report. The
assessed factors and their relative weights (as indicated through %) are as
follows:
Financial
condition (40%) Ownership
background (20%) Payment
record (10%)
Credit history
(10%) Market trend
(10%) Operational
size (10%)
This report is issued at your request without any
risk and responsibility on the part of MIRA INFORM PRIVATE LIMITED (MIPL)
or its officials.