MIRA
INFORM REPORT
|
Report Date : |
21.08.2012 |
IDENTIFICATION DETAILS
|
Name : |
THAI
STEEL SERVICE CENTER
LIMITED |
|
|
|
|
Registered Office : |
47 Moo 7, Soi Watmahawongse, Poochaosamingprai Road, Phrapradaeng, Samutprakarn 10130 |
|
|
|
|
Country : |
Thailand |
|
|
|
|
Financials (as on) : |
31.12.2011 |
|
|
|
|
Date of Incorporation : |
16.09.1980 |
|
|
|
|
Com. Reg. No.: |
0105523016402 |
|
|
|
|
Legal Form : |
Private Limited Company |
|
|
|
|
Line of Business : |
Importer & distributor of steel products |
|
|
|
|
No. of Employees : |
400 employees |
RATING & COMMENTS
|
MIRA’s Rating : |
Ba |
|
RATING |
STATUS |
PROPOSED CREDIT LINE |
|
|
41-55 |
Ba |
Overall operation is considered normal. Capable to meet normal
commitments. |
Satisfactory |
|
Status : |
Satisfactory |
|
Payment Behaviour : |
No Complaints |
|
Litigation : |
Clear |
NOTES:
Any query related to this report can be made
on e-mail: infodept@mirainform.com
while quoting report number, name and date.
ECGC Country Risk Classification List – March 31st, 2012
|
Country Name |
Previous Rating (31.12.2011) |
Current Rating (31.03.2012) |
|
Thailand |
B1 |
B1 |
|
Risk Category |
ECGC
Classification |
|
Insignificant |
A1 |
|
Low |
A2 |
|
Moderate |
B1 |
|
High |
B2 |
|
Very High |
C1 |
|
Restricted |
C2 |
|
Off-credit |
D |
Company name
THAI STEEL SERVICE CENTER LIMITED
SUMMARY
BUSINESS
ADDRESS : 47
MOO 7, SOI
WATMAHAWONGSE,
POOCHAOSAMINGPRAI ROAD,
PHRAPRADAENG,
SAMUTPRAKARN 10130,
THAILAND
TELEPHONE : [66] 2398-0153-4
FAX :
[66] 2398-5339,
2748-3842
E-MAIL
ADDRESS : thaipiya@tsscthai.com
REGISTRATION
ADDRESS : SAME
AS BUSINESS ADDRESS
ESTABLISHED
: 1980
REGISTRATION
NO. : 0105523016402 [Former : 1643/2523]
TAX
ID NO. : 3101120271
CAPITAL REGISTERED : BHT. 216,000,000
CAPITAL PAID-UP : BHT.
216,000,000
SHAREHOLDER’S PROPORTION : THAI : 15.61%
JAPANESE :
84.39%
FISCAL YEAR CLOSING DATE : DECEMBER 31
LEGAL
STATUS : PRIVATE LIMITED
COMPANY
EXECUTIVE : MR.
KEIZO HASHIMOTO, JAPANESE
PRESIDENT
NO.
OF STAFF : 400
LINES
OF BUSINESS : STEEL
PRODUCTS
IMPORTER &
DISTRIBUTOR
CORPORATE PROFILE
OPERATING
TREND : STABLE
PRESENT
SITUATION : OPERATING NORMALLY
REPUTATION : GOOD
WITH NORMAL BUSINESS
ENGAGEMENT
MANAGEMENT
STANDARD : MANAGEMENT WITH
FAIR PERFORMANCE
HISTORY
The subject was
established on September
16, 1980 as a
private limited company
under the name
style THAI STEEL
SERVICE CENTER LIMITED,
by Thai and
Japanese groups, to
import and distribute
of steel products.
It currently employs
approximate 400 staff.
Subject is a
subsidiary of Sumitomo
Corporation of Japan.
The subject received ISO 9002
certification for coil
processing center from
LRQA on May
27, 2000.
The subject’s registered
address is 47 Moo
7, Soi Watmahawongse, Poochasamingprai Rd., Phrapradaeng, Samutprakarn
10130, and this
is the subject’s
current operation address.
THE BOARD OF DIRECTORS
|
Name |
|
Nationality |
Age |
|
|
|
|
|
|
Mr. Hisahiro Maeda |
|
Japanese |
50 |
|
Mr. Keizo
Hashimoto |
|
Japanese |
51 |
|
Mr. Noriaki
Akaike |
|
Japanese |
41 |
|
Mr. Takeshi Kawanari |
|
Japanese |
36 |
AUTHORIZED PERSON
Any of the
above directors can
sign on behalf
of the subject
with company’s affixed.
MANAGEMENT
Mr. Keizo Hashimoto is
the President.
He is Japanese
nationality with the
age of 51
years old.
Mr. Wuthinan Aroonroj is
the General Manager & Factory Manager.
He is Thai
nationality.
Mr. Charnchai Luekhajornsak is
the Sales & Marketing Manager.
He is Thai
nationality.
BUSINESS OPERATIONS
The subject’s activities
are importer and
distributor of steel
products for automobile
& home appliance
industries such as
hot rolled steel
sheet, cold rolled
steel sheet, electric
galvanized steel sheet,
hot dip galvanized steel sheet, high dipped galvanized
alloy steel sheet,
high carbon steel
sheet, aluminized, alumi-alloy coated
steel sheet and etc.
The subject also
provides steel cutting,
rolling, bending and
modifying services.
PURCHASE
80% of its
products is imported
from Japan and
Republic of China,
and the rest
20% is purchased
locally.
MAJOR SUPPLIERS
Sumitomo Corporation : Japan
Thai Cold Rolled
Steel Sheet Public
Company Limited :
Thailand
Sahaviriya
Steel Industries Public
Company Limited : Thailand
Nisshin Steel Co.,
Ltd. : Japan
Sumitomo Metal Industries
Ltd. : Japan
JFE Steel Corporation : Japan
Nippon Steel Corporation : Japan
China Steel Corporation : Republic
of China
SALES [LOCAL]
100% of
its products is
sold locally by
wholesale to manufacturer
and end-users, in
automobile, home appliances,
furniture and construction
industries.
MAJOR CUSTOMERS
Honda Trading [Thailand] Co.,
Ltd. : Thailand
Nitco
Siam Co., Ltd. : Thailand
Toyota Tsusho [Thailand]
Co., Ltd. : Thailand
Thai Suzuki Motor
Co., Ltd. : Thailand
Thai Yamaha Group : Thailand
Thai Summit Autoparts Industry
Co., Ltd. : Thailand
Summit Autobody Co.,
Ltd. :
Thailand
Mitsubishi Electric Kan
Yong Watana Co.,
Ltd. : Thailand
Thai Toshiba Electric
Industrial Co., Ltd. : Thailand
Sumitomo Corporation Thailand
Ltd. : Thailand
SUBSIDIARY COMPANY
Sumisho Laser Welding [Thailand] Ltd.
Business Type :
Steel welding and
cutting service.
Investment :
99.99% of total
shares
LITIGATION
Bankruptcy and
Receivership
There are no
litigation on bankruptcy
and receivership cases
filed against the
subject found at
Legal Execution Department
for the past
five years.
Others
There are no
legal suits filed
against the subject
for the past
two years.
CREDIT
Sales are by
cash or on
the credits term
of 30-60 days.
Local bills are
paid by cash
or on the
credit term of
30-60 days.
Imports are by
L/C at sight
or T/T.
BANKING
Sumitomo Mitsui Banking
Corporation
[Bangkok Branch]
Kasikornbank Public
Co., Ltd.
[Head Office
: 1 Kasikorn Lane, Rajburana Rd., Rajburana , Bangkok
10140]
EMPLOYMENT
The subject employs
approximately 400 staff.
[office staff and
factory workers]
LOCATION DETAILS
The premise is
owned for operating
office, factory I &
warehouse in a
2 storey building
at the heading
address on 32,000
square meters plot
of land in
an industrial area.
Factory II is
located at 789/2
Moo 1, T. Nongkham, A. Sriracha, Cholburi 20110 on
36,800 square meters
plot of land.
COMMENT
Various industries claimed that domestic steel supply was insufficient
to meet demand, therefore imported steel could help ease supply shortage and
high prices in the local market. Steel importer would stay
in positive position as
current demand in domestic
market remains surge.
FINANCIAL INFORMATION
The capital was
initially registered at Bht. 28
million, divided into
28,000 shares of Bht. 1,000 each.
The capital was
increased later as
followings :
Bht. 32
million in June, 1987
Bht. 47
million in September, 1990
Bht. 94
million in January, 1992
Bht. 194
million on August
25, 1992
Bht. 216
million on February
19, 1999
The latest registered capital
was increased to Bht. 216 million,
divided into 216,000 shares of Bht. 1,000 each
with fully paid.
THE SHAREHOLDERS LISTED
WERE : [as of
April 25, 2012]
|
NAME |
HOLDING |
% |
|
|
|
|
|
Sumitomo Corporation Nationality: Japanese Address : 1-8-11,
Harumi, Suo-ku, Tokyo,
104-8610 Japanese |
182,279 |
84.39 |
|
Sumitomo Corporation Thailand
Ltd. Nationality: Thai Address : 87 Wireless Rd.,
Lumpini,
Pathumwan,
Bangkok |
33,720 |
15.61 |
Mr. Keizo Hashimoto
Nationality: Japanese
Address : 3-3-17
Seikimashinami, Nerima-ku, Tokyo, Japan |
1 |
- |
Total shareholders : 3
Share Structure [as
at April 25,
2012]
|
Nationality |
Shareholders |
No. of Share |
% Shares |
|
|
|
|
|
|
Thai |
1 |
33,720 |
15.61 |
|
Foreign-Japanese |
2 |
182,280 |
84.39 |
|
Total |
3 |
216,000 |
100.00 |
Mrs. Siriphen
Sukcharoenyingyong No.
3636
BALANCE SHEET [BAHT]
The latest financial figures published
as at December
31, 2011 &
2010 were:
ASSETS
|
Current Assets |
2011 |
2010 |
|
|
|
|
|
Cash in hand
& at Bank
|
20,413,103 |
11,409,523 |
|
Trade Accounts Receivable |
814,794,184 |
926,309,328 |
|
Receivable - Related
Companies |
1,754,475 |
888,356 |
|
Inventories |
1,541,376,927 |
891,259,105 |
|
Other Current Assets
|
9,1940,030 |
2,570,946 |
|
|
|
|
|
Total Current Assets
|
2,470,278,719 |
1,832,437,258 |
|
Investment in Subsidiary |
96,202,334 |
- |
|
Investment in Other
Equity Securities |
28,346,425 |
31,586,425 |
|
Fixed Assets |
509,053,931 |
422,307,822 |
|
Intangible Assets |
6,919,191 |
5,951,237 |
|
Other Assets |
2,236,069 |
1,485,000 |
|
Total Assets |
3,113,036,669 |
2,293,767,742 |
LIABILITIES &
SHAREHOLDERS' EQUITY [BAHT]
|
Current
Liabilities |
2011 |
2010 |
|
|
|
|
|
Short-term Loan from
Financial Institution |
1,362,000,000 |
500,000,000 |
|
Trade Accounts & Notes
Payable |
612,544,417 |
758,118,568 |
|
Accrued Income Tax |
449,697 |
20,050,977 |
|
Other Current Liabilities |
97,678,662 |
39,860,669 |
|
|
|
|
|
Total Current Liabilities |
2,072,672,776 |
1,318,030,214 |
|
Obligation for Employee
Benefits |
12,327,127 |
- |
|
Total Liabilities |
2,084,999,903 |
1,318,030,214 |
|
|
|
|
|
Shareholders' Equity |
|
|
|
|
|
|
|
Share capital : Baht 1,000
par value authorized, issued
and fully paid share
capital 216,000 shares |
216,000,000 |
216,000,000 |
|
|
|
|
|
Capital Paid |
216,000,000 |
216,000,000 |
|
Retained Earning Appropriated for
Statutory Reserve |
23,020,387 |
23,020,387 |
|
Unappropriated |
789,016,379 |
736,717,141 |
|
Total Shareholders' Equity |
1,028,036,766 |
975,737,528 |
|
Total Liabilities &
Shareholders' Equity |
3,113,036,669 |
2,293,767,742 |
PROFIT & LOSS ACCOUNT
|
Revenue |
2011 |
2010 |
|
|
|
|
|
Sales & Service
Income |
3,777,856,859 |
3,608,842,803 |
|
Other Income |
36,744,604 |
26,025,004 |
|
Gain on Exchange
Rate |
9,017,380 |
3,780,813 |
|
Total Revenues |
3,823,618,843 |
3,638,648,620 |
|
Expenses |
|
|
|
|
|
|
|
Cost of Goods
Sold & Service |
3,527,776,907 |
3,301,837,258 |
|
Selling Expenses |
61,576,383 |
65,636,268 |
|
Administrative Expenses |
112,199,521 |
75,858,503 |
|
Total Expenses |
3,701,552,811 |
3,443,332,029 |
|
|
|
|
|
Profit before Financial
Cost & Income
Tax |
122,066,032 |
195,316,591 |
|
Financial Cost |
[27,890,834] |
[6,415,838] |
|
Income Tax |
[31,481,423] |
[52,921,580] |
|
|
|
|
|
Net Profit / [Loss] |
62,693,775 |
135,979,173 |
FINANCIAL ANALYSIS
|
ITEM |
UNIT |
2011 |
2010 |
|
|
|
|
|
|
LIQUIDITY RATIO |
|
|
|
|
CURRENT RATIO |
TIMES |
1.19 |
1.39 |
|
QUICK RATIO |
TIMES |
0.40 |
0.71 |
|
|
|
|
|
|
ACTIVITY RATIO |
|
|
|
|
FIXED ASSETS TURNOVER |
TIMES |
7.42 |
8.55 |
|
TOTAL ASSETS TURNOVER |
TIMES |
1.21 |
1.57 |
|
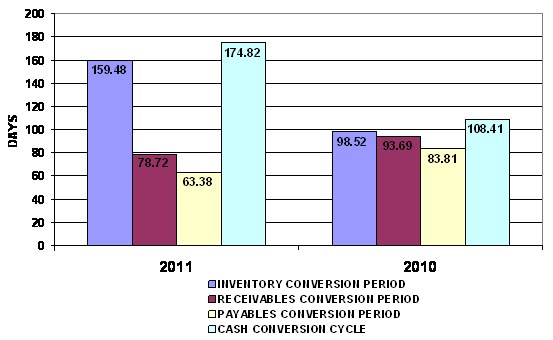
INVENTORY CONVERSION PERIOD |
DAYS |
159.48 |
98.52 |
|
INVENTORY TURNOVER |
TIMES |
2.29 |
3.70 |
|
RECEIVABLES CONVERSION PERIOD |
DAYS |
78.72 |
93.69 |
|
RECEIVABLES TURNOVER |
TIMES |
4.64 |
3.90 |
|
PAYABLES CONVERSION PERIOD |
DAYS |
63.38 |
83.81 |
|
CASH CONVERSION CYCLE |
DAYS |
174.82 |
108.41 |
|
|
|
|
|
|
PROFITABILITY
RATIO |
|
|
|
|
COST OF GOODS SOLD |
% |
93.38 |
91.49 |
|
SELLING & ADMINISTRATION |
% |
4.60 |
3.92 |
|
INTEREST |
% |
0.74 |
0.18 |
|
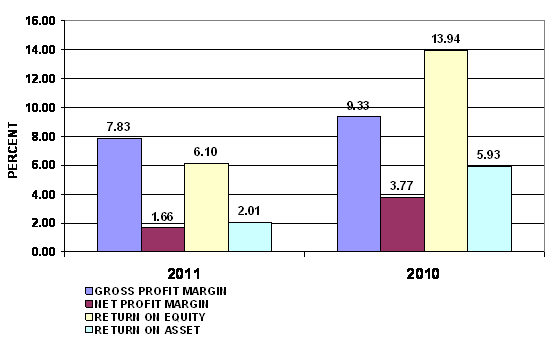
GROSS PROFIT MARGIN |
% |
7.83 |
9.33 |
|
NET PROFIT MARGIN BEFORE EX. ITEM |
% |
3.23 |
5.41 |
|
NET PROFIT MARGIN |
% |
1.66 |
3.77 |
|
RETURN ON EQUITY |
% |
6.10 |
13.94 |
|
RETURN ON ASSET |
% |
2.01 |
5.93 |
|
EARNING PER SHARE |
BAHT |
290.25 |
629.53 |
|
|
|
|
|
|
LEVERAGE RATIO |
|
|
|
|
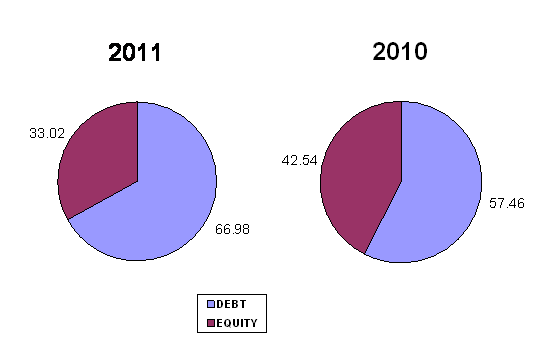
DEBT RATIO |
TIMES |
0.67 |
0.57 |
|
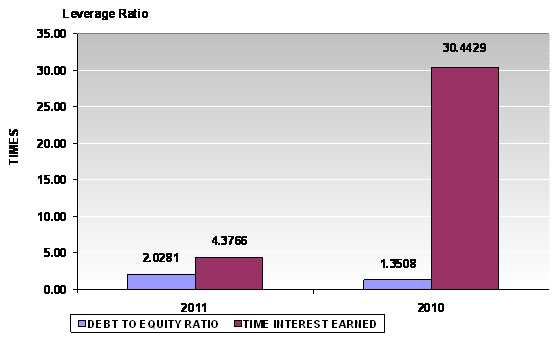
DEBT TO EQUITY RATIO |
TIMES |
2.03 |
1.35 |
|
TIME INTEREST EARNED |
TIMES |
4.38 |
30.44 |
|
|
|
|
|
|
ANNUAL GROWTH |
|
|
|
|
SALES GROWTH |
% |
4.68 |
|
|
OPERATING PROFIT |
% |
(37.50) |
|
|
NET PROFIT |
% |
(53.89) |
|
|
FIXED ASSETS |
% |
20.54 |
|
|
TOTAL ASSETS |
% |
35.72 |
|
PROFITABILITY
RATIO
|
Gross Profit Margin |
7.83 |
Impressive |
Industrial Average |
6.34 |
|
Net Profit Margin |
1.66 |
Impressive |
Industrial Average |
1.14 |
|
Return on Assets |
2.01 |
Impressive |
Industrial Average |
1.22 |
|
Return on Equity |
6.10 |
Impressive |
Industrial Average |
2.51 |
Gross Profit Margin used to assess a firm's financial health by
revealing the proportion of money left over from revenues after accounting for the
cost of goods sold. Gross profit margin serves as the source for paying
additional expenses and future savings. Gross Profit Margin is 7.83%. When
compared with the industry average, the ratio of the company was higher. This
indicated that company was more profitable than the same industry.
Net Profit Margin is the indicator of the company's efficiency in that
net profit takes into consideration all expenses of the company. A low profit margin
indicates a low margin of safety, higher risk that a decline in sales will
erase profits and result in a net loss. Net Profit Margin ratio is 1.66%,
higher figure when compared with those of its average competitors in the same
industry, indicated that business was an efficient operator in a dominant
position within its industry.
Return on Assets measures how efficiently profits are being generated
from the assets employed in the business when compared with the ratios of firms
in a similar business. A low ratio in comparison with industry averages
indicates an inefficient use of business assets. Return on Assets ratio is
2.01%, higher figure when compared with those of its average competitors in the
same industry, indicated that business was an efficient profit in a dominant
position within its industry.
Return on Equity indicates how profitable a company is by comparing its
net income to its average shareholders' equity, ROE measures how much the
shareholders earned for their investment in the company. Return on Equity ratio
is 6.1%, higher figure when compared with those of its average competitors in
the same industry, indicated that business was an efficient profit in a
dominant position within its industry.
Trend of the
average competitors in the same industry for last 5 years
Return on Assets Downtrend
Return on Equity Downtrend
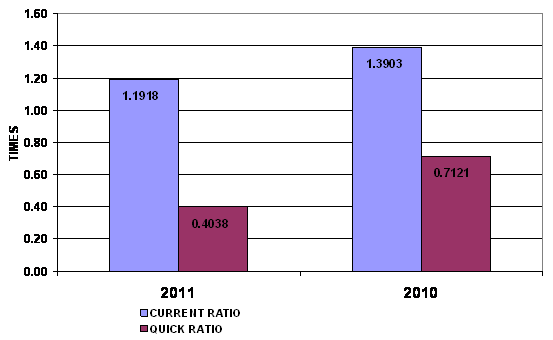
LIQUIDITY RATIO
|
Current Ratio |
1.19 |
Impressive |
Industrial Average |
1.03 |
|
Quick Ratio |
0.40 |
|
|
|
|
Cash Conversion Cycle |
174.82 |
|
|
|
The Current Ratio is to ascertain whether a company's short-term assets
are readily available to pay off its short-term liabilities. The company's
figure is 1.19 times in 2011, decrease from 1.39 times, then it is generally considered
to have good short-term financial strength. When compared with the industry
average, the ratio of the company was higher, indicated that company was an
efficient operator in a dominant position within its industry.
The Quick Ratio is a liquidity indicator that further refines the
current ratio by measuring the amount of the most liquid current assets there
are to cover current liabilities. The company's figure is 0.4 times in 2011,
decrease from 0.71 times, then the company has not enough current assets that
presumably can be quickly converted to cash for pay financial obligations.
The Cash Conversion Cycle measures the number of days a company's cash
is tied up in the production and sales process of its operations and the
benefit from payment terms from its creditors. It meant the company could
survive when no cash inflow was received from sale for 175 days.
Trend of the
average competitors in the same industry for last 5 years
Current Ratio Downtrend
LEVERAGE RATIO
|
Debt Ratio |
0.67 |
Acceptable |
Industrial Average |
0.65 |
|
Debt to Equity Ratio |
2.03 |
Risky |
Industrial Average |
1.74 |
|
Times Interest Earned |
4.38 |
Impressive |
Industrial Average |
1.37 |
Debt to Equity Ratio a measurement of how much suppliers, lenders, creditors
and obligors have committed to the company versus what the shareholders have
committed. A lower the percentage means that the company is using less leverage
and has a stronger equity position.
Times Interest Earned measuring a company's ability to meet its debt
obligations. Ratio is 4.38 higher than 1, so the company can pay interest
expenses on outstanding debt.
Debt Ratio shows the proportion of a company's assets which are financed
through debt. The company's figure is 0.67 greater than 0.5, most of the
company's assets are financed through debt.
Trend of the
average competitors in the same industry for last 5 years
Debt Ratio Downtrend
Times Interest Earned Downtrend
ACTIVITY RATIO
|
Fixed Assets Turnover |
7.42 |
Impressive |
Industrial Average |
2.83 |
|
Total Assets Turnover |
1.21 |
Satisfactory |
Industrial Average |
1.24 |
|
Inventory Conversion Period |
159.48 |
|
|
|
|
Inventory Turnover |
2.29 |
Acceptable |
Industrial Average |
3.78 |
|
Receivables Conversion Period |
78.72 |
|
|
|
|
Receivables Turnover |
4.64 |
Satisfactory |
Industrial Average |
5.84 |
|
Payables Conversion Period |
63.38 |
|
|
|
Trend of the
average competitors in the same industry for last 5 years
Fixed Assets Turnover Downtrend
Total Assets Turnover Downtrend
Inventory Turnover Downtrend
Receivables Turnover Downtrend
FOREIGN EXCHANGE RATES
|
Currency |
Unit
|
Indian Rupees |
|
US Dollar |
1 |
Rs.55.70 |
|
UK Pound |
1 |
Rs.87.55 |
|
Euro |
1 |
Rs.68.85 |
INFORMATION DETAILS
|
Report Prepared
by : |
MNL |
RATING EXPLANATIONS
|
RATING |
STATUS |
PROPOSED CREDIT LINE |
|
|
>86 |
Aaa |
Possesses an extremely sound financial base with the strongest capability
for timely payment of interest and principal sums |
Unlimited |
|
71-85 |
Aa |
Possesses adequate working capital. No caution needed for credit
transaction. It has above average (strong) capability for payment of interest
and principal sums |
Large |
|
56-70 |
A |
Financial & operational base are regarded healthy. General unfavourable factors will not cause fatal effect.
Satisfactory capability for payment of interest and principal sums |
Fairly Large |
|
41-55 |
Ba |
Overall operation is considered normal. Capable to meet normal
commitments. |
Satisfactory |
|
26-40 |
B |
Capability to overcome financial difficulties seems comparatively
below average. |
Small |
|
11-25 |
Ca |
Adverse factors are apparent. Repayment of interest and principal sums
in default or expected to be in default upon maturity |
Limited with
full security |
|
<10 |
C |
Absolute credit risk exists. Caution needed to be exercised |
Credit not
recommended |
|
---- |
NB |
New Business |
---- |
This score serves as a reference to assess SC’s credit risk
and to set the amount of credit to be extended. It is calculated from a
composite of weighted scores obtained from each of the major sections of this report.
The assessed factors and their relative weights (as indicated through %) are as
follows:
Financial
condition (40%) Ownership
background (20%) Payment
record (10%)
Credit history
(10%) Market trend
(10%) Operational
size (10%)
This report is issued at your request without any
risk and responsibility on the part of MIRA INFORM PRIVATE LIMITED (MIPL)
or its officials.