MIRA INFORM REPORT
|
Report Date : |
31.08.2012 |
IDENTIFICATION DETAILS
|
Name : |
EL Corte Inglesh S A |
|
|
|
|
Registered Office : |
Calle Hermosilla, 112, 28009 Madrid |
|
|
|
|
Country : |
Spain |
|
|
|
|
Financials (as on) : |
28.02.2011 |
|
|
|
|
Date of Incorporation : |
01.01.1940 |
|
|
|
|
Legal Form : |
Joint-Stock Company |
|
|
|
|
Line of Business : |
|
|
|
|
|
No. of Employees
: |
RATING & COMMENTS
|
MIRA’s Rating : |
Ba |
|
RATING |
STATUS |
PROPOSED CREDIT LINE |
|
|
41-55 |
Ba |
Overall operation is considered normal. Capable to meet normal
commitments. |
Satisfactory |
|
Status : |
Satisfactory |
|
|
|
|
Payment Behaviour : |
No Complaints |
|
|
|
|
Litigation : |
Clear |
NOTES:
Any query related to this report can be made
on e-mail : infodept@mirainform.com
while quoting report number, name and date.
ECGC Country Risk Classification List – September 30th, 2011
|
Country Name |
Previous Rating (30.06.2011) |
Current Rating (30.09.2011) |
|
Spain |
a2 |
a2 |
|
Risk Category |
ECGC
Classification |
|
Insignificant |
A1 |
|
Low |
A2 |
|
Moderate |
B1 |
|
High |
B2 |
|
Very High |
C1 |
|
Restricted |
C2 |
|
Off-credit |
D |
SPAIN - ECONOMIC OVERVIEW
spain's mixed capitalist economy is the 13th largest in the
world, and its per capita income roughly matches that of Germany and France.
However, after almost 15 years of above average GDP growth, the Spanish economy
began to slow in late 2007 and entered into a recession in the second quarter of
2008. GDP contracted by 3.7% in 2009, ending a 16-year growth trend, and by
another 0.1% in 2010, before turning positive in 2011, making Spain the last
major economy to emerge from the global recession. The reversal in Spain''s
economic growth reflected a significant decline in construction amid an
oversupply of housing and falling consumer spending, while exports actually
have begun to grow. Government efforts to boost the economy through stimulus
spending, extended unemployment benefits, and loan guarantees did not prevent a
sharp rise in the unemployment rate, which rose from a low of about 8% in 2007
to over 20% in 2011. The government budget deficit worsened from 3.8% of GDP in
2008 to 9.2% of GDP in 2010, more than three times the euro-zone limit. Madrid
cut the deficit to 8.5% of GDP in 2011, a larger deficit than the 6% target
negotiated between Spain and the EU. Spain''s large budget deficit and poor
economic growth prospects have made it vulnerable to financial contagion from
other highly-indebted euro zone members despite the government''s efforts to
cut spending, privatize industries, and boost competitiveness through labor
market reforms. Spanish banks'' high exposure to the collapsed domestic
construction and real estate market also poses a continued risk for the sector.
The government oversaw a restructuring of the savings bank sector in 2010, and
provided some $15 billion in capital to various institutions. Investors remain
concerned that Madrid may need to bail out more troubled banks. The Bank of
Spain, however, is seeking to boost confidence in the financial sector by
pressuring banks to come clean about their losses and consolidate into stronger
groups.
|
Source
: CIA |
Company name
EL CORTE INGLES SA
CIF/NIF: A28017895
Company situation: Active
INFORMATION OF THE REQUEST
Data of your
request
|
|
|
Registered Name EL CORTE INGLES
SA Complete Address HERMOSILLA,
112 28 Request reason Indicar
nombres de los productos que comercializa. |
Answer to the data
in your request
The data of your request have been confirmed and are correct.
Other Complementary Information
Is the biggest department store group in Europe and ranks fourth
worldwide. EL CORTE INGLES is Spain’s only remaining department store chain, as
well as owner of several associated businesses, such as: Hipercor -
hypermarkets Supercor and OpenCor - supermarkets Bricor - Home and DIY chain
Sfera - Fashion chain Viajes El Corte Ingles - Travel agency Telecor -
Telecommunications Informatica El Corte Ingles - Business IT services Centro de
Seguros, Correduría de Seguros and Grupo de Seguros El Corte Ingles - Insurance
and financial services Editorial Centro de Estudios Ramón Areces - Educational
publishing
EXECUTIVE SUMMARY
Identification
Current Business Name: EL CORTE INGLES SA
Commercial name: EMIDIO TUCCI; GREEN COAST ; YERA ; EMIDIO
TUCCI
Other names: YES
Current Address: CALLE HERMOSILLA, 112
Branches: 731
Telephone number: 913090988 Fax: 913093433
URL: www.elcorteingles.es
, www.lagaliciadeonega.elcorteingles.es
, www.elcorteinglesdeconews.es
Corporate e-mail: administracion@elcorteingles.es
Trade Risk
Incidents: YES
R.A.I.: NO
Financial
Information
Balance sheet latest sales (2011): 11.050.024.000,00 € (Commercial Registry)
Result: 375.017.000 €
Total Assets: 12.842.209.000 €
Share capital: 486.864.000,00 €
Employees: 55.760
Listed on a Stock Exchange: NO
Commercial
Information
Incorporation date: 02/01/1952
Activity: Retail sale of industrial products
(except foodstuff)
NACE 2009 CODE: 4719
International Operations: Imports
Corporate
Structure
President:
Participations: 35
Other
Complementary Information
Latest filed accounts in the Commercial Registry: 2011
Latest act published in BORME: 18/01/2012 Appointments
Latest press article: 02/03/2012 CINCO
DIAS (FINANCIAL DATA)
Bank Entities: There are
The date when this report was last updated is 06/03/2012.
The information contained in this report has been investigated and
contrasted on 26/12/2011
Rating Explication
Financial Situation
·
La evolución de las ventas ha sido negativa no así
la de los resultados que ha sido estable.
·
Empresa perteneciente a un sólido grupo de
empresas.
·
La situación financiera de la compañía es normal.
·
La opinión del auditor sobre las últimas cuentas ha
sido favorable.
·
La evolución de la situación financiera de la
sociedad ha sido estable.
Company Structure
·
The company’s capitalization degree determines that
its structure is sound.
·
The company’s size is big depending on
its sales volume.
·
The employees evolution has been negative.
Performance and Incidences
·
The available information indicates that the
company does not have payment incidences.
·
He have detected recent legal actions or claims
from the Administration against this company
Accounts Filing
·
The company files regularly its accounts.
Reasons of the
last outstanding calculation in the note
|
DATE |
CHANGE |
RESULTING NOTE |
EVENT |
|
22/01/2012 |
Equal |
11 |
•
There has been a variation in the affected
parties of the company’s non-payments information. |
|
15/01/2012 |
Equal |
11 |
•
There has been a variation in the affected
parties of the company’s non-payments information. |
|
09/01/2012 |
Equal |
11 |
•
Variation in the rating system with regards to
legal incidences information. |
|
08/01/2012 |
Equal |
11 |
•
There has been a variation in the affected parties
of the company’s non-payments information. |
|
01/01/2012 |
Equal |
11 |
•
There has been a variation in the affected
parties of the company’s non-payments information. |
Summary
LEGAL ACTIONS: No legal actions registered
ADMINISTRATIVE CLAIMS: 9 ( Last:13/12/2011 , first:
13/11/2009 )
|
|
|
|
|
With the Social Security: |
7 |
|
|
With the Tax Authorities: |
0 |
|
|
With Other Official bodies: |
2 |
|
AFFECTED BY:
21 Company / Companies in Insolvency Proceedings.
Latest
Administrative Claims
figures expressed in €
WITH THE SOCIAL SECURITY.
Notifications
|
DATE |
ORGANIZATION |
AMOUNT |
|
30/11/2009 |
CENTRAL TREASURY FOR SOCIAL SECURITY DIRECCION PROVINCIAL DE
TRABAJO Y SEGURIDAD SOCIAL |
2.568,79 |
|
30/11/2009 |
CENTRAL TREASURY FOR SOCIAL SECURITY DIRECCION PROVINCIAL DE
TRABAJO Y SEGURIDAD SOCIAL |
2.661,42 |
|
13/11/2009 |
CENTRAL TREASURY FOR SOCIAL SECURITY DIRECCION PROVINCIAL DE
TRABAJO Y SEGURIDAD SOCIAL |
1.669,49 |
There are 7 administrative claims with the Social Security registered
WITH OTHER OFFICIAL BODIES.
Seizures
|
DATE |
ORGANIZATION |
AMOUNT |
|
13/12/2011 |
DEPUTATION/ DELEGATION DE CADIZ |
|
|
23/02/2010 |
TOWN/ CITY HALL DE SEVILLA |
|
There are 2 administrative claims with Other Official bodies registered
Detail of the
Latest Administrative Claims
figures expressed in €
Seizures
WITH OTHER OFFICIAL BODIES.
Phase: SEIZURE
Organization: DEPUTATION/ DELEGATION DE CADIZ
Concept: Other debts
Date of the claim: 13/12/2011
Source: Published in the Gazette of CADIZ, on 05/01/2012, page 5
figures expressed in €
Seizures
WITH OTHER OFFICIAL BODIES.
Phase: SEIZURE
Organization: TOWN/ CITY HALL DE SEVILLA
Concept: Other debts
Date of the claim: 23/02/2010
Source: Published in the Gazette of SEVILLA Appendix 03, on 05/04/2010, page 278
R.A.I.
COMPANY NOT REGISTERED IN THE R.A.I.
This company is not registered in the Disputed Bills register (R.A.I.)
DATE AND TIME OF THE CONSULTATION
02/03/2012 14:03:19
Information from the Registro de Aceptaciones Impagados (RAI)- Disputed
Bills register.
It can only be used for information legitimate needs of the consulting
party, in accordance with its social or business activity, in order to grant a
credit or the monitoring or control of the already granted credits and can not
be transmitted or communicated to thirds, nor copied, duplicated, reproduced
nor implemented to any database , owned or external, or reused it in anyway,
direct or indirectly.
FINANCIAL ELEMENTS AND SECTORIAL COMPARATIVE
FINANCIAL ELEMENTS
Figures given in thousands €
|
|
28/02/2011 (12) BALANCE SHEET |
% ASSETS |
28/02/2010 (12) BALANCE SHEET |
% ASSETS |
28/02/2009 (12) BALANCE SHEET |
% ASSETS |
|
ASSETS |
|
|
|
|
|
|
|
A) NON CURRENT ASSETS |
9.961.668,00 |
77,57 |
9.969.157,00 |
79,34 |
9.686.231,00 |
78,17 |
|
B) CURRENT ASSETS |
2.880.541,00 |
22,43 |
2.596.145,00 |
20,66 |
2.704.339,00 |
21,83 |
|
LIABILITIES |
|
|
|
|
|
|
|
A) NET WORTH |
5.835.779,00 |
45,44 |
5.542.303,00 |
44,11 |
5.313.003,00 |
42,88 |
|
B) NON CURRENT LIABILITIES |
2.863.558,00 |
22,30 |
3.090.268,00 |
24,59 |
2.623.345,00 |
21,17 |
|
C) CURRENT LIABILITIES |
4.142.872,00 |
32,26 |
3.932.731,00 |
31,30 |
4.454.222,00 |
35,95 |
Profit and Loss
Account Analysis ![]()
Figures given in thousands €
|
|
28/02/2011 (12) BALANCE SHEET |
% NET TURNOVER |
28/02/2010 (12) BALANCE SHEET |
% NET TURNOVER |
28/02/2009 (12) BALANCE SHEET |
% NET TURNOVER |
|
SALES |
11.050.024,00 |
|
11.201.939,00 |
|
11.555.893,00 |
|
|
GROSS MARGIN |
3.633.993,00 |
32,89 |
3.611.048,00 |
32,24 |
3.686.082,00 |
31,90 |
|
EBITDA |
666.170,00 |
6,03 |
721.915,00 |
6,44 |
718.464,00 |
6,22 |
|
EBIT |
304.964,00 |
2,76 |
364.899,00 |
3,26 |
394.343,00 |
3,41 |
|
NET RESULT |
375.017,00 |
3,39 |
367.073,00 |
3,28 |
363.046,00 |
3,14 |
|
EFFECTIVE TAX RATE (%) |
8,83 |
0,00 |
5,40 |
0,00 |
11,86 |
0,00 |
COMPARATIVE SECTOR
ANALYSIS
Values table
Figures expressed in %
|
|
COMPANY (2011) |
SECTOR |
DIFFERENCE |
|
|
|
BALANCE SHEET ANALYSIS: % on the total
assets |
|
|
|
|
|
|
ASSETS |
|
|
|||
|
A) NON CURRENT ASSETS |
77,57 |
84,76 |
-7,19 |
|
|
|
A) CURRENT ASSETS |
22,43 |
15,24 |
7,19 |
|
|
|
LIABILITIES |
|
|
|||
|
A) NET WORTH |
45,44 |
85,10 |
-39,66 |
|
|
|
B) NON CURRENT LIABILITIES |
22,30 |
2,83 |
19,47 |
|
|
|
C) CURRENT LIABILITIES |
32,26 |
12,07 |
20,19 |
|
|
|
|
|
|
|
|
|
|
|
COMPANY (2011) |
SECTOR |
DIFFERENCE |
|
|
|
PROFIT AND LOSS ACCOUNT ANALYSIS: % on the total
operating income |
|
|
|
|
|
|
SALES |
95,49 |
97,44 |
-1,95 |
|
|
|
GROSS MARGIN |
31,40 |
31,93 |
-0,53 |
|
|
|
EBITDA |
5,76 |
7,33 |
-1,57 |
|
|
|
EBIT |
2,64 |
4,15 |
-1,52 |
|
|
|
NET RESULT |
3,24 |
3,04 |
0,21 |
|
|
Sector Composition
Compared sector (NACE 2009): 4719
Number of companies: 6
Size (sales figure): > 40,000,000.00 Euros
OTHER DATA FROM
THE ANNUAL FINANCIAL REPORT
Results
Distribution
Source: annual financial report 2011
Figures given in €
|
DISTRIBUTION BASE |
APPLICATION A |
||
|
Profit and Loss Account Balance |
375.017.112,30 |
Legal Reserve |
0,00 |
|
Carry over |
0,00 |
Goodwill reserve |
0,00 |
|
Voluntary reserves |
0,00 |
Special reserves |
0,00 |
|
Other reserves disposable at will |
0,00 |
Voluntary reserves |
331.266.842,10 |
|
Total of Amounts to be distributed |
375.017.112,30 |
Dividends |
43.750.270,20 |
|
|
|
Carry over and others |
0,00 |
|
|
|
Compensation of previous exercises losses |
0,00 |
|
|
|
Application total |
375.017.112,30 |
Auditing
Source: filing of annual financial statement 2011
Auditors’ opinion: FAVOURABLE
Auditor: DELOITTE S.L.
Auditing fees: 703.000,00 €
Facts subsequent
to the closing
Source: Annual financial report 2011
Como hecho de mayor relevancia ocurrido después del cierre del
ejercicio, destaca la inauguración del Centro Comercial Marineda(A Coruña) el
14 de abril de 2011
company ADDRESSES
Current Legal Seat Address:
CALLE HERMOSILLA, 112
28009 MADRID
Previous Seat Address:
CALLE PRECIADOS 3
28013 MADRID
|
STREET |
POSTAL CODE |
TOWN |
PROVINCE |
|
CALLE LA PAZ, 2 |
01004 |
VITORIA-GASTEIZ |
Araba/Álava |
|
PLAZA ALTOZANO, 6 |
02001 |
ALBACETE |
Albacete |
|
CALLE CABA (4 6), 2 |
02001 |
ALBACETE |
Albacete |
|
CL HELLIN. C/V A AV. DE ESPAÑA S/N |
02002 |
ALBACETE |
Albacete |
|
CALLE HELLIN |
|
ALBACETE |
Albacete |
|
CALLE IRIS, 8 |
02005 |
ALBACETE |
Albacete |
|
CALLE MARTIRES, 5 |
02630 |
LA RODA |
Albacete |
|
CALLE TESIFONTE GALLEGO, 1 |
02002 |
ALBACETE |
Albacete |
|
CALLE TINTE, 9 |
02001 |
ALBACETE |
Albacete |
|
CALLE TOLEDO, S/N |
02520 |
CHINCHILLA DE MONTE-ARAGON |
Albacete |
There are 731 branches registered
|
STREET |
POSTAL CODE |
TOWN |
PROVINCE |
|
AVENIDA CID, 22 |
46018 |
VALENCIA |
Valencia |
|
CALLE DE COLON, 1 - AV MEDITERRANEO 26 |
46910 |
SEDAVI |
Valencia |
|
PLAZA SALT |
17005 |
GIRONA |
Gerona |
|
CALLE ISAAC ALBENIZ (SAN ANTON), 9 |
30009 |
MURCIA |
Murcia |
|
CALLE DON JUAN DE BORBON |
30833 |
MURCIA |
Murcia |
There are 118 former branches registered
CORPORATE STRUCTURE
ADMINISTRATIVE LINKS
|
|
|
|
|
|
Distribution of the administration board |
|
|
Governing body : 19 members (latest change:
16/11/2010) Other Positions : 227 (latest change: 05/01/2012) Auditor : 2 (latest change: 22/11/2011) Operative Board Members : 4 (latest change: 30/08/2010) Non-current positions : 91 (latest change: 07/12/2011) |
|
|

Main Board
members, Directors and Auditor ![]()
Governing body
|
POSITION |
NAME AND SURNAME |
DATE APPOINTMENT |
|
PRESIDENT |
ALVAREZ ALVAREZ, ISIDORO |
16/10/2008 |
|
VICE-PRESIDENT |
CORPORACION CESLAR SL |
25/08/2002 |
|
MANAGING DIRECTOR |
CARTERA MANCOR S.L REP GARCIA PENA PALOMA |
16/10/2008 |
|
MANAGING DIRECTOR |
DE MINGO CONTRERAS, JUAN MANUEL |
16/10/2008 |
|
MANAGING DIRECTOR |
HERMOSO ARMADA, JUAN |
16/10/2008 |
|
MANAGING DIRECTOR |
LASAGA MUNARRIZ, FLORENCIO |
16/10/2008 |
|
MANAGING DIRECTOR |
MARTINEZ ECHAVARRIA, ANSELMO CARLOS |
16/10/2008 |
|
MEMBER OF THE BOARD |
CARTERA MANCOR SL REP GARCIA PENA PALOMA |
29/08/2010 |
|
MEMBER OF THE BOARD |
DEL NOGAL ROPERO, JOSE LEOPOLDO |
16/11/2010 |
|
|
|
|
Auditor
|
POSITION |
NAME AND SURNAME |
DATE APPOINTMENT |
|
AUDITOR |
DELOITTE SL |
10/11/2010 |
|
AUDITOR |
DELOITTE SL |
22/11/2011 |
There are 248 board members, directors and auditors registered
Board members remuneration
Source: Annual
financial report 2010
Board
members remuneration: 12.673.000,00 €
|
POSITION |
NAME AND SURNAME |
|
Financial Manager |
MARTINEZ ECHEVARRIA, CARLOS |
|
Human Resources Director |
QUINTANA, CARLOS |
|
Purchases Director |
DEL NOGAL ROPERO, LEOPOLDO |
|
Advertising Director |
AGUADO, JAVIER |
FINANCIAL LINKS
|
|
BUSINESS NAME |
TAX NUMBER/COUNTRY |
% |
|
DATE REP. |
|
|
ALVAREZ ALVAREZ ISIDORO |
|
15,00 |
|
01/03/1994 |
|
|
INGONDEL SL |
B80702079 |
9,00 |
LA GACETA |
13/05/2008 |
|
|
HERMANOS LUIS Y CELESTINO ARECES |
|
8,00 |
|
01/03/1994 |
|
|
EL CORTE INGLES SA |
A28017895 |
3,97 |
COMMERCIAL REGISTRY |
28/02/2011 |
|
|
EMPLEADOS EL CORTE INGLES |
|
2,00 |
|
01/03/1994 |
|
|
ARECES FUENTES MARIA JESUS |
|
0,71 |
COMMERCIAL REGISTRY |
29/02/2008 |
|
|
ARECES FUENTES CESAR CARLOS |
|
0,71 |
COMMERCIAL REGISTRY |
29/02/2008 |
|
|
ARECES FUENTES RAMON |
|
0,71 |
COMMERCIAL REGISTRY |
29/02/2008 |
|
|
ARECES FUENTES ROSARIO |
|
0,71 |
COMMERCIAL REGISTRY |
29/02/2008 |
|
|
LASAGA MUNARRIZ FLORENCIO |
|
Indef. |
|
01/03/1994 |
There are 15 direct financial links through shareholders
registered
![]() Company with rating inferior to 7
Company with rating inferior to 7
|
|
BUSINESS NAME |
TAX NUMBER/COUNTRY |
% |
SOURCE |
DATE REP. |
|
|
PATRIMONIAL TRUST SL (EXTINGUIDA) |
B80095458 |
Indef. |
COMMERCIAL REGISTRY |
27/02/2004 |
|
|
GONZALEZ FERNANDEZ DAVID |
|
Indef. |
LA GACETA |
01/09/2003 |
![]() Company with rating inferior to 7
Company with rating inferior to 7
|
|
BUSINESS NAME |
TAX NUMBER/COUNTRY |
% |
SOURCE |
DATE REP. |
|
|
CENTRO DE SEGUROS Y SERVICIOS CORREDURIA DE SEGUROS SA GRUPO DE
SEGUROS EL CORTE INGLES |
A28128189 |
100,00 |
OWN SOURCES |
06/03/2012 |
|
|
TIENDAS DE CONVENIENCIA SA |
A78476389 |
100,00 |
OWN SOURCES |
27/02/2012 |
|
|
SUPERCOR SA |
A78476397 |
100,00 |
OWN SOURCES |
23/02/2012 |
|
|
HIPERCOR SA |
A28642866 |
100,00 |
OWN SOURCES |
30/01/2012 |
|
|
BRICOR SA |
A50319771 |
100,00 |
OWN SOURCES |
25/01/2012 |
|
|
TOURMUNDIAL OPERADORES SA |
A28490910 |
100,00 |
OWN SOURCES |
25/01/2012 |
|
|
CONSTRUCCION PROMOCIONES E INSTALACIONES SAU |
A28436483 |
100,00 |
OWN SOURCES |
09/01/2012 |
|
|
SFERA JOVEN SA |
A83036137 |
100,00 |
OWN SOURCES |
03/10/2011 |
|
|
VIAJES EL CORTE INGLES SA |
A28229813 |
100,00 |
OWN SOURCES |
29/07/2011 |
|
|
OPTICA 2000 SL |
B08422941 |
100,00 |
OWN SOURCES |
03/06/2011 |
There are 35 direct financial links through participations registered
|
|
BUSINESS NAME |
SHAREHOLDER |
TAX NUMBER/COUNTRY |
% |
SOURCE |
DATE REP. |
|
|
BRICOR S.A. - SUCURSAL EM PORTUGAL |
BRICOR SA |
PORTUGAL |
100,00 |
OWN SOURCES |
22/02/2012 |
You can obtain business information of foreign companies at the
page D&B INTERNATIONAL
|
|
BUSINESS NAME |
TAX NUMBER/COUNTRY |
% |
SOURCE |
DATE REP. |
|
|
CADENACOR SA (EXTINGUIDA) |
A83064295 |
100,00 |
EL MUNDO DEL SIGLO VEINTIUNO |
23/11/2010 |
|
|
PARTICIPACIONES SA (EXTINGUIDA) |
A28707818 |
100,00 |
EL MUNDO DEL SIGLO VEINTIUNO |
23/11/2010 |
|
|
OPTICAS EL CORTE INGLES SA (EXTINGUIDA) |
A83709634 |
100,00 |
EL MUNDO DEL SIGLO VEINTIUNO |
09/11/2005 |
![]() Company with rating inferior to 7
Company with rating inferior to 7
POTENTIAL LINKS
Search Criterion: ”EL CORTE INGLES”
|
COMPANY FOUND |
PROVINCE |
|
EL CORTE INGLES SA |
MADRID |
|
INFORMATICA EL CORTE INGLES SA |
MADRID |
|
VIAJES EL CORTE INGLES SA |
MADRID |
|
SEGUROS EL CORTE INGLES VIDA PENSIONES Y REASEGUROS SA |
MADRID |
|
FINANCIERA EL CORTE INGLES E F C SA |
MADRID |
Search Criterion: ”EL CORTE INGLES”
URL: www.elcorteingles.es
El Corte Inglés: Electrónica, informática, hogar, supermercado ... El Corte
Inglés. Comprar electrónica, informática, hogar, supermercado, moda, deportes,
viajes, libros, música, películas, entradas, juguetes.
URL: es.wikipedia.org
El Corte Inglés - Wikipedia, la enciclopedia libre El grupo El
Corte Inglés es el primer grupo de distribución de España y el número 40 del
mundo por volumen de ventas y está compuesto por empresas de ...
BUSINESS INFORMATION
Incorporation date: 02/01/1952
Establishment date: 01/01/1940
Founder’s Name: RAMON ARECES Y CESAR RODRIGUEZ
Activity: Retail sale of industrial products (except
foodstuff)
NACE 2009 CODE: 4719
NACE 2009 Activity: Other retail sale in non-specialised stores
Business: LA REALIZACION DE LAS ACTIVIDADES PROPIAS DEL
COMERCIO INTEGRADO EN GRANDES SUPERFICIES, ABARCANDO LA COMERCIALIZACION DE
TODA CLASE DE PRODUCTOS DE CONSUMO EN SU MAS AMPLIA VARIEDAD, MOBILIARIO,
ARTICULOS DE REGALO, ECT
Environmental information: YES (Page 86) Annual
financial report 2011
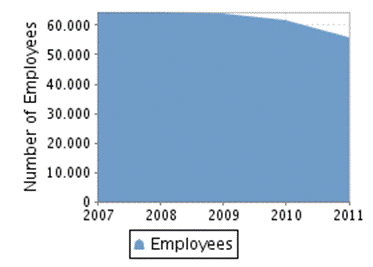
Latest employees figure: 55.760 (2011)
% of fixed employees: 91,45%
% of temporary employees: 8,55%
% of men: 37,24%
% of women: 62,76%
Employees
evolution
|
|
|
|
Source: Annual financial report 2011
|
CATEGORY |
AVERAGE NUMBER OF EMPLOYEES |
MEN |
WOMEN |
|
Distribution by sexes |
|
23.638 |
39.845 |
|
Distribution by sexes |
|
23.638 |
39.845 |
PURCHASES
Import Percentage: 9%
Imports from: U.E. Y OTROS PAÍSES (CHINA, INDIA, TAILANDIA,
TAIWAN, TURQUÍA, VIETNAM, BANGLADESH Y COREA DEL SUR)
National Distribution: 91%
•
El 80,18% de su cifra de negocio corresponde a
ventas de la actividad comercial.
•
El 16,76% de su cifra de negocio corresponde a
ventas a empresas del Grupo.
•
El 3,06% de su cifra de negocio corresponde a
ingresos por prestación de servicios.
|
ENTITY |
BRANCH |
ADDRESS |
TOWN OR CITY |
PROVINCE |
|
FINANCIERA EL CORTE INGLES E.F.C., S.A. |
|
|
|
|
|
BANCO SANTANDER, S.A. |
|
|
|
|
|
UNICAJA BANCO, S.A. |
|
|
|
|
|
BANCO BILBAO VIZCAYA ARGENTARIA, S.A. |
|
|
|
|
There are 4 bank entities registered
Discount facilities: 1
Credit policy: 1
Mortgage loan: 0
Loans with no real security: 0
|
|
|
|
Debt type: Discount
facilities |
Granted limit:17.962.000,00 € Used limit:3.293.000,00
€ Available limit:14.669.000,00
€ Source: Filed
Accounts (2011) |
|
|
|
|
Debt type: Credit policy |
Granted limit:2.445.175.000,00 € Used limit:1.266.427.000,00
€ Available limit:1.178.748.000,00
€ Source: Filed
Accounts (2011) |
|
|
|
There are 2 bank operations registered
Figures given in €
|
ENTITY |
ASSERTS INVOLVED IN THE ACTIVITY |
UP TO 1 YEAR |
FROM 1 TO 5 YEARS |
MORE THAN 5 YEARS |
|
|
Terrenos, construcciones y equipos para procesos de información |
15.873.000,00 |
25.085.000,00 |
3.173.000,00 |
There are 1 leasing operations registered
FORMER NAMES:
•
EL CORTE INGLES SL
Brand name: LIVEMAG (Valid)
Type: JOINT Scope: NATIONAL Date: 03/01/2012
Brand name: EL CORTE INGLES ESPACIO DE LAS ARTES (Valid)
Type: JOINT Scope: NATIONAL Date: 23/12/2011
Brand name: PITIFLU (Valid)
Type: GRAPHICAL Scope: COMMUNITARY
Date: 16/12/2011
Brand name: SI NO QUEDA SATISFECHO NO SERIAMOS EL CORTE
INGLES (Valid)
Type: JOINT Scope: NATIONAL Date: 18/11/2011
Brand name: LLOYD’S (Valid)
Type: JOINT Scope: NATIONAL Date: 03/11/2011
There are 2.612 brands, signs and commercial names
LEGAL STRUCTURE
Constitution
Data
Register Date: 02/01/1952
Legal form: Joint-stock Company
Share capital: 486.864.000,00 €
Paid-up capital: 486.864.000,00 €
Obligation to fill in Financial Statements: YES
Chamber census: YES (2010)
B.O.R.M.E.
(OFFICIAL GAZETTE OF
THE COMMERCIAL REGISTRY) ![]()
Acts on activity: 1 (Last: 03/11/1994)
Acts on administrators: 492 (Last: 18/01/2012, first:
16/02/1990)
Acts on capital: 20 (Last: 20/10/2008, first:
01/03/1991)
Acts on creation: 0
Acts on filed accounts: 39 (Last: 19/11/2010, first:
05/12/1990)
Acts on identification: 0
Acts on Information: 22 (Last: 28/07/2011, first:
12/12/1990)
Acts on proceedings: 2 (Last: 19/06/2002, first:
14/01/2002)
Latest acts in
B.O.R.M.E.
Other acts
|
ACT |
DATE |
NOTICE NUM. |
COMMERCIAL REGISTRY |
|
Appointments |
18/01/2012 |
23088 |
Madrid |
|
Appointments |
18/01/2012 |
23087 |
Madrid |
|
Appointments |
18/01/2012 |
23086 |
Madrid |
|
Appointments |
18/01/2012 |
23085 |
Madrid |
|
Appointments |
18/01/2012 |
23084 |
Madrid |
|
Appointments |
20/12/2011 |
504086 |
Madrid |
|
Appointments |
20/12/2011 |
504085 |
Madrid |
|
Resignations |
20/12/2011 |
504084 |
Madrid |
|
Resignations |
20/12/2011 |
504083 |
Madrid |
|
Appointments |
20/12/2011 |
504082 |
Madrid |
There are 576 acts registered
PRESS ARTICLES

Press summary by
type of information (last five years) ![]()
Legal notices: 0
Structural Data: 267 (Last: 27/02/2012, first: 06/01/2007)
Informative data: 174 (Last: 21/02/2012, first: 08/01/2007)
Financial Information: 22 (Last: 02/03/2012, first:
27/08/2007)
Negative information: 0
Business lines: 63 (Last: 29/02/2012, first: 22/02/2007)
Historical press releases: 958 (Last: 29/12/2006, first:
15/05/1993)
Latest press
article published ![]()
02/03/2012 CINCO DIAS (Page 8) FINANCIAL
DATA
EL CORTE INGLES ha inyectado 40 millones de euros en BRICOR, su filial
de artículos re bricolaje y decoración creada hace 6 años. Gracias a este movimiento,
BRICOR más que duplica su capital, ya que lo sitúa en los 70 millones de euros.
La cía. explica que esta ampliación tiene como objetivo sustentar el
crecimiento de los últimos años y apuntalar el de los próximos ejercicios. En
2011 EL CORTE INGLES inauguró 3 establecimientos de BRICOR.
29/02/2012 CINCO DIAS (Page 12) MARKET
SHARE
PROCTER & GAMBLE ha desbancado a TELEFONICA de su puesto como
principal anunciante en España en 2011. El año pasado el grupo estadounidense
destinó 123,8 millones de euros a publicidad, un 6,3% menos que en 2010, según
el informe de INFOADEX presentado el 28/02/12. Pese a la menor inversión,
PROCTER superó a la teleco española, que recortó un 13,5% el dinero destinado a
publicidad, hasta 113,3 millones. EL CORTE INGLES, que mantuvo el volumen de
dinero destinado a anuncios en los 99,8 millones (un 0,5% más) pasó a ocupar el
tercer puesto del ranking de anunciantes.
27/02/2012 CORDOBA (Page 8) BRANCHES
EL CORTE INGLÉS tiene previsto abrir en mayo del corriente el HIPERCOR
que construye en Turruñuelos. No obstante, fuentes de la empresa indican que no
se ha fijado una fecha oficial para la apertura. La intención es tener abierto
el centro en el primer semestre, por lo que tampoco se descarta que la apertura
se produzca en junio.
El centro comercial proporcionará a Córdoba más de 800 empleos. El
edificio contará con seis plantas, y el supermercado se ubicará en la planta
baja.
24/02/2012 NEGOCIO (Page 8) PRODUCTS AND
ACTIVITIES
EL CORTE INGLÉS ha reforzado su cartera de marcas propias con el
lanzamiento de una línea de tratamiento facial y corporal bajo la enseña de
dermocosmética Plantea, que se venderá en exclusiva en las secciones de
parafarmacia de sus centros de España y Portugal. La nueva marca, que cuenta
con 18 referencias, aspira a posicionarse entre las marcas de prestigio de la
dermocosmética, según informó el 23/02/12 la compañía.
21/02/2012 NEGOCIO (Page 5) AGREEMENTS
BETWEEN COMPANIES
La firma de calzado EL NATURALISTA incrementa su red de distribución en
el mercado español al poner en marcha su primer punto de venta en EL CORTE
INGLÉS en Bilbao. El País Vasco representa actualmente el 16% de la cifra de
negocio de la Cía. Los planes de la empresa pasan por continuar creciendo en
España, apoyándose en EL CORTE INGLÉS. Según Juan de la Peña, director
comercial de la Sdad., España ha sido uno de los mercados que mejor ha
respondido a sus estrategias comerciales; para este año prevén un crecimiento
de hasta un 17%.
There are 1.484 press articles registered for this company
Complementary
Information
Global Compact
Esta empresa se adhirió al Pacto Mundial el 24/06/2002. (Fuente: Red
Española del Pacto Mundial de Naciones Unidas)
FINANCIAL INFORMATION
The information on the last Individual Filed Accounts contained in this
report is extracted from the Commercial Registry file of the legal address of
the Company and dated 27/01/2012.
SITUATION
BALANCE-SHEET
Assets
Figures given in thousands €
|
|
28/02/2011 (12) |
% ASSETS |
28/02/2010 (12) |
% ASSETS |
28/02/2009 (12) |
% ASSETS |
|
A) NON CURRENT ASSETS |
9.961.668,00 |
77,57 |
9.969.157,00 |
79,34 |
9.686.231,00 |
78,17 |
|
I. Intangible assets |
313.240,00 |
2,44 |
322.672,00 |
2,57 |
319.299,00 |
2,58 |
|
2. Concessions |
67.425,00 |
0,53 |
70.470,00 |
0,56 |
72.923,00 |
0,59 |
|
3. Patents, licences , trademarks and similars |
6.107,00 |
0,05 |
6.622,00 |
0,05 |
6.562,00 |
0,05 |
|
4. Goodwill |
10.688,00 |
0,08 |
10.688,00 |
0,09 |
10.688,00 |
0,09 |
|
5. Software |
228.391,00 |
1,78 |
234.047,00 |
1,86 |
228.197,00 |
1,84 |
|
7. Other intangible assets |
629,00 |
0,00 |
845,00 |
0,01 |
929,00 |
0,01 |
|
II. Tangible fixed assets |
6.463.130,00 |
50,33 |
6.313.708,00 |
50,25 |
6.024.545,00 |
48,62 |
|
1. Property, plant and equipment |
3.926.140,00 |
30,57 |
3.691.108,00 |
29,38 |
3.418.975,00 |
27,59 |
|
2. Technical fittings and other tangible assets |
2.427.384,00 |
18,90 |
2.458.823,00 |
19,57 |
2.393.619,00 |
19,32 |
|
3. Fixed assets in progress and advances |
109.606,00 |
0,85 |
163.777,00 |
1,30 |
211.951,00 |
1,71 |
|
III. Real-estate investments |
|
|
|
|
|
|
|
IV. Long term investments in associated and affiliated companies |
2.959.033,00 |
23,04 |
3.111.507,00 |
24,76 |
3.132.967,00 |
25,29 |
|
1. Net worth instruments |
2.945.582,00 |
22,94 |
3.103.259,00 |
24,70 |
3.127.313,00 |
25,24 |
|
2. Credits to companies |
10.000,00 |
0,08 |
5.000,00 |
0,04 |
5.000,00 |
0,04 |
|
5. Other financial assets |
3.451,00 |
0,03 |
3.248,00 |
0,03 |
654,00 |
0,01 |
|
V. Long Term Financial Investments |
187.868,00 |
1,46 |
167.785,00 |
1,34 |
134.331,00 |
1,08 |
|
1. Net worth instruments |
94.940,00 |
0,74 |
79.199,00 |
0,63 |
66.073,00 |
0,53 |
|
2. Credits to third parties |
83.364,00 |
0,65 |
77.132,00 |
0,61 |
61.237,00 |
0,49 |
|
4. By-products |
1.282,00 |
0,01 |
3.340,00 |
0,03 |
|
|
|
5. Other financial assets |
8.282,00 |
0,06 |
8.114,00 |
0,06 |
7.021,00 |
0,06 |
|
VI. Assets by deferred taxes |
38.397,00 |
0,30 |
53.485,00 |
0,43 |
75.089,00 |
0,61 |
|
VII. Non current commercial debts |
|
|
|
|
|
|
|
B) CURRENT ASSETS |
2.880.541,00 |
22,43 |
2.596.145,00 |
20,66 |
2.704.339,00 |
21,83 |
|
I. Non-current assets maintained for sale |
|
|
|
|
|
|
|
II. Stocks |
1.810.475,00 |
14,10 |
1.686.973,00 |
13,43 |
1.860.907,00 |
15,02 |
|
1. Goods available for sale |
1.799.913,00 |
14,02 |
1.677.515,00 |
13,35 |
1.851.303,00 |
14,94 |
|
2. Raw material inventory |
10.562,00 |
0,08 |
9.458,00 |
0,08 |
9.604,00 |
0,08 |
|
III. Trade Debtors and other receivable accounts |
989.810,00 |
7,71 |
702.549,00 |
5,59 |
711.769,00 |
5,74 |
|
1. Clients |
146.578,00 |
1,14 |
148.419,00 |
1,18 |
203.468,00 |
1,64 |
|
b) Clients for sales and short term services
rendering |
146.578,00 |
1,14 |
148.419,00 |
1,18 |
203.468,00 |
1,64 |
|
2. Clients group and associated companies |
665.385,00 |
5,18 |
391.849,00 |
3,12 |
338.240,00 |
2,73 |
|
3. Other debts |
166.811,00 |
1,30 |
145.721,00 |
1,16 |
131.362,00 |
1,06 |
|
5. Assets by current taxes |
|
|
|
|
27.206,00 |
0,22 |
|
6. Other credits with the Public Administrations |
11.036,00 |
0,09 |
16.560,00 |
0,13 |
11.493,00 |
0,09 |
|
IV. Short term investments in associated and affiliated companies |
13,00 |
0,00 |
10,00 |
0,00 |
29,00 |
0,00 |
|
2. Credits to companies |
13,00 |
0,00 |
10,00 |
0,00 |
29,00 |
0,00 |
|
V. Short term financial investments |
5.662,00 |
0,04 |
58.754,00 |
0,47 |
3.315,00 |
0,03 |
|
4. By-products |
|
|
13.211,00 |
0,11 |
2.681,00 |
0,02 |
|
5. Other financial assets |
5.662,00 |
0,04 |
45.543,00 |
0,36 |
634,00 |
0,01 |
|
VI. Short term periodifications |
16.505,00 |
0,13 |
17.430,00 |
0,14 |
19.995,00 |
0,16 |
|
VII. Cash and equivalents |
58.076,00 |
0,45 |
130.429,00 |
1,04 |
108.324,00 |
0,87 |
|
1. Treasury |
58.076,00 |
0,45 |
130.429,00 |
1,04 |
108.324,00 |
0,87 |
|
TOTAL ASSETS (A + B) |
12.842.209,00 |
100,00 |
12.565.302,00 |
100,00 |
12.390.570,00 |
100,00 |
Net Worth and
Liabilities
Figures given in thousands €
|
|
28/02/2011 (12) |
% ASSETS |
28/02/2010 (12) |
% ASSETS |
28/02/2009 (12) |
% ASSETS |
|
A) NET WORTH |
5.835.779,00 |
45,44 |
5.542.303,00 |
44,11 |
5.313.003,00 |
42,88 |
|
A-1) Equity |
5.868.854,00 |
45,70 |
5.568.476,00 |
44,32 |
5.346.871,00 |
43,15 |
|
I. Capital |
486.864,00 |
3,79 |
486.864,00 |
3,87 |
486.864,00 |
3,93 |
|
1. Authorized capital |
486.864,00 |
3,79 |
486.864,00 |
3,87 |
486.864,00 |
3,93 |
|
II. Issue premium |
|
|
|
|
|
|
|
III. Reserves |
5.290.134,00 |
41,19 |
4.962.010,00 |
39,49 |
4.627.364,00 |
37,35 |
|
1. Legal and statutory |
97.373,00 |
0,76 |
97.373,00 |
0,77 |
97.373,00 |
0,79 |
|
2. Other funds |
5.192.761,00 |
40,44 |
4.864.637,00 |
38,71 |
4.529.991,00 |
36,56 |
|
IV. (Net worth own shares and participations) |
-283.161,00 |
-2,20 |
-247.471,00 |
-1,97 |
-130.403,00 |
-1,05 |
|
V. Results from previous years |
|
|
|
|
|
|
|
VI. Other loans from partners |
|
|
|
|
|
|
|
VII. Exercise Result |
375.017,00 |
2,92 |
367.073,00 |
2,92 |
363.046,00 |
2,93 |
|
VIII. (Interim dividend) |
|
|
|
|
|
|
|
IX. Other net worth instruments |
|
|
|
|
|
|
|
A-2) Value changes adjustments |
-33.075,00 |
-0,26 |
-26.173,00 |
-0,21 |
-33.868,00 |
-0,27 |
|
I. Financial assets available for sale |
-15.564,00 |
-0,12 |
-13.239,00 |
-0,11 |
-22.330,00 |
-0,18 |
|
II. Coverage operations |
-17.511,00 |
-0,14 |
-12.934,00 |
-0,10 |
-11.538,00 |
-0,09 |
|
III. Non-current assets and related liabilities, maintained for sale |
|
|
|
|
|
|
|
IV. Conversion differences |
|
|
|
|
|
|
|
V. Other |
|
|
|
|
|
|
|
A-3) Received legacies, grants and subventions |
|
|
|
|
|
|
|
B) NON CURRENT LIABILITIES |
2.863.558,00 |
22,30 |
3.090.268,00 |
24,59 |
2.623.345,00 |
21,17 |
|
I. Long term provisions |
7.638,00 |
0,06 |
7.500,00 |
0,06 |
7.500,00 |
0,06 |
|
4. Other provisions |
7.638,00 |
0,06 |
7.500,00 |
0,06 |
7.500,00 |
0,06 |
|
II. Long term debts |
2.817.227,00 |
21,94 |
3.046.238,00 |
24,24 |
2.582.978,00 |
20,85 |
|
1. Debentures and other negotiable values |
1.344.287,00 |
10,47 |
1.186.529,00 |
9,44 |
893.461,00 |
7,21 |
|
2. Debts with bank entities |
1.322.380,00 |
10,30 |
1.677.811,00 |
13,35 |
1.417.606,00 |
11,44 |
|
3. Financial leasing creditors |
28.258,00 |
0,22 |
44.130,00 |
0,35 |
53.108,00 |
0,43 |
|
4. By-products |
23.583,00 |
0,18 |
41.021,00 |
0,33 |
16.482,00 |
0,13 |
|
5. Other financial liabilities |
98.719,00 |
0,77 |
96.747,00 |
0,77 |
202.321,00 |
1,63 |
|
III. Long term debts with associated and affiliated companies |
793,00 |
0,01 |
833,00 |
0,01 |
798,00 |
0,01 |
|
IV. Liabilities by deferred taxes |
37.900,00 |
0,30 |
35.697,00 |
0,28 |
32.069,00 |
0,26 |
|
V. Long term periodifications |
|
|
|
|
|
|
|
VI. Non current trade creditors |
|
|
|
|
|
|
|
VII. Long term debts with special characteristics |
|
|
|
|
|
|
|
C) CURRENT LIABILITIES |
4.142.872,00 |
32,26 |
3.932.731,00 |
31,30 |
4.454.222,00 |
35,95 |
|
I. Liabilities related with non-current assets maintained for sale |
|
|
|
|
|
|
|
II. Short term provisions |
|
|
2.351,00 |
0,02 |
2.228,00 |
0,02 |
|
III. Short term debts |
1.538.759,00 |
11,98 |
1.296.177,00 |
10,32 |
1.731.616,00 |
13,98 |
|
2. Debts with bank entities |
1.274.134,00 |
9,92 |
893.277,00 |
7,11 |
1.263.796,00 |
10,20 |
|
3. Financial leasing creditors |
15.873,00 |
0,12 |
8.948,00 |
0,07 |
8.641,00 |
0,07 |
|
4. By-products |
8.498,00 |
0,07 |
16,00 |
0,00 |
|
|
|
5. Other financial liabilities |
240.254,00 |
1,87 |
393.936,00 |
3,14 |
459.179,00 |
3,71 |
|
IV. Short term debts with associated and affiliated companies |
343.977,00 |
2,68 |
453.564,00 |
3,61 |
520.013,00 |
4,20 |
|
V. Trade creditors and other payable accounts |
2.257.399,00 |
17,58 |
2.179.789,00 |
17,35 |
2.199.798,00 |
17,75 |
|
1. Suppliers |
1.681.162,00 |
13,09 |
1.710.499,00 |
13,61 |
1.710.454,00 |
13,80 |
|
b) Short term suppliers |
1.681.162,00 |
13,09 |
1.710.499,00 |
13,61 |
1.710.454,00 |
13,80 |
|
2. Suppliers group and associated companies |
39.801,00 |
0,31 |
19.212,00 |
0,15 |
19.609,00 |
0,16 |
|
3. Different creditors |
21.527,00 |
0,17 |
39.308,00 |
0,31 |
23.283,00 |
0,19 |
|
4. Staff (pending remunerations) |
294.040,00 |
2,29 |
310.464,00 |
2,47 |
370.879,00 |
2,99 |
|
5. Liabilities by current taxes |
32.149,00 |
0,25 |
20.580,00 |
0,16 |
|
|
|
6. Other debts with Public Administrations |
69.162,00 |
0,54 |
68.635,00 |
0,55 |
62.463,00 |
0,50 |
|
7. Clients pre-payments |
119.558,00 |
0,93 |
11.091,00 |
0,09 |
13.110,00 |
0,11 |
|
VI. Short term periodifications |
2.737,00 |
0,02 |
850,00 |
0,01 |
567,00 |
0,00 |
|
VII. Short term debts with special characteristics |
|
|
|
|
|
|
|
TOTAL NET WORTH AND LIABILITIES (A + B + C) |
12.842.209,00 |
100,00 |
12.565.302,00 |
100,00 |
12.390.570,00 |
100,00 |
PROFIT AND LOSS
ACCOUNT
Figures given in thousands €
|
|
28/02/2011 (12) |
%OPERATING INCOME |
28/02/2010 (12) |
%OPERATING INCOME |
28/02/2009 (12) |
%OPERATING INCOME |
|
A) CONTINUED OPERATIONS |
|
|
|
|
|
|
|
1. Net Turnover |
11.050.024,00 |
95,49 |
11.201.939,00 |
95,60 |
11.555.893,00 |
95,48 |
|
A) Sales |
10.711.788,00 |
92,57 |
10.836.674,00 |
92,49 |
11.265.856,00 |
93,09 |
|
b) Services provided |
338.236,00 |
2,92 |
365.265,00 |
3,12 |
290.037,00 |
2,40 |
|
2. Variation in stocks of finished goods and work in progress |
|
|
|
|
|
|
|
3. Works for its own assets |
125.496,00 |
1,08 |
129.391,00 |
1,10 |
144.742,00 |
1,20 |
|
4. Supplies |
-7.937.548,00 |
-68,60 |
-8.106.169,00 |
-69,18 |
-8.416.286,00 |
-69,54 |
|
a) Material consumed |
-7.892.477,00 |
-68,21 |
-8.052.622,00 |
-68,72 |
-8.362.615,00 |
-69,10 |
|
c) Works carried out for other companies |
-44.596,00 |
-0,39 |
-49.255,00 |
-0,42 |
-56.101,00 |
-0,46 |
|
d) Deterioration on merchandises, raw materials and other supplies |
-475,00 |
0,00 |
-4.292,00 |
-0,04 |
2.430,00 |
0,02 |
|
5. Other operating income |
396.021,00 |
3,42 |
385.887,00 |
3,29 |
401.733,00 |
3,32 |
|
a) Other incomes |
390.702,00 |
3,38 |
378.835,00 |
3,23 |
396.485,00 |
3,28 |
|
b) Operating grants included in the exercise result |
5.319,00 |
0,05 |
7.052,00 |
0,06 |
5.248,00 |
0,04 |
|
6. Labour cost |
-1.867.594,00 |
-16,14 |
-1.821.254,00 |
-15,54 |
-1.874.644,00 |
-15,49 |
|
a) Wages and similar expenses |
-1.463.238,00 |
-12,65 |
-1.419.853,00 |
-12,12 |
-1.464.107,00 |
-12,10 |
|
b) Social costs |
-404.356,00 |
-3,49 |
-401.401,00 |
-3,43 |
-410.537,00 |
-3,39 |
|
7. Other operating costs |
-1.098.399,00 |
-9,49 |
-1.080.455,00 |
-9,22 |
-1.095.213,00 |
-9,05 |
|
a) External services |
-936.161,00 |
-8,09 |
-917.616,00 |
-7,83 |
-931.413,00 |
-7,70 |
|
b) Taxes |
-56.362,00 |
-0,49 |
-52.609,00 |
-0,45 |
-48.272,00 |
-0,40 |
|
c) Losses, deterioration and variation on business operations
provisions |
2.652,00 |
0,02 |
-6.373,00 |
-0,05 |
-2.071,00 |
-0,02 |
|
d) Other day to day expenses |
-108.528,00 |
-0,94 |
-103.857,00 |
-0,89 |
-113.457,00 |
-0,94 |
|
8. Amortization of fixed assets |
-363.406,00 |
-3,14 |
-346.446,00 |
-2,96 |
-324.503,00 |
-2,68 |
|
9. Allocation of subventions on non financial investments and other |
|
|
|
|
|
|
|
10. Provisions excess |
23,00 |
0,00 |
95,00 |
0,00 |
23,00 |
0,00 |
|
11. Deterioration and result for fixed assets disposal |
347,00 |
0,00 |
1.911,00 |
0,02 |
2.598,00 |
0,02 |
|
b) Results for disposals and others |
347,00 |
0,00 |
1.911,00 |
0,02 |
2.598,00 |
0,02 |
|
12. Negative difference of business combinations |
|
|
|
|
|
|
|
13. Other results |
|
|
|
|
|
|
|
A.1) OPERATING RESULT (1 + 2 + 3 + 4 + 5 + 6 + 7 + 8 + 9 + 10 + 11 +
12 + 13) |
304.964,00 |
2,64 |
364.899,00 |
3,11 |
394.343,00 |
3,26 |
|
14. Financial income |
421.897,00 |
3,65 |
307.551,00 |
2,62 |
243.291,00 |
2,01 |
|
a) From net worth instruments participations |
414.739,00 |
3,58 |
304.522,00 |
2,60 |
240.344,00 |
1,99 |
|
a 1) On group and associated companies |
414.673,00 |
3,58 |
304.481,00 |
2,60 |
234.767,00 |
1,94 |
|
a 2) On third parties |
66,00 |
0,00 |
41,00 |
0,00 |
5.577,00 |
0,05 |
|
b) From negotiable values and other financial instruments |
7.158,00 |
0,06 |
3.029,00 |
0,03 |
2.947,00 |
0,02 |
|
b 1) From group and associated companies |
1.015,00 |
0,01 |
745,00 |
0,01 |
409,00 |
0,00 |
|
b 2) From third parties |
6.143,00 |
0,05 |
2.284,00 |
0,02 |
2.538,00 |
0,02 |
|
15. Financial expenses |
-182.267,00 |
-1,58 |
-173.618,00 |
-1,48 |
-177.049,00 |
-1,46 |
|
a) For debts with associated and affiliated companies |
-17.670,00 |
-0,15 |
-21.702,00 |
-0,19 |
-27.243,00 |
-0,23 |
|
b) For debts with third parties |
-164.597,00 |
-1,42 |
-151.916,00 |
-1,30 |
-149.806,00 |
-1,24 |
|
16. Reasonable value variation on financial instruments |
19.888,00 |
0,17 |
-10.424,00 |
-0,09 |
3.695,00 |
0,03 |
|
a) Negotiation portfolio and others |
1.317,00 |
0,01 |
-10.424,00 |
-0,09 |
3.695,00 |
0,03 |
|
b) Allocation to the exercise result for financial assets available
for sale |
18.571,00 |
0,16 |
|
|
|
|
|
17. Exchange differences |
2.090,00 |
0,02 |
1.176,00 |
0,01 |
640,00 |
0,01 |
|
18. Deterioration and result for disposal of financial instruments |
-155.219,00 |
-1,34 |
-101.553,00 |
-0,87 |
-53.033,00 |
-0,44 |
|
a) Deteriorations and losses |
-156.855,00 |
-1,36 |
-101.553,00 |
-0,87 |
-52.887,00 |
-0,44 |
|
b) Results for disposals and others |
1.636,00 |
0,01 |
|
|
-146,00 |
0,00 |
|
19. Other financial income and expenses |
|
|
|
|
|
|
|
A.2) FINANCIAL RESULT (14 + 15 + 16 + 17 + 18 + 19) |
106.389,00 |
0,92 |
23.132,00 |
0,20 |
17.544,00 |
0,14 |
|
A.3) RESULT BEFORE TAXES (A.1 + A.2) |
411.353,00 |
3,55 |
388.031,00 |
3,31 |
411.887,00 |
3,40 |
|
20. Taxes on profits |
-36.336,00 |
-0,31 |
-20.958,00 |
-0,18 |
-48.841,00 |
-0,40 |
|
A.4) EXERCISE RESULT COMING FROM CONTINUED OPERATIONS (A.3 + 20) |
375.017,00 |
3,24 |
367.073,00 |
3,13 |
363.046,00 |
3,00 |
|
B) DISCONTINUED OPERATIONS |
|
|
|
|
|
|
|
21. Net of taxes exercise result coming from discontinued operations |
|
|
|
|
|
|
|
A.5) EXERCISE RESULT (A.4 + 21) |
375.017,00 |
3,24 |
367.073,00 |
3,13 |
363.046,00 |
3,00 |
NET WORTH CHANGES
STATUS
Status of
recognized income and expenses
Figures given in thousands €
|
NET WORTH CHANGES (1/3) |
28/02/2011 (12) |
28/02/2010 (12) |
28/02/2009 (12) |
|
A) PROFIT AND LOSS ACCOUNT RESULT |
375.017,00 |
367.073,00 |
363.046,00 |
|
INCOME AND EXPENSES ALLOCATED DIRECTLY TO NET WORTH |
|
|
|
|
I. For valuation of financial instruments |
15.250,00 |
12.987,00 |
-5.595,00 |
|
1. Financial assets available for sale |
15.250,00 |
12.987,00 |
-5.595,00 |
|
II. Cash flow coverage |
-25.695,00 |
-8.669,00 |
-18.055,00 |
|
III. Received legacies, grants and subventions |
|
|
|
|
IV. For actuarial profits and losses and other adjustments |
|
|
|
|
V. Non-current assets and related liabilities, maintained for sale |
|
|
|
|
VI. Conversion differences |
|
|
|
|
VII. Tax effect |
3.134,00 |
-1.295,00 |
7.095,00 |
|
B) TOTAL INCOME AND EXPENSES ALLOCATED DIRECTLY TO NET WORTH (I + II +
III + IV +V+VI+VII) |
-7.311,00 |
3.023,00 |
-16.555,00 |
|
PROFIT AND LOSS ACCOUNT TRANSFERS |
|
|
|
|
VIII. For valuation of financial instruments |
-18.571,00 |
|
|
|
1. Financial assets available for sale |
-18.571,00 |
|
|
|
IX. Cash flow coverage |
19.156,00 |
6.675,00 |
|
|
X. Received legacies, grants and subventions |
|
|
|
|
XI. Non-current assets and related liabilities, maintained for sale |
|
|
|
|
XII. Conversion differences |
|
|
|
|
XIII. Tax effect |
-176,00 |
-2.003,00 |
|
|
C) TOTAL TRANSFERS TO THE PROFIT AND LOSS ACCOUNT (VIII + IX + X + XI+
XII+ XIII) |
409,00 |
4.672,00 |
|
|
TOTAL INCOME AND EXPENSES RECOGNIZED (A + B + C) |
368.115,00 |
374.768,00 |
346.491,00 |
Total net worth
changes status
Figures given in thousands €
|
NET WORTH CHANGES ( 2 /3) |
AUTHORIZED CAPITAL |
RESERVES |
(NET WORTH OWN SHARES AND PARTICIPATIONS) |
EXERCISE RESULT |
|
FINAL ACCOUNT BALANCE OF EXERCISE (2008) |
473.340,00 |
4.271.991,00 |
-72.528,00 |
447.072,00 |
|
I. Adjustments by change of criteria in the exercise (2008) |
|
|
|
|
|
II. Adjustments by errors in the exercise (2008) |
|
|
|
|
|
ADJUSTED ACCOUNT BALANCE, BEGINNING OF EXERCISE (2009) |
473.340,00 |
4.271.991,00 |
-72.528,00 |
447.072,00 |
|
I. Total recognized income and expenses |
|
|
|
363.046,00 |
|
II. Operations with partners or owners |
13.524,00 |
355.373,00 |
-57.875,00 |
-447.072,00 |
|
1. Capital Increases |
13.524,00 |
|
|
|
|
2. (-) Capital reductions |
|
-13.530,00 |
|
|
|
4. (-) Dividends distribution |
|
|
|
-78.169,00 |
|
5. Operations with own participations or shares (net) |
|
|
-57.875,00 |
|
|
7. Other operations with partners or owners |
|
368.903,00 |
|
-368.903,00 |
|
III. Other net worth variations |
|
|
|
|
|
FINAL ACCOUNT BALANCE OF EXERCISE (2009) |
486.864,00 |
4.627.364,00 |
-130.403,00 |
363.046,00 |
|
I. Adjustments by change of criteria in the exercise (2009) |
|
|
|
|
|
II. Adjustments by errors in the exercise (2009) |
|
|
|
|
|
ADJUSTED ACCOUNT BALANCE, BEGINNING OF EXERCISE (2010) |
486.864,00 |
4.627.364,00 |
-130.403,00 |
363.046,00 |
|
I. Total recognized income and expenses |
|
|
|
367.073,00 |
|
II. Operations with partners or owners |
|
334.646,00 |
-117.068,00 |
-363.046,00 |
|
4. (-) Dividends distribution |
|
|
|
-28.400,00 |
|
5. Operations with own participations or shares (net) |
|
|
-117.068,00 |
|
|
7. Other operations with partners or owners |
|
334.646,00 |
|
-334.646,00 |
|
III. Other net worth variations |
|
|
|
|
|
FINAL ACCOUNT BALANCE OF EXERCISE (2010) |
486.864,00 |
4.962.010,00 |
-247.471,00 |
367.073,00 |
|
I. Adjustments by change of criteria in the exercise (2010) |
|
|
|
|
|
II. Adjustments by errors in the exercise (2010) |
|
|
|
|
|
ADJUSTED ACCOUNT BALANCE, BEGINNING OF EXERCISE (2011) |
486.864,00 |
4.962.010,00 |
-247.471,00 |
367.073,00 |
|
I. Total recognized income and expenses |
|
|
|
375.017,00 |
|
II. Operations with partners or owners |
|
328.124,00 |
-35.690,00 |
-367.073,00 |
|
4. (-) Dividends distribution |
|
|
|
-38.949,00 |
|
5. Operations with own participations or shares (net) |
|
|
-35.690,00 |
|
|
7. Other operations with partners or owners |
|
328.124,00 |
|
-328.124,00 |
|
III. Other net worth variations |
|
|
|
|
|
FINAL ACCOUNT BALANCE OF EXERCISE (2011) |
486.864,00 |
5.290.134,00 |
-283.161,00 |
375.017,00 |
|
NET WORTH CHANGES ( 3 /3) |
VALUE CHANGES ADJUSTMENTS |
TOTAL |
|
|
|
FINAL ACCOUNT BALANCE OF EXERCISE (2008) |
-17.313,00 |
5.102.562,00 |
|
|
|
I. Adjustments by change of criteria in the exercise (2008) |
|
|
|
|
|
II. Adjustments by errors in the exercise (2008) |
|
|
|
|
|
ADJUSTED ACCOUNT BALANCE, BEGINNING OF EXERCISE (2009) |
-17.313,00 |
5.102.562,00 |
|
|
|
I. Total recognized income and expenses |
-16.555,00 |
346.491,00 |
|
|
|
II. Operations with partners or owners |
|
-136.050,00 |
|
|
|
1. Capital Increases |
|
13.524,00 |
|
|
|
2. (-) Capital reductions |
|
-13.530,00 |
|
|
|
4. (-) Dividends distribution |
|
-78.169,00 |
|
|
|
5. Operations with own participations or shares (net) |
|
-57.875,00 |
|
|
|
7. Other operations with partners or owners |
|
|
|
|
|
III. Other net worth variations |
|
|
|
|
|
FINAL ACCOUNT BALANCE OF EXERCISE (2009) |
-33.868,00 |
5.313.003,00 |
|
|
|
I. Adjustments by change of criteria in the exercise (2009) |
|
|
|
|
|
II. Adjustments by errors in the exercise (2009) |
|
|
|
|
|
ADJUSTED ACCOUNT BALANCE, BEGINNING OF EXERCISE (2010) |
-33.868,00 |
5.313.003,00 |
|
|
|
I. Total recognized income and expenses |
7.695,00 |
374.768,00 |
|
|
|
II. Operations with partners or owners |
|
-145.468,00 |
|
|
|
4. (-) Dividends distribution |
|
-28.400,00 |
|
|
|
5. Operations with own participations or shares (net) |
|
-117.068,00 |
|
|
|
7. Other operations with partners or owners |
|
|
|
|
|
III. Other net worth variations |
|
|
|
|
|
FINAL ACCOUNT BALANCE OF EXERCISE (2010) |
-26.173,00 |
5.542.303,00 |
|
|
|
I. Adjustments by change of criteria in the exercise (2010) |
|
|
|
|
|
II. Adjustments by errors in the exercise (2010) |
|
|
|
|
|
ADJUSTED ACCOUNT BALANCE, BEGINNING OF EXERCISE (2011) |
-26.173,00 |
5.542.303,00 |
|
|
|
I. Total recognized income and expenses |
-6.902,00 |
368.115,00 |
|
|
|
II. Operations with partners or owners |
|
-74.639,00 |
|
|
|
4. (-) Dividends distribution |
|
-38.949,00 |
|
|
|
5. Operations with own participations or shares (net) |
|
-35.690,00 |
|
|
|
7. Other operations with partners or owners |
|
|
|
|
|
III. Other net worth variations |
|
|
|
|
|
FINAL ACCOUNT BALANCE OF EXERCISE (2011) |
-33.075,00 |
5.835.779,00 |
|
|
CASH FLOW STATUS
Figures given in thousands €
|
|
28/02/2011 (12) |
28/02/2010 (12) |
28/02/2009 (12) |
|
A) CASH FLOW COMING FROM OPERATING ACTIVITIES |
|
|
|
|
1. exercise result before taxes |
411.353,00 |
388.031,00 |
411.887,00 |
|
2. Results adjustments |
275.379,00 |
316.866,00 |
305.547,00 |
|
a) Amortization of fixed assets (+) |
363.406,00 |
346.446,00 |
324.503,00 |
|
b) Value correction for deterioration (+/-) |
156.855,00 |
101.553,00 |
52.887,00 |
|
c) Change of Provisions (+/-) |
138,00 |
|
-116,00 |
|
e) Results for decline and disposal of fixed assets (+/-) |
-347,00 |
-1.911,00 |
-2.598,00 |
|
f) Results for decline and disposal of financial instruments (+/-) |
-1.636,00 |
|
146,00 |
|
g) Financial income (-) |
-421.897,00 |
-307.551,00 |
-243.291,00 |
|
f) Financial expenses (+) |
182.267,00 |
173.618,00 |
177.049,00 |
|
i) Change difference (+/-) |
-2.090,00 |
-1.176,00 |
640,00 |
|
j) Reasonable value variation on financial instruments (+/-) |
-1.317,00 |
5.887,00 |
-3.695,00 |
|
k) Other income and expenses (-/+) |
|
|
22,00 |
|
3. Changes in current capital |
-393.001,00 |
108.794,00 |
-601.802,00 |
|
a) Stocks (+/-) |
-123.502,00 |
173.934,00 |
-80.292,00 |
|
b) Debtors and other receivable accounts (+/-) |
-287.261,00 |
9.220,00 |
-154.832,00 |
|
c) Other current assets (+/-) |
54.014,00 |
-64.837,00 |
116,00 |
|
d) Creditors and other payable accounts (+/-) |
-58.388,00 |
-20.009,00 |
-384.012,00 |
|
e) Other current liabilities (+/-) |
1.887,00 |
283,00 |
-199,00 |
|
f) Other non-current assets and liabilities (+/-) |
20.249,00 |
10.203,00 |
17.417,00 |
|
4. Other cash flow coming from operating activities |
234.449,00 |
124.706,00 |
44.417,00 |
|
a) Interests payments (-) |
-182.267,00 |
-173.618,00 |
-177.049,00 |
|
b) Dividends collections (+) |
414.739,00 |
304.522,00 |
240.344,00 |
|
c) Interests collections (+) |
7.158,00 |
3.029,00 |
2.947,00 |
|
d) Collections (payments) for profit tax (+/-) |
-5.181,00 |
-9.227,00 |
-21.825,00 |
|
5. Cash flow coming from operating activities (1 + 2 + 3 + 4) |
528.180,00 |
938.397,00 |
160.049,00 |
|
B) CASH FLOW COMING FROM INVESTING ACTIVITIES |
|
|
|
|
6. Investment payments (-) |
-631.210,00 |
-827.719,00 |
-1.718.426,00 |
|
a) Group and associated companies |
-5.451,00 |
-80.093,00 |
-644.531,00 |
|
b) Intangible assets |
-47.104,00 |
-58.241,00 |
-74.950,00 |
|
c) Tangible assets |
-510.241,00 |
-654.716,00 |
-959.447,00 |
|
e) Other financial assets |
-68.414,00 |
-34.669,00 |
-39.498,00 |
|
7. Disinvestment collections (+) |
53.174,00 |
28.185,00 |
81.796,00 |
|
a) Group and associated companies |
1.097,00 |
|
51.137,00 |
|
b) Intangible assets |
2.114,00 |
6.302,00 |
472,00 |
|
c) Tangible assets |
3.343,00 |
4.341,00 |
10.256,00 |
|
e) Other financial assets |
46.620,00 |
17.542,00 |
19.931,00 |
|
8. Cash Flow in investment activities (6 + 7) |
-578.036,00 |
-799.534,00 |
-1.636.630,00 |
|
C) CASH FLOW COMING FROM FINANCING ACTIVITIES |
|
|
|
|
9. Net worth instruments collections and payments |
-35.690,00 |
-117.068,00 |
-57.875,00 |
|
c) Own net worth instruments acquisition (-) |
-35.690,00 |
-117.068,00 |
-57.875,00 |
|
10. Financial liabilities instruments collections and payments |
50.052,00 |
27.534,00 |
1.672.863,00 |
|
a) Issue |
549.454,00 |
553.615,00 |
2.170.901,00 |
|
1. Debentures and other negotiable values (+) |
157.758,00 |
293.068,00 |
34.243,00 |
|
2. Debts with bank entities (+) |
384.771,00 |
260.512,00 |
1.867.724,00 |
|
3. Debts with group and associated companies (+) |
|
35,00 |
168,00 |
|
5. Other debts (+) |
6.925,00 |
|
268.766,00 |
|
b) Return and amortization of |
-499.402,00 |
-526.081,00 |
-498.038,00 |
|
2. Debts with bank entities (-) |
-355.431,00 |
-379.497,00 |
-484,00 |
|
3. Debts with group and associated companies (-) |
-40,00 |
-66.449,00 |
-496.314,00 |
|
5. Other debts (-) |
-143.931,00 |
-80.135,00 |
-1.240,00 |
|
11. Payments for dividends and remunerations of other net worth
instruments |
-38.949,00 |
-28.400,00 |
-78.169,00 |
|
a) Dividends (-) |
-38.949,00 |
-28.400,00 |
-78.169,00 |
|
12. Cash Flow in financing activities (9 + 10 + 11) |
-24.587,00 |
-117.934,00 |
1.536.819,00 |
|
D) Exchange rate variations effect |
2.090,00 |
1.176,00 |
|
|
E) NET CASH OR EQUIVALENTS INCREASE / REDUCTION (5 + 8 + 12 + D) |
-72.353,00 |
22.105,00 |
60.238,00 |
|
Cash or equivalents at the beginning of the exercise |
130.429,00 |
108.324,00 |
48.086,00 |
|
Cash or equivalents at the end of the exercise |
58.076,00 |
130.429,00 |
108.324,00 |
RATIOS
|
|
28/02/2011 (12) |
CHANGE % |
28/02/2010 (12) |
CHANGE % |
28/02/2009 (12) |
|
BALANCE RATIOS |
|||||
|
Working Capital (€) |
-1.262.331,00 |
5,56 |
-1.336.586,00 |
23,62 |
-1.749.883,00 |
|
Working capital ratio |
-0,10 |
9,09 |
-0,11 |
21,43 |
-0,14 |
|
Soundness Ratio |
0,59 |
5,36 |
0,56 |
1,82 |
0,55 |
|
Average Collection Period (days) |
32 |
42,86 |
23 |
1,61 |
22 |
|
Average Payment Period (days) |
104 |
0,35 |
103 |
0,35 |
103 |
|
LIQUIDITY RATIOS |
|||||
|
Current Ratio (%) |
69,53 |
5,33 |
66,01 |
8,73 |
60,71 |
|
Quick Ratio (%) |
1,54 |
-67,98 |
4,81 |
91,63 |
2,51 |
|
DEBT RATIOS |
|||||
|
Borrowing percentage (%) |
36,60 |
-4,11 |
38,18 |
-2,20 |
39,02 |
|
External Financing Average Cost |
0,04 |
0,00 |
0,04 |
0,00 |
0,04 |
|
Debt Service Coverage |
8,90 |
74,17 |
5,11 |
-83,09 |
30,21 |
|
Interest Coverage |
1,67 |
-20,48 |
2,10 |
-5,83 |
2,23 |
|
GENERAL AND ACTIVITIES RATIOS |
|||||
|
Auto financing generated by sales (%) |
4,78 |
-42,96 |
8,38 |
502,88 |
1,38 |
|
Auto financing generated by Assets (%) |
4,11 |
-44,98 |
7,47 |
479,07 |
1,29 |
|
Breakdown Point |
1,03 |
0,00 |
1,03 |
0,00 |
1,04 |
|
Average Sales Volume per Employee |
198,17 |
8,81 |
182,12 |
0,29 |
181,61 |
|
Average Cost per Employee |
33,49 |
13,10 |
29,61 |
0,51 |
29,46 |
|
Assets Turnover |
0,86 |
-3,37 |
0,89 |
-4,30 |
0,93 |
|
Inventory Turnover (days) |
82 |
9,62 |
75 |
-5,88 |
80 |
|
RESULTS RATIOS |
|||||
|
Return on Assets (ROA) (%) |
2,38 |
-17,93 |
2,90 |
-8,81 |
3,18 |
|
Operating Profitability (%) |
5,21 |
-8,27 |
5,68 |
-2,41 |
5,82 |
|
Return on Equity (ROE) (%) |
7,01 |
0,57 |
6,97 |
-9,48 |
7,70 |
SECTORIAL ANALYSIS
Balance Sheet and
Financial Balance
Figures expressed in %
|
|
COMPANY (2011) |
SECTOR |
DIFFERENCE |
|
BALANCE SHEET ANALYSIS: % on the total
assets |
|
|
|
|
ASSETS |
|||
|
A) NON CURRENT ASSETS |
77,57 |
84,76 |
-7,19 |
|
A) CURRENT ASSETS |
22,43 |
15,24 |
7,19 |
|
LIABILITIES |
|||
|
A) NET WORTH |
45,44 |
85,10 |
-39,66 |
|
B) NON CURRENT LIABILITIES |
22,30 |
2,83 |
19,47 |
|
C) CURRENT LIABILITIES |
32,26 |
12,07 |
20,19 |
|
|
|
|
|
Results Analytical
Account
Figures given in %
|
|
COMPANY (2011) |
SECTOR |
DIFFERENCE |
|
Net Turnover |
95,49 |
97,44 |
-1,95 |
|
Other operating income |
4,51 |
2,56 |
1,95 |
|
OPERATING INCOME |
100,00 |
100,00 |
0,00 |
|
Supplies |
-68,60 |
-68,07 |
-0,53 |
|
Variation in stocks of finished goods and work in progress |
|
0,00 |
|
|
GROSS MARGIN |
31,40 |
31,93 |
-0,53 |
|
Other operating costs |
-9,49 |
-10,87 |
1,38 |
|
Labour cost |
-16,14 |
-13,81 |
-2,33 |
|
GROSS OPERATING RESULT |
5,77 |
7,26 |
-1,49 |
|
Amortization of fixed assets |
-3,14 |
-3,32 |
0,18 |
|
Deterioration and result for fixed assets disposal |
0,00 |
0,22 |
-0,22 |
|
Other expenses / income |
|
0,00 |
|
|
NET OPERATING RESULT |
2,64 |
4,15 |
-1,51 |
|
Financial result |
0,92 |
-0,04 |
0,96 |
|
RESULT BEFORE TAX |
3,55 |
4,12 |
-0,57 |
|
Taxes on profits |
-0,31 |
-1,08 |
0,77 |
|
RESULT COMING FROM CONTINUED OPERATIONS |
3,24 |
3,04 |
0,21 |
|
Exercise result coming from discontinued operations net of taxes |
|
0,00 |
|
|
NET RESULT |
3,24 |
3,04 |
0,21 |
|
Amortization of fixed assets |
-3,14 |
-3,32 |
0,18 |
|
Deterioration and provisions variation |
-3,12 |
0,14 |
-3,26 |
|
|
9,50 |
6,21 |
3,29 |
Main Ratios
Figures given in thousands €
|
|
COMPANY (2011) |
PTILE25 |
PTILE50 |
PTILE75 |
|
BALANCE RATIOS |
|
|
|
|
|
Working Capital (€) |
-1.262.331,00 |
838,50 |
8.137,65 |
24.412,92 |
|
Working capital ratio |
-0,10 |
0,01 |
0,08 |
0,19 |
|
Soundness Ratio |
0,59 |
0,75 |
1,06 |
1,25 |
|
Average Collection Period (days) |
32 |
3 |
12 |
91 |
|
Average Payment Period (days) |
104 |
49 |
69 |
105 |
|
LIQUIDITY RATIOS |
|
|
|
|
|
Current Ratio (%) |
69,53 |
109,17 |
128,72 |
155,66 |
|
Quick Ratio (%) |
1,54 |
3,37 |
6,32 |
41,36 |
|
DEBT RATIOS |
|
|
|
|
|
Borrowing percentage (%) |
36,60 |
2,29 |
7,92 |
30,61 |
|
External Financing Average Cost |
0,04 |
0,03 |
0,04 |
0,07 |
|
Debt Service Coverage |
8,90 |
0,03 |
0,53 |
8,38 |
|
Interest Coverage |
1,67 |
1,95 |
7,54 |
39,21 |
|
GENERAL AND ACTIVITIES RATIOS |
|
|
|
|
|
Auto financing generated by sales (%) |
4,78 |
1,06 |
4,76 |
7,40 |
|
Auto financing generated by Assets (%) |
4,11 |
0,99 |
8,52 |
11,49 |
|
Breakdown Point |
1,03 |
0,99 |
1,04 |
1,09 |
|
Average Sales Volume per Employee |
198,17 |
124,79 |
183,62 |
252,10 |
|
Average Cost per Employee |
33,49 |
21,66 |
25,43 |
30,52 |
|
Assets Turnover |
0,86 |
0,81 |
2,07 |
3,10 |
|
Inventory Turnover (days) |
82 |
33 |
52 |
227 |
|
RESULTS RATIOS |
|
|
|
|
|
Return on Assets (ROA) (%) |
2,38 |
-0,51 |
4,41 |
11,95 |
|
Operating Profitability (%) |
5,21 |
2,27 |
8,97 |
18,33 |
|
Return on Equity (ROE) (%) |
7,01 |
-0,14 |
7,40 |
26,22 |
ADDITIONAL INFORMATION
Consulted Sources
Central Commercial
Registry
Tax Administration / VIES Consultation
Tax Administration / Consultation by NIF
INTERNET
This company has been consulted was last displayed on 06/03/2012,
1.045 times in the last quarter and 28.079 total times.
FOREIGN EXCHANGE RATES
|
Currency |
Unit
|
Indian Rupees |
|
US Dollar |
1 |
Rs.55.65 |
|
UK Pound |
1 |
Rs.88.10 |
|
Euro |
1 |
Rs.69.84 |
INFORMATION DETAILS
|
Report Prepared
by : |
SDA |
RATING EXPLANATIONS
|
RATING |
STATUS |
PROPOSED CREDIT LINE |
|
|
>86 |
Aaa |
Possesses an extremely sound financial base with the strongest
capability for timely payment of interest and principal sums |
Unlimited |
|
71-85 |
Aa |
Possesses adequate working capital. No caution needed for credit
transaction. It has above average (strong) capability for payment of interest
and principal sums |
Large |
|
56-70 |
A |
Financial & operational base are regarded healthy. General
unfavourable factors will not cause fatal effect. Satisfactory capability for
payment of interest and principal sums |
Fairly Large |
|
41-55 |
Ba |
Overall operation is considered normal. Capable to meet normal
commitments. |
Satisfactory |
|
26-40 |
B |
Capability to overcome financial difficulties seems comparatively
below average. |
Small |
|
11-25 |
Ca |
Adverse factors are apparent. Repayment of interest and principal sums
in default or expected to be in default upon maturity |
Limited with
full security |
|
<10 |
C |
Absolute credit risk exists. Caution needed to be exercised |
Credit not
recommended |
|
---- |
NB |
New Business |
---- |
This score serves as a reference to assess SC’s credit risk
and to set the amount of credit to be extended. It is calculated from a
composite of weighted scores obtained from each of the major sections of this
report. The assessed factors and their relative weights (as indicated through
%) are as follows:
Financial
condition (40%) Ownership
background (20%) Payment
record (10%)
Credit history
(10%) Market trend
(10%) Operational
size (10%)
This report is issued at your request without any
risk and responsibility on the part of MIRA INFORM PRIVATE LIMITED (MIPL)
or its officials.