![]()
MIRA INFORM REPORT
|
Report Date : |
02.02.2012 |
IDENTIFICATION DETAILS
|
Name : |
KT&G CORPORATION |
|
|
|
|
Registered Office : |
110, Pyeongchon-Dong, Daedeok-Gu, Daejeon, 306-712 |
|
|
|
|
Country : |
South Korea |
|
|
|
|
Financials (as on) : |
31.12.2010 |
|
|
|
|
Date of Incorporation : |
01.04.1987 |
|
|
|
|
Legal Form : |
Public Parent Company |
|
|
|
|
Line of Business : |
Subject is engaged in production and sale of cigarettes |
|
|
|
|
No. of Employees
: |
4192 |
RATING & COMMENTS
|
MIRA’s Rating : |
A |
|
RATING |
STATUS |
PROPOSED CREDIT LINE |
|
|
56-70 |
A |
Financial & operational base are regarded healthy. General
unfavourable factors will not cause fatal effect. Satisfactory capability for
payment of interest and principal sums |
Fairly Large |
|
Status : |
Good |
|
|
|
|
Payment
Behaviour : |
No Complaints |
|
|
|
|
Litigation : |
Clear |
NOTES:
Any query related to this report can be made
on e-mail : infodept@mirainform.com
while quoting report number, name and date.
ECGC Country Risk Classification List – September 30th, 2011
|
Country Name |
Previous Rating (30.06.2011) |
Current Rating (30.09.2011) |
|
South Korea |
a1 |
a1 |
|
Risk Category |
ECGC
Classification |
|
Insignificant |
A1 |
|
Low |
A2 |
|
Moderate |
B1 |
|
High |
B2 |
|
Very High |
C1 |
|
Restricted |
C2 |
|
Off-credit |
D |
Company name & address
KT&G Corporation
110, Pyeongchon-Dong
Daedeok-Gu
Daejeon, 306-712
Korea, Republic of
Tel: 82-42-9395000
Fax: 82-2-34044515
Web: www.ktng.com
synthesis
Employees: 4,192
Company Type: Public
Parent
Corporate Family: 2
Companies
Traded: Korea
Stock Exchange: 033780
Incorporation Date:
01-Apr-1987
Auditor: KPMG LLP
Financials in: USD
(Millions)
Fiscal Year End:
31-Dec-2010
Reporting Currency: South
Korean Won
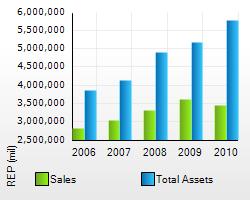
Annual Sales: 3,461,418.5
Net Income: 1,031,823.4
Total Assets: 5,777,059.0
Market Value: 10,118,460.0
(20-Jan-2012)
Business Description
KT&G Corporation is a Korea-based company principally engaged in the
production and sale of cigarettes. The Company primarily manufactures and sells
cigarettes under the brand names of HOOPA, ESSE Soun 0.1, SIMPLE ACE, RAISON
BLUE CAT, Y IS STYLE BLANC, THE ONE 0.1, BlackJack Black, THE ONE FRESH,
Arirang and others in domestic market. In addition, the Company also exports
cigarettes under the brand names of ESSE GOLDEN LEAF SE, ESSE SILVER, ESSE
MENTHOL, ESSE LIGHTS, ESSE ONE, PINE Menthol Lights, ZEST, CIMA, CARNIVAL,
RAISON and CLOUD 9 to the Middle East, Central Asia, the Americas, Southeast Asia
and China. As of December 31, 2010, the Company had seven affiliated companies
domestically and abroad. For the three months ended 31 March 2011, KT&G
Corporation's total revenues increased 6% to W824.44B. The Company's net income
increased less than 1% to W182.40B. Total revenues reflect increased overseas
demands for cigarettes. Net income was partially offset by decreased gain on LT
deposit investment, exclusion of gain on disposal of security available for
sale and decreased gain on foreign exchange transaction.
Industry
Industry Tobacco
ANZSIC 2006: 1220 - Cigarette
and Tobacco Product Manufacturing
NACE 2002: 1600 - Manufacture
of tobacco products
NAICS 2002: 312221 - Cigarette
Manufacturing
UK SIC 2003: 1600 - Manufacture
of tobacco products
US SIC 1987: 2111 - Cigarettes
Key Executives
|
Name |
Title |
|
Young Kyoon Kwak |
Chairman of the Board, Chief Executive Officer |
|
Kwang-Youl Lee |
Senior Managing Director, Marketing and Sales |
|
Gun-Young Byun |
Manager-Export |
|
Il Jong Kim |
Director-Quality |
|
Paul Kim |
Manager-Investor Relations |
Significant Developments
|
Topic |
#* |
Most Recent Headline |
Date |
|
Strategic Combinations |
2 |
Q Capital Partners Co., Ltd. to Jointly Establish PEF |
25-Oct-2011 |
|
Equity Financing / Related |
1 |
KT&G Corporation to Dispose Treasury Shares |
14-Dec-2011 |
|
Share Repurchases |
1 |
KT&G Corporation Announces Share Repurchase |
20-Apr-2011 |
|
Dividends |
1 |
KT&G Corporation Declares Annual Cash Dividend for FY 2011 |
19-Jan-2012 |
* number of significant developments within the last 12 months
news
|
Title |
Date |
|
Cheong-Kwan-Jang Brand of Korean Ginseng
Popular at PGA Tour |
26-Jan-2012 |
|
Yungjin files patent application for
vasodilator formulation |
23-Jan-2012 |
|
YUNGJIN signs export and supply contract
for spinal stenosis drug with China |
23-Jan-2012 |
|
KT&G's net plunges 20.7 pct in 2011 |
19-Jan-2012 |
|
S. KOREAN TOBACCO CO KT&G'S NET
PLUNGES 20.7 PCT IN 2011 |
19-Jan-2012 |
Financial Summary
As of 30-Sep-2011
Key Ratios Company Industry
Current Ratio (MRQ) 3.43 1.14
Quick Ratio (MRQ) 2.05 0.52
Debt to Equity (MRQ) 0.02 3.05
Sales 5 Year Growth 5.53 1.71
Net Profit Margin (TTM) % 23.13 12.94
Return on Assets (TTM) % 14.52 17.41
Return on Equity (TTM) % 18.70 65.19
|
Stock Snapshot |
|
|
Corporate Overview
Location
110, Pyeongchon-Dong
Daedeok-Gu
Daejeon, 306-712
Korea, Republic of
Tel: 82-42-9395000
Fax: 82-2-34044515
Web: www.ktng.com
Quote Symbol - Exchange
033780 - Korea
Stock Exchange
Sales KRW(mil): 3,461,418.5
Assets KRW(mil): 5,777,059.0
Employees: 4,192
Fiscal Year End: 31-Dec-2010
Industry: Tobacco
Incorporation Date: 01-Apr-1987
Company Type: Public
Parent
Quoted Status: Quoted
Previous Name: Korea
Tobacco & Ginseng Corporation
Chairman of the Board,
Chief Executive Officer: Young
Kyoon Kwak
Company Web Links
· Corporate History/Profile
· Executives
· Financial Information
· Home Page
· Investor Relations
· News Releases
· Products/Services
Contents
· Industry Codes
· Business Description
· Brand/Trade Names
· Financial Data
· Market Data
· Key Corporate Relationships
Industry Codes
ANZSIC 2006 Codes:
1220 - Cigarette and Tobacco Product Manufacturing
3606 - Liquor and Tobacco Product Wholesaling
NACE 2002 Codes:
1600 - Manufacture of tobacco products
5135 - Wholesale of tobacco products
NAICS 2002 Codes:
424940 - Tobacco and Tobacco Product Merchant Wholesalers
312221 - Cigarette Manufacturing
US SIC 1987:
2111 - Cigarettes
5194 - Tobacco and Tobacco Products
UK SIC 2003:
1600 - Manufacture of tobacco products
5135 - Wholesale of tobacco products
Business
Description
KT&G
Corporation is a Korea-based company principally engaged in the production and
sale of cigarettes. The Company primarily manufactures and sells cigarettes
under the brand names of HOOPA, ESSE Soun 0.1, SIMPLE ACE, RAISON BLUE CAT, Y
IS STYLE BLANC, THE ONE 0.1, BlackJack Black, THE ONE FRESH, Arirang and others
in domestic market. In addition, the Company also exports cigarettes under the
brand names of ESSE GOLDEN LEAF SE, ESSE SILVER, ESSE MENTHOL, ESSE LIGHTS,
ESSE ONE, PINE Menthol Lights, ZEST, CIMA, CARNIVAL, RAISON and CLOUD 9 to the
Middle East, Central Asia, the Americas, Southeast Asia and China. As of
December 31, 2010, the Company had seven affiliated companies domestically and
abroad. For the three months ended 31 March 2011, KT&G Corporation's total
revenues increased 6% to W824.44B. The Company's net income increased less than
1% to W182.40B. Total revenues reflect increased overseas demands for
cigarettes. Net income was partially offset by decreased gain on LT deposit
investment, exclusion of gain on disposal of security available for sale and
decreased gain on foreign exchange transaction.
More Business
Descriptions
Manufacture and sale of cigarettes and tobacco products
This major group includes general contractors and operative builders primarily engaged in the construction of residential, farm, industrial, commercial, or other buildings. General building contractors who combine a special trade with the contracting are included in this major group.
Tobacco Product Manufacturing
Brand/Trade Names
Bohem Esse
|
|||||||||||||||||||||||||||||||||||||||||||||||||||||||||||||||||||||||||||||||||||||||||||||||
|
|
|
|
Corporate Family |
Corporate Structure News: |
|
|
|
|
KT&G
Corporation |
|
|
|
|
|
|
|
|
Company Name |
Company Type |
Location |
Country |
Industry |
Sales |
Employees |
|
|
KT&G Corporation |
Parent |
Daejeon |
Korea, Republic of |
Tobacco |
3,461,419.0 |
4,192 |
|
|
KT&G Corporation |
Subsidiary |
Jakarta |
Indonesia |
Tobacco |
|
|
|
Executive report
|
|
|||||||||||||||||||||||||||||||||||||||||||||||||||||||||||||||||||||||||||||||||||||||||||||||||||||||||||||||||||||||||||||||||||||||||||||||||||||||||||||||||||||||||||||||||||||||||||||||||||||||||||||||||||||||||||||||||||||||||||||||||||||||||||||||||||||||||||||||||||||||||||||||||||||||||||||||||||||||||||||||||||||||||||||||||||||||||||||||||||||||||||||||||||||||||||||||||||||||||||||||||||||||||||||||||||||||||||||||||||||||||||||||||||||||||||||||||||||||||||||
Significant Developments
KT&G Corporation Declares Annual Cash Dividend for FY 2011 Jan 19, 2012
KT&G Corporation announced that it has declared an annual cash dividend of KRW 3,200 per share of common stock to shareholders of record on December 31, 2011, for the fiscal year 2011. The dividend rate of market price is 3.89% and the total amount of the cash dividend is KRW 402,396,160,000. The Company's annual cash dividend for the fiscal year 2010 was KRW 3,000 per share.
KT&G Corporation to Dispose Treasury Shares Dec 14, 2011
KT&G Corporation announced that it will sell 100,000 shares of its common stock for KRW 8,170 million. Q Capital Partners Co., Ltd. to Jointly Establish PEF Oct 25, 2011
Q Capital Partners Co., Ltd. announced that it has decided to jointly establish a private equity fund with KT&G Corporation. The new entity, will be capitalized at KRW 800 billion, and Q Capital Partners Co., Ltd. will invest KRW 400 billion to hold a 50% stake in it with KT&G Corporation holding 50% stake.
KT&G Corporation Announces Share Repurchase Apr 20, 2011
KT&G Corporation announced that its Board of Directors has authorized the Company to repurchase 2 million shares of its common stock, worth KRW 108.4 billion, to maximize shareholders' value through stabilizing its share price. The authorization allows the repurchase of shares from April 21, 2011 to July 20, 2011.
KT&G Corporation Signs MOU with Yanji Government (China) Mar 23, 2011
KT&G Corporation announced that it has signed a memorandum of understanding (MOU) with Yanji Government (China), to invest KRW 137.2 billion to KRW 171.5 billion in ginseng business.
Annual Income Statement
Financials in: REP (mil)
Except for share items (millions) and per share items (actual units)
|
|
31-Dec-2010 |
31-Dec-2009 |
31-Dec-2008 |
31-Dec-2007 |
31-Dec-2006 |
|
Period Length |
12 Months |
12 Months |
12 Months |
12 Months |
12 Months |
|
UpdateType/Date |
Updated Normal |
Updated Normal |
Restated Normal |
Updated Normal |
Updated Normal |
|
Filed Currency |
KRW |
KRW |
KRW |
KRW |
KRW |
|
Exchange Rate
(Period Average) |
1 |
1 |
1 |
1 |
1 |
|
Auditor |
KPMG LLP |
KPMG LLP |
KPMG LLP |
KPMG LLP |
KPMG LLP |
|
Auditor Opinion |
Unqualified with
Explanation |
Unqualified |
Unqualified |
Unqualified |
Unqualified |
|
|
|
|
|
|
|
|
Net Sales |
3,461,418.4 |
3,626,353.0 |
3,312,319.2 |
3,046,384.2 |
2,816,117.4 |
|
Revenue |
3,461,418.4 |
3,626,353.0 |
3,312,319.2 |
3,046,384.2 |
2,816,117.4 |
|
Total Revenue |
3,461,418.4 |
3,626,353.0 |
3,312,319.2 |
3,046,384.2 |
2,816,117.4 |
|
|
|
|
|
|
|
|
Cost of Revenue |
1,446,708.4 |
1,553,264.1 |
1,312,531.6 |
- |
- |
|
Cost of Revenue, Total |
1,446,708.4 |
1,553,264.1 |
1,312,531.6 |
- |
- |
|
Gross Profit |
2,014,710.0 |
2,073,089.0 |
1,999,787.5 |
3,046,384.2 |
2,816,117.4 |
|
|
|
|
|
|
|
|
Selling/General/Administrative Expense |
279,526.7 |
254,185.8 |
809,681.3 |
218,676.3 |
197,138.4 |
|
Labor & Related Expense |
334,975.2 |
317,197.0 |
21,000.0 |
277,951.4 |
266,945.9 |
|
Advertising Expense |
245,802.0 |
219,332.0 |
- |
172,050.4 |
171,069.7 |
|
Total Selling/General/Administrative Expenses |
860,303.9 |
790,714.8 |
830,681.3 |
668,678.1 |
635,154.0 |
|
Research & Development |
21,550.0 |
20,345.0 |
- |
22,834.3 |
20,920.9 |
|
Depreciation |
47,704.0 |
53,118.0 |
- |
56,243.1 |
49,104.2 |
|
Amortization of Intangibles |
1,219.0 |
1,378.0 |
- |
4,508.4 |
4,494.3 |
|
Depreciation/Amortization |
48,923.0 |
54,496.0 |
- |
60,751.5 |
53,598.5 |
|
Investment Income -
Operating |
11,146.0 |
28,321.0 |
- |
- |
- |
|
Interest/Investment Income - Operating |
11,146.0 |
28,321.0 |
- |
- |
- |
|
Interest Expense (Income) - Net Operating Total |
11,146.0 |
28,321.0 |
- |
- |
- |
|
Impairment-Assets Held for Use |
- |
- |
- |
3,244.9 |
204.8 |
|
Impairment-Assets Held for Sale |
- |
- |
- |
2,163.1 |
2,363.8 |
|
Loss (Gain) on Sale of Assets - Operating |
-93,114.0 |
-5,383.0 |
- |
- |
- |
|
Other Unusual Expense (Income) |
2,769.0 |
1,669.0 |
- |
6.5 |
3.0 |
|
Unusual Expense (Income) |
-90,345.0 |
-3,714.0 |
- |
5,414.5 |
2,571.6 |
|
Other Operating Expense |
5,721.4 |
6,917.8 |
50,061.2 |
1,055.2 |
1,089.2 |
|
Other, Net |
17,316.6 |
20,272.9 |
-118,859.4 |
1,313,029.3 |
1,248,129.0 |
|
Other Operating Expenses, Total |
23,038.0 |
27,190.8 |
-68,798.2 |
1,314,084.5 |
1,249,218.2 |
|
Total Operating Expense |
2,321,324.3 |
2,470,617.6 |
2,074,414.7 |
2,071,762.9 |
1,961,463.1 |
|
|
|
|
|
|
|
|
Operating Income |
1,140,094.1 |
1,155,735.4 |
1,237,904.5 |
974,621.3 |
854,654.3 |
|
|
|
|
|
|
|
|
Interest Expense - Non-Operating |
-3,255.0 |
-4,815.0 |
-13,711.2 |
-4,501.7 |
-3,856.3 |
|
Interest Expense, Net Non-Operating |
-3,255.0 |
-4,815.0 |
-13,711.2 |
-4,501.7 |
-3,856.3 |
|
Interest Income -
Non-Operating |
- |
- |
21,251.7 |
41,497.0 |
43,276.1 |
|
Investment Income -
Non-Operating |
245,294.8 |
-1,094.6 |
-317.5 |
13,740.5 |
10,877.6 |
|
Interest/Investment Income - Non-Operating |
245,294.8 |
-1,094.6 |
20,934.2 |
55,237.5 |
54,153.7 |
|
Interest Income (Expense) - Net Non-Operating |
23,541.0 |
12,052.0 |
- |
- |
- |
|
Interest Income (Expense) - Net Non-Operating Total |
265,580.8 |
6,142.4 |
7,223.0 |
50,735.8 |
50,297.4 |
|
Gain (Loss) on Sale of Assets |
- |
- |
- |
4,718.7 |
500.5 |
|
Other Non-Operating Income (Expense) |
- |
0.3 |
- |
-92,277.1 |
-17,397.8 |
|
Other, Net |
- |
0.3 |
- |
-92,277.1 |
-17,397.8 |
|
Income Before Tax |
1,405,674.9 |
1,161,878.1 |
1,245,127.5 |
937,798.8 |
888,054.5 |
|
|
|
|
|
|
|
|
Total Income Tax |
374,886.3 |
311,783.7 |
349,998.9 |
291,393.7 |
242,066.6 |
|
Income After Tax |
1,030,788.6 |
850,094.3 |
895,128.6 |
646,405.1 |
645,987.8 |
|
|
|
|
|
|
|
|
Minority Interest |
1,034.8 |
996.3 |
2,648.5 |
16,200.6 |
2,942.1 |
|
Net Income Before Extraord Items |
1,031,823.4 |
851,090.6 |
897,777.0 |
662,605.6 |
648,930.0 |
|
Net Income |
1,031,823.4 |
851,090.6 |
897,777.0 |
662,605.6 |
648,930.0 |
|
|
|
|
|
|
|
|
Income Available to Common Excl Extraord Items |
1,031,823.4 |
851,090.6 |
897,777.0 |
662,605.6 |
648,930.0 |
|
|
|
|
|
|
|
|
Income Available to Common Incl Extraord Items |
1,031,823.4 |
851,090.6 |
897,777.0 |
662,605.6 |
648,930.0 |
|
|
|
|
|
|
|
|
Basic/Primary Weighted Average Shares |
127.3 |
128.4 |
130.1 |
132.4 |
141.0 |
|
Basic EPS Excl Extraord Items |
8,108.52 |
6,629.86 |
6,898.52 |
5,002.97 |
4,603.19 |
|
Basic/Primary EPS Incl Extraord Items |
8,108.52 |
6,629.86 |
6,898.52 |
5,002.97 |
4,603.19 |
|
Diluted Net Income |
1,031,823.4 |
851,090.6 |
897,777.0 |
662,605.6 |
648,930.0 |
|
Diluted Weighted Average Shares |
127.3 |
128.4 |
130.1 |
132.4 |
141.0 |
|
Diluted EPS Excl Extraord Items |
8,108.52 |
6,629.86 |
6,898.52 |
5,002.97 |
4,603.19 |
|
Diluted EPS Incl Extraord Items |
8,108.52 |
6,629.86 |
6,898.52 |
5,002.97 |
4,603.19 |
|
Dividends per Share - Common Stock Primary Issue |
3,000.00 |
2,800.00 |
2,800.00 |
2,600.00 |
2,400.00 |
|
Gross Dividends - Common Stock |
382,946.0 |
356,157.0 |
360,357.0 |
340,449.0 |
319,712.0 |
|
Interest Expense, Supplemental |
4,469.1 |
4,815.0 |
4,714.0 |
4,501.7 |
3,856.3 |
|
Depreciation, Supplemental |
147,673.0 |
151,884.0 |
151,151.0 |
150,867.2 |
132,571.2 |
|
Total Special Items |
-90,345.0 |
-3,714.0 |
- |
3,665.8 |
5,041.0 |
|
Normalized Income Before Tax |
1,315,329.9 |
1,158,164.1 |
1,245,127.5 |
941,464.6 |
893,095.5 |
|
|
|
|
|
|
|
|
Effect of Special Items on Income Taxes |
-24,094.5 |
-996.6 |
- |
216.2 |
564.5 |
|
Inc Tax Ex Impact of Sp Items |
350,791.7 |
310,787.1 |
349,998.9 |
291,609.9 |
242,631.2 |
|
Normalized Income After Tax |
964,538.2 |
847,377.0 |
895,128.6 |
649,854.7 |
650,464.3 |
|
|
|
|
|
|
|
|
Normalized Inc. Avail to Com. |
965,572.9 |
848,373.3 |
897,777.0 |
666,055.2 |
653,406.5 |
|
|
|
|
|
|
|
|
Basic Normalized EPS |
7,587.89 |
6,608.69 |
6,898.52 |
5,029.02 |
4,634.94 |
|
Diluted Normalized EPS |
7,587.89 |
6,608.69 |
6,898.52 |
5,029.02 |
4,634.94 |
|
Amort of Acquisition Costs, Supplemental |
- |
- |
- |
2,970.0 |
2,970.0 |
|
Amort of Intangibles, Supplemental |
1,324.0 |
1,492.0 |
2,034.0 |
1,557.3 |
4,513.2 |
|
Rental Expenses |
21,061.0 |
18,049.0 |
13,922.0 |
8,804.0 |
6,205.9 |
|
Advertising Expense, Supplemental |
245,802.0 |
219,332.0 |
198,861.0 |
172,050.4 |
171,069.7 |
|
Research & Development Exp, Supplemental |
21,550.0 |
20,345.0 |
21,908.0 |
22,834.3 |
20,920.9 |
|
Normalized EBIT |
1,060,895.1 |
1,180,342.4 |
1,237,904.5 |
980,035.8 |
857,225.8 |
|
Normalized EBITDA |
1,209,892.1 |
1,333,718.4 |
1,391,089.5 |
1,135,430.3 |
997,280.2 |
Annual Balance Sheet
Financials in: KRW (mil)
|
|
31-Dec-2010 |
31-Dec-2009 |
31-Dec-2008 |
31-Dec-2007 |
31-Dec-2006 |
|
UpdateType/Date |
Updated Normal |
Updated Normal |
Restated Normal |
Updated Normal |
Updated Normal |
|
Filed Currency |
KRW |
KRW |
KRW |
KRW |
KRW |
|
Exchange Rate |
1 |
1 |
1 |
1 |
1 |
|
Auditor |
KPMG LLP |
KPMG LLP |
KPMG LLP |
KPMG LLP |
KPMG LLP |
|
Auditor Opinion |
Unqualified with
Explanation |
Unqualified |
Unqualified |
Unqualified |
Unqualified |
|
|
|
|
|
|
|
|
Cash & Equivalents |
981,313.8 |
316,671.8 |
110,244.9 |
137,687.1 |
201,869.2 |
|
Short Term Investments |
16,272.8 |
49,034.8 |
26,772.3 |
1,091.9 |
1,555.0 |
|
Cash and Short Term Investments |
997,586.5 |
365,706.5 |
137,017.1 |
138,779.0 |
203,424.2 |
|
Accounts Receivable -
Trade, Gross |
543,788.8 |
529,531.6 |
558,567.8 |
381,223.9 |
394,335.0 |
|
Provision for Doubtful
Accounts |
-6,875.0 |
-8,035.0 |
-7,869.0 |
-11,419.6 |
-39,306.0 |
|
Trade Accounts Receivable - Net |
539,117.8 |
522,069.6 |
551,082.8 |
370,130.7 |
355,271.3 |
|
Other Receivables |
87,291.0 |
78,734.0 |
82,557.0 |
54,653.0 |
144,418.7 |
|
Total Receivables, Net |
626,408.8 |
600,803.6 |
633,639.8 |
424,783.7 |
499,690.0 |
|
Inventories - Finished Goods |
253,465.0 |
269,397.0 |
187,703.0 |
137,912.3 |
141,937.4 |
|
Inventories - Work In Progress |
313,301.0 |
318,780.0 |
478,131.0 |
279,229.0 |
231,518.8 |
|
Inventories - Raw Materials |
878,502.0 |
878,360.0 |
859,806.0 |
818,492.7 |
890,867.1 |
|
Inventories - Other |
93,309.6 |
86,156.1 |
64,233.5 |
105,786.4 |
65,737.4 |
|
Total Inventory |
1,538,577.6 |
1,552,693.1 |
1,589,873.5 |
1,341,420.4 |
1,330,060.8 |
|
Prepaid Expenses |
199,404.3 |
181,245.5 |
205,474.6 |
9,408.9 |
7,421.4 |
|
Deferred Income Tax - Current Asset |
- |
- |
- |
17,604.5 |
8,225.9 |
|
Other Current Assets |
- |
0.0 |
0.0 |
- |
122.4 |
|
Other Current Assets, Total |
- |
0.0 |
0.0 |
17,604.5 |
8,348.3 |
|
Total Current Assets |
3,361,977.3 |
2,700,448.8 |
2,566,005.0 |
1,931,996.5 |
2,048,944.7 |
|
|
|
|
|
|
|
|
Buildings |
825,647.0 |
758,966.0 |
733,416.0 |
792,374.5 |
743,745.7 |
|
Land/Improvements |
436,950.0 |
437,143.0 |
436,527.0 |
431,727.8 |
381,943.7 |
|
Machinery/Equipment |
1,241,963.0 |
1,252,074.0 |
1,215,497.0 |
1,159,073.5 |
1,028,826.8 |
|
Construction in
Progress |
89,389.0 |
69,340.0 |
57,120.0 |
84,053.3 |
84,606.9 |
|
Other
Property/Plant/Equipment |
748.9 |
744.2 |
743.6 |
744.2 |
605.0 |
|
Property/Plant/Equipment - Gross |
2,594,697.9 |
2,518,267.2 |
2,443,303.6 |
2,467,973.2 |
2,239,728.2 |
|
Accumulated Depreciation |
-1,083,860.0 |
-1,046,712.0 |
-939,313.0 |
-908,684.1 |
-776,984.3 |
|
Property/Plant/Equipment - Net |
1,510,837.9 |
1,471,555.2 |
1,503,990.6 |
1,559,289.1 |
1,462,743.9 |
|
Intangibles, Net |
63,145.2 |
55,699.9 |
51,933.9 |
30,796.2 |
12,248.4 |
|
LT Investment - Affiliate Companies |
1,596.5 |
1,584.4 |
1,270.2 |
36,207.5 |
2,598.5 |
|
LT Investments - Other |
436,305.7 |
546,484.8 |
409,458.1 |
259,719.1 |
96,517.2 |
|
Long Term Investments |
437,902.3 |
548,069.2 |
410,728.3 |
295,926.5 |
99,115.7 |
|
Note Receivable - Long Term |
114,539.5 |
130,046.6 |
138,379.1 |
100,041.7 |
63,448.0 |
|
Deferred Income Tax - Long Term Asset |
11,066.9 |
8,169.1 |
7,108.7 |
1,764.7 |
- |
|
Other Long Term Assets |
277,590.0 |
257,894.5 |
234,783.7 |
214,287.4 |
170,625.1 |
|
Other Long Term Assets, Total |
288,656.9 |
266,063.6 |
241,892.4 |
216,052.1 |
170,625.1 |
|
Total Assets |
5,777,059.1 |
5,171,883.2 |
4,912,929.4 |
4,134,102.1 |
3,857,125.8 |
|
|
|
|
|
|
|
|
Accounts Payable |
301,211.2 |
326,598.2 |
455,332.6 |
15,201.8 |
14,896.3 |
|
Accrued Expenses |
324,857.0 |
350,049.8 |
370,196.9 |
328,062.5 |
194,854.8 |
|
Notes Payable/Short Term Debt |
66,507.2 |
94,532.5 |
104,113.1 |
38,199.5 |
80,997.8 |
|
Current Portion - Long Term Debt/Capital Leases |
505.6 |
447.9 |
280.4 |
210.3 |
- |
|
Customer Advances |
9,334.7 |
23,516.0 |
71,708.0 |
6,215.8 |
8,416.8 |
|
Income Taxes Payable |
222,932.3 |
128,418.8 |
187,609.9 |
220,427.5 |
135,654.4 |
|
Other Payables |
- |
- |
- |
105,692.9 |
30,548.0 |
|
Other Current Liabilities |
- |
- |
2,698.5 |
16,895.6 |
17,752.7 |
|
Other Current liabilities, Total |
232,267.0 |
151,934.8 |
262,016.5 |
349,231.7 |
192,371.9 |
|
Total Current Liabilities |
925,348.0 |
923,563.2 |
1,191,939.4 |
730,905.8 |
483,120.8 |
|
|
|
|
|
|
|
|
Long Term Debt |
1,539.6 |
2,026.4 |
2,474.3 |
2,732.7 |
1,402.0 |
|
Total Long Term Debt |
1,539.6 |
2,026.4 |
2,474.3 |
2,732.7 |
1,402.0 |
|
Total Debt |
68,552.4 |
97,006.8 |
106,867.8 |
41,142.5 |
82,399.8 |
|
|
|
|
|
|
|
|
Deferred Income Tax - LT Liability |
167,502.5 |
167,345.1 |
106,761.9 |
124,534.8 |
103,528.2 |
|
Deferred Income Tax |
167,502.5 |
167,345.1 |
106,761.9 |
124,534.8 |
103,528.2 |
|
Minority Interest |
42,130.0 |
27,112.2 |
27,563.8 |
20,117.4 |
20,218.5 |
|
Reserves |
2,219.8 |
2,256.4 |
1,957.0 |
1,258.1 |
76,280.5 |
|
Pension Benefits - Underfunded |
- |
- |
- |
86,392.5 |
99,506.4 |
|
Other Long Term Liabilities |
82,139.7 |
68,688.9 |
105,959.8 |
25,050.8 |
27,524.9 |
|
Other Liabilities, Total |
84,359.5 |
70,945.3 |
107,916.8 |
112,701.4 |
203,311.8 |
|
Total Liabilities |
1,220,879.7 |
1,190,992.2 |
1,436,656.3 |
990,992.1 |
811,581.3 |
|
|
|
|
|
|
|
|
Common Stock |
954,959.5 |
954,959.5 |
954,959.5 |
954,959.5 |
954,959.5 |
|
Common Stock |
954,959.5 |
954,959.5 |
954,959.5 |
954,959.5 |
954,959.5 |
|
Additional Paid-In Capital |
5,332.7 |
5,320.5 |
2,869.3 |
465,866.0 |
335,349.6 |
|
Retained Earnings (Accumulated Deficit) |
3,330,585.7 |
2,779,281.3 |
2,277,114.7 |
2,134,736.0 |
2,061,348.6 |
|
Treasury Stock - Common |
-216,827.0 |
-226,944.7 |
-226,944.7 |
-414,947.3 |
-321,903.9 |
|
Unrealized Gain (Loss) |
- |
- |
- |
3,135.0 |
16,938.3 |
|
Translation Adjustment |
- |
- |
- |
-639.2 |
-1,147.5 |
|
Other Equity |
482,128.5 |
468,274.4 |
468,274.4 |
- |
- |
|
Other Equity, Total |
482,128.5 |
468,274.4 |
468,274.4 |
-639.2 |
-1,147.5 |
|
Total Equity |
4,556,179.4 |
3,980,891.0 |
3,476,273.2 |
3,143,110.0 |
3,045,544.5 |
|
|
|
|
|
|
|
|
Total Liabilities & Shareholders’ Equity |
5,777,059.1 |
5,171,883.2 |
4,912,929.4 |
4,134,102.1 |
3,857,125.8 |
|
|
|
|
|
|
|
|
Shares Outstanding - Common Stock Primary
Issue |
127.6 |
127.2 |
128.7 |
130.8 |
133.2 |
|
Total Common Shares Outstanding |
127.6 |
127.2 |
128.7 |
130.8 |
133.2 |
|
Treasury Shares - Common Stock Primary Issue |
9.6 |
10.1 |
10.1 |
12.6 |
14.2 |
|
Employees |
4,214 |
4,653 |
4,750 |
4,367 |
4,317 |
|
Number of Common Shareholders |
104,382 |
132,863 |
105,512 |
107,629 |
120,524 |
|
Accumulated Intangible Amort, Suppl. |
20,105.0 |
15,217.0 |
- |
- |
- |
|
Deferred Revenue - Current |
9,334.7 |
23,516.0 |
71,708.0 |
6,215.8 |
8,416.8 |
|
Total Long Term Debt, Supplemental |
505.6 |
447.9 |
2,754.0 |
2,943.0 |
1,402.0 |
|
Long Term Debt Maturing within 1 Year |
505.6 |
447.9 |
280.0 |
210.0 |
97.5 |
|
Long Term Debt Maturing in Year 2 |
- |
- |
448.0 |
280.0 |
97.5 |
|
Long Term Debt Maturing in Year 3 |
- |
- |
504.0 |
446.0 |
259.0 |
|
Long Term Debt Maturing in Year 4 |
- |
- |
504.0 |
501.0 |
259.0 |
|
Long Term Debt Maturing in 2-3 Years |
- |
- |
952.0 |
726.0 |
356.5 |
|
Long Term Debt Maturing in 4-5 Years |
- |
- |
504.0 |
501.0 |
259.0 |
|
Long Term Debt Matur. in Year 6 & Beyond |
0.0 |
0.0 |
1,018.0 |
1,506.0 |
689.0 |
Annual Cash Flows
Financials in: KRW (mil)
|
|
31-Dec-2010 |
31-Dec-2009 |
31-Dec-2008 |
31-Dec-2007 |
31-Dec-2006 |
|
Period Length |
12 Months |
12 Months |
12 Months |
12 Months |
12 Months |
|
UpdateType/Date |
Updated Normal |
Updated Normal |
Restated Normal |
Reclassified
Normal |
Updated Normal |
|
Filed Currency |
KRW |
KRW |
KRW |
KRW |
KRW |
|
Exchange Rate
(Period Average) |
1 |
1 |
1 |
1 |
1 |
|
Auditor |
KPMG LLP |
KPMG LLP |
KPMG LLP |
KPMG LLP |
KPMG LLP |
|
Auditor Opinion |
Unqualified with
Explanation |
Unqualified |
Unqualified |
Unqualified |
Unqualified |
|
|
|
|
|
|
|
|
Net Income/Starting Line |
1,030,789.0 |
850,094.0 |
1,063,379.1 |
646,405.1 |
648,930.0 |
|
Depreciation |
147,673.0 |
151,884.0 |
- |
150,867.2 |
132,571.2 |
|
Depreciation/Depletion |
147,673.0 |
151,884.0 |
- |
150,867.2 |
132,571.2 |
|
Amortization of Intangibles |
1,324.0 |
1,492.0 |
- |
4,527.3 |
4,513.2 |
|
Amortization |
1,324.0 |
1,492.0 |
- |
4,527.3 |
4,513.2 |
|
Deferred Taxes |
- |
- |
- |
-8,945.6 |
3,042.7 |
|
Unusual Items |
-93,910.0 |
-7,513.0 |
- |
29,630.2 |
6,855.9 |
|
Equity in Net Earnings (Loss) |
287.0 |
185.0 |
- |
-1,187.8 |
-789.7 |
|
Other Non-Cash Items |
207,015.0 |
363,729.0 |
- |
58,645.9 |
32,620.9 |
|
Non-Cash Items |
113,392.0 |
356,401.0 |
- |
87,088.3 |
38,687.1 |
|
Accounts Receivable |
-51,650.0 |
17,697.0 |
- |
-46,958.4 |
-13,317.4 |
|
Inventories |
10,523.0 |
19,984.0 |
- |
-26,733.7 |
53,197.2 |
|
Prepaid Expenses |
-9,746.0 |
28,738.0 |
- |
-3,265.9 |
-2,719.0 |
|
Other Assets |
- |
- |
- |
-109,877.6 |
-69.7 |
|
Accounts Payable |
-23,947.0 |
-122,072.0 |
- |
66,562.8 |
-18,981.7 |
|
Accrued Expenses |
-25,193.0 |
-20,147.0 |
- |
137,672.5 |
3,205.2 |
|
Taxes Payable |
- |
- |
- |
35,909.3 |
56,551.1 |
|
Other Liabilities |
-94,458.0 |
-100,229.0 |
- |
-29,150.3 |
-32,563.1 |
|
Other Operating Cash Flow |
-253,595.8 |
-352,729.1 |
-365,569.5 |
- |
- |
|
Changes in Working Capital |
-448,066.8 |
-528,758.1 |
-365,569.5 |
24,158.6 |
45,302.5 |
|
Cash from Operating Activities |
845,111.2 |
831,112.9 |
697,809.6 |
904,100.8 |
873,046.7 |
|
|
|
|
|
|
|
|
Purchase of Fixed Assets |
-211,635.8 |
-152,571.2 |
-205,871.4 |
-271,144.4 |
-284,995.2 |
|
Purchase/Acquisition of Intangibles |
-13,606.3 |
-5,892.2 |
-6,382.3 |
-2,407.9 |
-931.8 |
|
Capital Expenditures |
-225,242.1 |
-158,463.4 |
-212,253.8 |
-273,552.3 |
-285,927.0 |
|
Sale of Fixed Assets |
136,556.1 |
18,637.6 |
23,107.4 |
26,795.8 |
21,715.1 |
|
Sale/Maturity of Investment |
265,677.8 |
2,347.5 |
348.7 |
14,070.8 |
289,985.2 |
|
Purchase of Investments |
-39,923.4 |
-12,495.5 |
-19,598.8 |
-246,904.7 |
-11,011.4 |
|
Sale of Intangible Assets |
1,016.1 |
63.9 |
35.5 |
204.5 |
20.1 |
|
Other Investing Cash Flow |
16,267.5 |
1,514.3 |
-3,258.9 |
77,162.2 |
-24,791.2 |
|
Other Investing Cash Flow Items, Total |
379,594.1 |
10,067.8 |
633.9 |
-128,671.3 |
275,917.8 |
|
Cash from Investing Activities |
154,352.0 |
-148,395.6 |
-211,619.9 |
-402,223.7 |
-10,009.2 |
|
|
|
|
|
|
|
|
Other Financing Cash Flow |
-4,052.3 |
-5,615.6 |
-5,777.5 |
-3,272.4 |
5,865.8 |
|
Financing Cash Flow Items |
-4,052.3 |
-5,615.6 |
-5,777.5 |
-3,272.4 |
5,865.8 |
|
Total Cash Dividends Paid |
-356,156.6 |
-360,356.6 |
-340,449.2 |
-319,712.0 |
-249,702.7 |
|
Sale/Issuance of
Common |
45,083.1 |
- |
- |
253,103.3 |
76,767.5 |
|
Repurchase/Retirement
of Common |
- |
-103,998.9 |
-194,128.1 |
-455,034.7 |
-857,777.5 |
|
Common Stock, Net |
45,083.1 |
-103,998.9 |
-194,128.1 |
-201,931.5 |
-781,010.0 |
|
Issuance (Retirement) of Stock, Net |
45,083.1 |
-103,998.9 |
-194,128.1 |
-201,931.5 |
-781,010.0 |
|
Short Term Debt Issued |
45,832.3 |
75,261.6 |
80,905.0 |
183,977.9 |
140,192.2 |
|
Short Term Debt
Reduction |
-62,941.3 |
-83,227.1 |
-64,735.9 |
-226,662.3 |
-125,527.3 |
|
Short Term Debt, Net |
-17,109.0 |
-7,965.5 |
16,169.1 |
-42,684.4 |
14,664.9 |
|
Long Term Debt Issued |
- |
- |
22.0 |
1,541.0 |
105.0 |
|
Long Term Debt
Reduction |
-429.1 |
-280.4 |
-210.3 |
- |
- |
|
Long Term Debt, Net |
-429.1 |
-280.4 |
-188.3 |
1,541.0 |
105.0 |
|
Issuance (Retirement) of Debt, Net |
-17,538.1 |
-8,245.9 |
15,980.8 |
-41,143.4 |
14,769.9 |
|
Cash from Financing Activities |
-332,664.0 |
-478,217.1 |
-524,374.0 |
-566,059.2 |
-1,010,077.0 |
|
|
|
|
|
|
|
|
Foreign Exchange Effects |
-2,157.3 |
1,926.6 |
2,211.3 |
- |
- |
|
Net Change in Cash |
664,642.0 |
206,426.9 |
-35,973.0 |
-64,182.1 |
-147,039.5 |
|
|
|
|
|
|
|
|
Net Cash - Beginning Balance |
316,671.8 |
110,244.9 |
146,217.9 |
201,869.2 |
348,908.7 |
|
Net Cash - Ending Balance |
981,313.8 |
316,671.8 |
110,244.9 |
137,687.1 |
201,869.2 |
|
Cash Interest Paid |
2,717.1 |
4,976.3 |
4,254.7 |
- |
- |
|
Cash Taxes Paid |
253,596.2 |
352,728.7 |
365,569.5 |
- |
- |
Annual Income Statement
Financials in: REP (mil)
Except for share items (millions) and per share items (actual units)
|
|
31-Dec-2010 |
31-Dec-2009 |
31-Dec-2008 |
31-Dec-2007 |
31-Dec-2006 |
|
Period Length |
12 Months |
12 Months |
12 Months |
12 Months |
12 Months |
|
UpdateType/Date |
Updated Normal |
Updated Normal |
Restated Normal |
Updated Normal |
Updated Normal |
|
Filed Currency |
KRW |
KRW |
KRW |
KRW |
KRW |
|
Exchange Rate
(Period Average) |
1 |
1 |
1 |
1 |
1 |
|
Auditor |
KPMG LLP |
KPMG LLP |
KPMG LLP |
KPMG LLP |
KPMG LLP |
|
Auditor Opinion |
Unqualified with
Explanation |
Unqualified |
Unqualified |
Unqualified |
Unqualified |
|
|
|
|
|
|
|
|
Sales Revenue |
3,461,418.4 |
3,626,353.0 |
3,312,319.2 |
3,046,384.2 |
2,816,117.4 |
|
Total Revenue |
3,461,418.4 |
3,626,353.0 |
3,312,319.2 |
3,046,384.2 |
2,816,117.4 |
|
|
|
|
|
|
|
|
Other Income |
- |
- |
-118,859.4 |
1,313,029.3 |
1,248,129.0 |
|
Costs of Goods and Services Sold |
1,446,708.4 |
1,553,264.1 |
1,312,531.6 |
- |
- |
|
Interal Employee Benefits Fund |
12,492.2 |
19,500.0 |
21,000.0 |
- |
- |
|
Selling and Administrative Expenses |
- |
- |
809,681.3 |
- |
- |
|
Salaries & Wages |
238,856.0 |
243,377.0 |
- |
216,933.6 |
201,486.8 |
|
Retirement Allowance |
55,460.0 |
26,857.0 |
- |
26,234.4 |
34,716.8 |
|
Employee Benefits |
28,167.0 |
27,463.0 |
- |
34,783.4 |
30,742.4 |
|
Commissions Paid |
145,542.0 |
132,005.0 |
- |
86,284.8 |
83,446.8 |
|
Travel Expenses |
10,885.0 |
9,337.0 |
- |
8,474.2 |
6,921.6 |
|
Utility Expenses |
7,085.0 |
6,615.0 |
- |
6,229.9 |
5,903.3 |
|
Taxes and Dues |
17,492.0 |
17,427.0 |
- |
21,027.9 |
20,845.4 |
|
Communication Exp. |
5,177.0 |
5,135.0 |
- |
4,736.6 |
4,366.7 |
|
Rent |
21,061.0 |
18,049.0 |
- |
8,804.0 |
6,205.9 |
|
Insurance Expenses |
1,286.0 |
1,224.0 |
- |
1,308.8 |
1,381.6 |
|
Entertainment |
- |
- |
- |
2,509.1 |
1,927.3 |
|
Expenses-Samples |
- |
- |
- |
15.6 |
18.0 |
|
Shipping and Storage Expenses |
36,840.0 |
32,062.0 |
- |
30,457.7 |
26,830.2 |
|
Expenses-Consumable Goods |
3,542.0 |
5,050.0 |
- |
3,502.9 |
3,138.4 |
|
Expenses-Uniforms |
- |
- |
- |
162.4 |
153.9 |
|
Repair & Maintenance |
8,075.0 |
5,264.0 |
- |
10,509.0 |
5,425.5 |
|
Vehicle Expenses |
8,877.0 |
9,081.0 |
- |
7,539.0 |
7,577.2 |
|
Education & Training |
10,158.0 |
7,482.0 |
- |
9,461.0 |
7,789.3 |
|
Conference Expenses |
3,507.0 |
5,455.0 |
- |
6,917.2 |
7,960.0 |
|
Award Expenses |
- |
- |
- |
2,107.9 |
2,278.6 |
|
Miscellaneous Expenses |
- |
- |
50,061.2 |
1,055.2 |
1,089.2 |
|
Damage Compensation Expense |
2,769.0 |
1,669.0 |
- |
6.5 |
3.0 |
|
Cooperating Expenses |
- |
- |
- |
797.1 |
631.8 |
|
Exporting Expenses |
- |
- |
- |
589.1 |
487.1 |
|
Advertising Expense |
245,802.0 |
219,332.0 |
- |
172,050.4 |
171,069.7 |
|
Research&Testing Exp |
- |
- |
- |
17,348.3 |
14,799.8 |
|
Development Expense |
21,550.0 |
20,345.0 |
- |
5,486.0 |
6,121.1 |
|
Depreciation Expense |
47,704.0 |
53,118.0 |
- |
56,243.1 |
49,104.2 |
|
Amort of Intangibles |
1,219.0 |
1,378.0 |
- |
4,508.4 |
4,494.3 |
|
Provision-Bad Debt |
- |
- |
- |
7,241.9 |
3,849.6 |
|
Loss on Reduction of Securities Avail |
- |
- |
- |
2,163.1 |
2,363.8 |
|
Loss on Reduction of Tangible Assets |
- |
- |
- |
2,179.1 |
204.8 |
|
Loss on Reduction of Intangible Asset |
- |
- |
- |
1,065.8 |
- |
|
Selling&Administrative Expense, Adjustme |
-0.3 |
-0.2 |
- |
- |
- |
|
Gain on Foreign Currency Transaction |
-21,590.0 |
-30,204.0 |
- |
- |
- |
|
Gain on Foreign Currency Translation |
-1,717.0 |
-1,184.0 |
- |
- |
- |
|
Recovery-Impair.oss on Trade Recei& |
-216.0 |
-46.0 |
- |
- |
- |
|
Gain on Sale of Equity Method Securities |
-300.0 |
0.0 |
- |
- |
- |
|
Gain on Sale of Tangible Asset |
-101,886.0 |
-17,033.0 |
- |
- |
- |
|
Gain on Sale of Intangible Assets |
-24.0 |
0.0 |
- |
- |
- |
|
Other Operating Income |
-13,874.0 |
-13,029.0 |
- |
- |
- |
|
Other Income, Adjustment |
-0.4 |
-0.1 |
- |
- |
- |
|
Loss on Foreign Currency Transaction |
23,880.0 |
40,697.0 |
- |
- |
- |
|
Loss on Foreign Currency Translation |
5,755.0 |
17,708.0 |
- |
- |
- |
|
Loss Reduction of Trade Recei.&Other Rec |
473.0 |
720.0 |
- |
- |
- |
|
Donation Paid |
30,934.0 |
32,628.0 |
- |
- |
- |
|
Loss on Sale of Tangible Assets |
2,386.0 |
7,496.0 |
- |
- |
- |
|
Loss Reduction of Tangible Assets |
0.0 |
657.0 |
- |
- |
- |
|
Loss on Sale of Intangible Assets |
159.0 |
0.0 |
- |
- |
- |
|
Loss Reduction of Intangible Assets |
3,681.0 |
647.0 |
- |
- |
- |
|
Loss Reduction of Investment Properties |
1,437.0 |
0.0 |
- |
- |
- |
|
Loss-Scrapping of Inventory |
6,251.0 |
4,154.0 |
- |
- |
- |
|
Other Expense |
5,721.0 |
6,918.0 |
- |
- |
- |
|
Other Expense, Adjustment |
0.4 |
-0.2 |
- |
- |
- |
|
Total Operating Expense |
2,321,324.3 |
2,470,617.6 |
2,074,414.7 |
2,071,762.9 |
1,961,463.1 |
|
|
|
|
|
|
|
|
Financial Income |
- |
- |
21,251.7 |
41,497.0 |
43,276.1 |
|
Interest Income |
23,541.0 |
12,052.0 |
- |
- |
- |
|
Dividend Income |
2,056.0 |
215.0 |
- |
516.6 |
- |
|
Gain on Derivatives Transactions |
- |
- |
- |
133.2 |
- |
|
Gain-Investment on LT Deposit |
4,637.0 |
23.0 |
- |
- |
- |
|
Gain on Sale of Available for Sale Finan |
240,104.0 |
563.0 |
- |
- |
- |
|
Rental Income |
- |
0.3 |
- |
400.9 |
343.1 |
|
Financial Income, Adjustment |
-0.2 |
- |
- |
- |
- |
|
NI Gain on Disposal of Tangible Assets |
- |
- |
- |
10,237.1 |
8,348.8 |
|
Gain-Disposal of Other LT Assets |
- |
- |
- |
141.2 |
- |
|
NI Gain on Disposal of Securities Availa |
- |
- |
- |
10,840.0 |
1,790.2 |
|
Gain on Foreign Exchange Transaction |
- |
- |
- |
3,239.7 |
2,481.2 |
|
Gain on Foreign Currency Translation |
- |
- |
- |
2,625.4 |
59.1 |
|
Gain on Coversion of Convertible Bond |
- |
- |
- |
- |
1,875.9 |
|
Gains from Franchises |
- |
- |
- |
382.0 |
252.0 |
|
Recovery of Loan Loss Reserve |
- |
- |
- |
1,913.4 |
28,720.0 |
|
Recovery of Tariffs |
- |
- |
- |
- |
56,070.0 |
|
Interest Expense |
-3,255.0 |
-4,815.0 |
- |
- |
- |
|
Loss on Sale of Available for Sale Finan |
-1,214.0 |
0.0 |
- |
- |
- |
|
Loss on Derivative Transaction |
0.0 |
-1,711.0 |
- |
- |
- |
|
Financial Expense, Adjustment |
-0.1 |
0.1 |
- |
- |
- |
|
Loss on Disposal of Accounts Receivab |
- |
- |
- |
-483.2 |
-427.5 |
|
Miscellaneous Non-Operating Income |
- |
- |
- |
8,046.9 |
30,433.0 |
|
Financial Expense |
- |
- |
-13,711.2 |
-4,501.7 |
-3,856.3 |
|
Loss on Disposal of Tangible Assets |
- |
- |
- |
-4,845.4 |
-7,591.0 |
|
Loss on Disposal of Securities Availa |
- |
- |
- |
-727.0 |
- |
|
Loss on Foreign Exchange Transaction |
- |
- |
- |
-3,730.1 |
-8,235.6 |
|
Loss on Foreign Currency Translation |
- |
- |
- |
-212.1 |
-3,435.3 |
|
Loss on Derivatives Transaction |
- |
- |
- |
-108.3 |
- |
|
Loss on Valuation of Derivatives |
- |
- |
- |
-24.5 |
- |
|
Trnsfr-Tobacco Fund |
- |
- |
- |
-35,516.4 |
-18,730.2 |
|
Provision for Litigation Loss |
- |
- |
- |
-364.0 |
- |
|
NE Bad Debt Expense |
- |
- |
- |
-1,218.9 |
-2,331.9 |
|
NE Loss on Scrap of Inventories |
- |
- |
- |
-814.2 |
-257.3 |
|
Loss on Prior Period Error Correction |
- |
- |
- |
-20,958.9 |
- |
|
Addl Income Tax Paid |
- |
- |
- |
- |
-1,021.6 |
|
Donations Paid |
- |
- |
- |
-30,293.2 |
-104,007.3 |
|
Provision-Voluntary Retirement Allowa |
- |
- |
- |
- |
-1,934.5 |
|
Miscellaneous Non-Operating Expense |
- |
- |
- |
-14,185.7 |
-6,638.8 |
|
Gain under Equity Method |
- |
- |
- |
1,187.8 |
789.7 |
|
Gain on Disposal of Secs/Equity Mtd. |
- |
- |
- |
- |
17,428.3 |
|
Share of Profit of Associates Accounted |
0.0 |
6.5 |
6.1 |
- |
- |
|
Share of Loss of Associates Accounted fo |
-287.9 |
-191.3 |
-323.6 |
- |
- |
|
Net Income Before Taxes |
1,405,674.9 |
1,161,878.1 |
1,245,127.5 |
937,798.8 |
888,054.5 |
|
|
|
|
|
|
|
|
Provision for Income Taxes |
374,886.3 |
311,783.7 |
349,998.9 |
291,393.7 |
242,066.6 |
|
Net Income After Taxes |
1,030,788.6 |
850,094.3 |
895,128.6 |
646,405.1 |
645,987.8 |
|
|
|
|
|
|
|
|
Minority Interest Gain |
1,034.8 |
996.3 |
2,648.5 |
16,200.6 |
2,942.1 |
|
Net Income Before Extra. Items |
1,031,823.4 |
851,090.6 |
897,777.0 |
662,605.6 |
648,930.0 |
|
Net Income |
1,031,823.4 |
851,090.6 |
897,777.0 |
662,605.6 |
648,930.0 |
|
|
|
|
|
|
|
|
Income Available to Com Excl ExtraOrd |
1,031,823.4 |
851,090.6 |
897,777.0 |
662,605.6 |
648,930.0 |
|
|
|
|
|
|
|
|
Income Available to Com Incl ExtraOrd |
1,031,823.4 |
851,090.6 |
897,777.0 |
662,605.6 |
648,930.0 |
|
|
|
|
|
|
|
|
Basic Weighted Average Shares |
127.3 |
128.4 |
130.1 |
132.4 |
141.0 |
|
Basic EPS Excluding ExtraOrdinary Items |
8,108.52 |
6,629.86 |
6,898.52 |
5,002.97 |
4,603.19 |
|
Basic EPS Including ExtraOrdinary Item |
8,108.52 |
6,629.86 |
6,898.52 |
5,002.97 |
4,603.19 |
|
Diluted Net Income |
1,031,823.4 |
851,090.6 |
897,777.0 |
662,605.6 |
648,930.0 |
|
Diluted Weighted Average Shares |
127.3 |
128.4 |
130.1 |
132.4 |
141.0 |
|
Diluted EPS Excluding ExtraOrd Items |
8,108.52 |
6,629.86 |
6,898.52 |
5,002.97 |
4,603.19 |
|
Diluted EPS Including ExtraOrd Items |
8,108.52 |
6,629.86 |
6,898.52 |
5,002.97 |
4,603.19 |
|
DPS-Common Stock |
3,000.00 |
2,800.00 |
2,800.00 |
2,600.00 |
2,400.00 |
|
Gross Dividends - Common Stock |
382,946.0 |
356,157.0 |
360,357.0 |
340,449.0 |
319,712.0 |
|
Normalized Income Before Taxes |
1,315,329.9 |
1,158,164.1 |
1,245,127.5 |
941,464.6 |
893,095.5 |
|
|
|
|
|
|
|
|
Inc Tax Ex Impact of Sp Items |
350,791.7 |
310,787.1 |
349,998.9 |
291,609.9 |
242,631.2 |
|
Normalized Income After Taxes |
964,538.2 |
847,377.0 |
895,128.6 |
649,854.7 |
650,464.3 |
|
|
|
|
|
|
|
|
Normalized Inc. Avail to Com. |
965,572.9 |
848,373.3 |
897,777.0 |
666,055.2 |
653,406.5 |
|
|
|
|
|
|
|
|
Basic Normalized EPS |
7,587.89 |
6,608.69 |
6,898.52 |
5,029.02 |
4,634.94 |
|
Diluted Normalized EPS |
7,587.89 |
6,608.69 |
6,898.52 |
5,029.02 |
4,634.94 |
|
Interest Expense, Supplemental |
4,469.1 |
4,815.0 |
4,714.0 |
4,501.7 |
3,856.3 |
|
Rental Expense, Supplemental |
21,061.0 |
18,049.0 |
13,922.0 |
8,804.0 |
6,205.9 |
|
R&D Expense, Supplemental |
21,550.0 |
20,345.0 |
21,908.0 |
22,834.3 |
20,920.9 |
|
Advertising Expense |
245,802.0 |
219,332.0 |
198,861.0 |
172,050.4 |
171,069.7 |
|
Depreciation |
147,673.0 |
151,884.0 |
151,151.0 |
150,867.2 |
132,571.2 |
|
Amort of Intangibles |
1,324.0 |
1,492.0 |
2,034.0 |
1,557.3 |
4,513.2 |
|
Amortization of Acquisition Costs |
- |
- |
- |
2,970.0 |
2,970.0 |
Annual Balance
Sheet
Financials in: KRW (mil)
|
|
31-Dec-2010 |
31-Dec-2009 |
31-Dec-2008 |
31-Dec-2007 |
31-Dec-2006 |
|
UpdateType/Date |
Updated
Normal |
Updated
Normal |
Restated
Normal |
Updated
Normal |
Updated
Normal |
|
Filed Currency |
KRW |
KRW |
KRW |
KRW |
KRW |
|
Exchange Rate |
1 |
1 |
1 |
1 |
1 |
|
Auditor |
KPMG LLP |
KPMG LLP |
KPMG LLP |
KPMG LLP |
KPMG LLP |
|
Auditor Opinion |
Unqualified with
Explanation |
Unqualified |
Unqualified |
Unqualified |
Unqualified |
|
|
|
|
|
|
|
|
Cash and
CashEquivalents |
981,313.8 |
316,671.8 |
110,244.9 |
137,687.1 |
201,869.2 |
|
Other Financial
Assets, current |
15,272.8 |
925.8 |
1,717.1 |
- |
- |
|
ST Finl Assets |
- |
- |
- |
1,000.0 |
1,000.0 |
|
ST Secs for Sale |
1,000.0 |
1,956.8 |
2,148.6 |
91.9 |
555.0 |
|
Trade Rcvb Gross |
543,789.0 |
529,532.0 |
558,568.0 |
381,223.9 |
394,335.0 |
|
Doubtful Account |
-6,875.0 |
-8,035.0 |
-7,869.0 |
-11,419.6 |
-39,306.0 |
|
ST Loans Shrhldr |
19,300.0 |
24,031.0 |
28,036.0 |
19,503.8 |
19,254.8 |
|
ST Loan, Net |
898.0 |
1,242.0 |
1,073.0 |
1,094.4 |
99,646.7 |
|
Other Rcvbls |
69,027.0 |
55,663.0 |
55,154.0 |
34,054.8 |
25,517.2 |
|
Doubtful
Account-Account Rcvbls |
-1,934.0 |
-2,202.0 |
-1,706.0 |
- |
- |
|
Trade Guarantee |
- |
0.0 |
0.0 |
- |
122.4 |
|
Accrued Income |
2,204.0 |
573.0 |
384.0 |
326.5 |
242.3 |
|
Adjustment |
-0.2 |
-0.4 |
-0.2 |
- |
- |
|
Advance Payments |
41,544.0 |
43,614.4 |
30,988.6 |
23,715.6 |
30,292.1 |
|
Prepaid Expenses
Total |
22,361.2 |
11,805.1 |
3,700.6 |
9,374.7 |
7,025.8 |
|
Receivable-Recovery
of Taxes |
- |
- |
- |
34.2 |
395.7 |
|
Prepaid Taxes on
Cigarette Consumption |
177,043.1 |
169,440.4 |
201,773.9 |
- |
- |
|
Fixed Assets
Reduction Provision |
- |
46,152.2 |
22,906.5 |
- |
- |
|
Deferred Income
Tax, Current Assets |
- |
- |
- |
17,604.5 |
8,225.9 |
|
Merchandises |
7,914.0 |
2,623.0 |
793.0 |
1,107.5 |
1,439.6 |
|
Finished Goods |
238,009.0 |
207,308.0 |
183,668.0 |
134,163.8 |
136,230.7 |
|
Work in Progress |
312,920.0 |
318,780.0 |
296,072.0 |
259,058.7 |
218,190.3 |
|
Raw Materials |
869,053.0 |
878,360.0 |
842,193.0 |
804,740.6 |
878,729.1 |
|
Stored Goods |
25,941.0 |
25,256.0 |
23,269.0 |
21,855.8 |
19,751.1 |
|
Residual Products |
7,542.0 |
5,650.0 |
3,242.0 |
2,640.9 |
4,267.1 |
|
Finished Housing |
- |
53,816.0 |
0.0 |
- |
- |
|
Unfinished Housing |
381.0 |
0.0 |
182,059.0 |
- |
- |
|
CA Land |
9,449.0 |
0.0 |
17,613.0 |
13,204.0 |
11,570.9 |
|
Goods in Transit |
25,825.0 |
17,286.0 |
9,976.0 |
8,064.6 |
12,949.5 |
|
Adjustment |
-0.4 |
-0.2 |
-0.1 |
- |
- |
|
Semi-finish Good |
- |
- |
- |
20,170.3 |
13,328.5 |
|
Assistance Mat. |
- |
- |
- |
548.0 |
567.2 |
|
Unsold Comm Prop |
- |
- |
- |
52,150.4 |
2,744.7 |
|
Total Current
Assets |
3,361,977.3 |
2,700,448.8 |
2,566,005.0 |
1,931,996.5 |
2,048,944.7 |
|
|
|
|
|
|
|
|
LT Finl Assets |
646.3 |
286.3 |
6.3 |
43.7 |
43.8 |
|
Investment in
Properties |
121,482.7 |
104,115.5 |
107,330.7 |
- |
- |
|
Financial Assets
Available for Sale |
314,176.7 |
442,083.0 |
302,121.2 |
257,097.6 |
71,156.2 |
|
LT Trade
Receivable |
114,539.5 |
130,046.6 |
138,379.1 |
84.7 |
- |
|
LT Account
Receivable |
- |
- |
- |
1,017.4 |
- |
|
LT Interest Rcvb |
- |
- |
- |
- |
26.5 |
|
Equity Method
Securities |
1,596.5 |
1,584.4 |
1,270.2 |
35,969.1 |
1,111.0 |
|
LT Loans |
- |
- |
- |
2,771.8 |
2,013.7 |
|
Other Investment
Assets |
- |
- |
- |
2,577.7 |
25,317.2 |
|
LT Security
Deposit |
- |
- |
- |
51,162.1 |
42,265.0 |
|
LT Deposits |
- |
- |
- |
- |
1,003.2 |
|
Long-Term Prepaid
Expenses |
6,280.7 |
6,411.2 |
6,282.3 |
- |
- |
|
LT Loans Shrhldr |
- |
- |
- |
96,167.8 |
61,407.7 |
|
Long-term Advance
Payments |
138,895.7 |
133,361.9 |
118,240.3 |
96,492.8 |
81,745.9 |
|
LT Affiliat Loan |
- |
- |
- |
238.4 |
1,487.5 |
|
LT Deposit
Withheld |
132,413.6 |
118,121.4 |
110,261.1 |
66,632.5 |
45,611.0 |
|
Land |
436,950.0 |
437,143.0 |
436,527.0 |
431,727.8 |
381,943.7 |
|
Buildings |
761,383.0 |
699,249.0 |
673,719.0 |
735,932.4 |
689,849.3 |
|
Buildings Depre. |
-265,030.0 |
-236,698.0 |
-210,289.0 |
-212,194.2 |
-189,704.0 |
|
Buildings-Reduction |
- |
- |
- |
-36.1 |
-198.1 |
|
Structures |
64,264.0 |
59,717.0 |
59,697.0 |
56,482.8 |
54,101.2 |
|
Structure Depre. |
-32,217.0 |
-30,234.0 |
-28,216.0 |
-27,250.2 |
-25,537.2 |
|
Structures-Reduction |
- |
- |
- |
-4.5 |
-6.7 |
|
Machinery/Equip. |
994,532.0 |
968,088.0 |
954,593.0 |
892,064.1 |
804,969.3 |
|
Mach/Equip Depre |
-613,152.0 |
-574,301.0 |
-530,235.0 |
-500,275.9 |
-435,208.2 |
|
Machinery &
Equipment-Reduction |
- |
- |
- |
-1,085.0 |
- |
|
Transport Equip. |
8,903.0 |
13,001.0 |
17,445.0 |
19,035.4 |
20,906.0 |
|
Transport Deprec |
-7,114.0 |
-11,490.0 |
-14,864.0 |
-15,681.5 |
-15,034.4 |
|
Tools/Equipments |
46,069.0 |
45,837.0 |
47,936.0 |
42,050.2 |
35,745.2 |
|
Tool/Equip Depr. |
-33,903.0 |
-33,716.0 |
-32,795.0 |
-28,721.6 |
-24,222.1 |
|
Tools &
Equipments, Reduction |
- |
- |
- |
-0.2 |
- |
|
Fixtures |
192,459.0 |
225,148.0 |
195,523.0 |
207,008.9 |
167,206.3 |
|
Deprec. Fixtures |
-132,444.0 |
-160,273.0 |
-122,914.0 |
-124,560.7 |
-87,278.3 |
|
Other Tangible
Assets |
749.0 |
744.0 |
744.0 |
744.2 |
605.0 |
|
Construct in Pro |
89,389.0 |
69,340.0 |
57,120.0 |
85,147.2 |
84,606.9 |
|
Construction in
Progress-Reduction |
- |
- |
- |
-1,093.9 |
- |
|
Adjustment |
-0.1 |
0.2 |
-0.4 |
- |
- |
|
Deferred Income
Taxes Assets Non-current |
11,066.9 |
8,169.1 |
7,108.7 |
1,764.7 |
- |
|
Indust.-Patent |
2,049.0 |
1,481.0 |
1,847.0 |
2,223.8 |
3,713.7 |
|
Usage
Right-Facility |
24,189.0 |
20,750.0 |
19,964.0 |
- |
- |
|
Other
Intangible |
4,194.0 |
2,981.0 |
2,951.0 |
2,428.0 |
1,557.5 |
|
Intangible
Assets-under Development |
32,713.0 |
30,488.0 |
27,172.0 |
- |
- |
|
Adjustment |
0.2 |
-0.1 |
-0.1 |
- |
- |
|
Goodwill |
- |
- |
- |
4,007.4 |
6,977.2 |
|
Membership
Right |
- |
- |
- |
22,137.0 |
- |
|
Total Assets |
5,777,059.1 |
5,171,883.2 |
4,912,929.4 |
4,134,102.1 |
3,857,125.8 |
|
|
|
|
|
|
|
|
Accounts Payable |
- |
- |
- |
105,692.9 |
30,548.0 |
|
Trade Acct. Pay. |
301,211.2 |
326,598.2 |
455,332.6 |
15,201.8 |
14,896.3 |
|
Inc. Taxes Pay. |
222,932.3 |
128,418.8 |
187,609.9 |
220,427.5 |
135,654.4 |
|
Accrd Cigaret Tx |
324,857.0 |
350,049.8 |
370,196.9 |
181,734.2 |
55,387.9 |
|
Accrued Expenses |
- |
- |
- |
17,342.8 |
10,518.9 |
|
Advance for
Customers |
9,334.7 |
23,516.0 |
71,708.0 |
6,126.8 |
7,998.5 |
|
Unearned Income |
- |
- |
- |
89.0 |
418.3 |
|
Deposit Withheld |
- |
- |
- |
11,763.1 |
15,718.0 |
|
Security Deposit
Withheld |
- |
- |
- |
102.2 |
212.2 |
|
VAT Withheld |
- |
- |
- |
128,985.5 |
128,948.0 |
|
Reserve Liability |
- |
- |
- |
5,108.0 |
2,034.7 |
|
Derivatives in Liabilities,
Current |
- |
- |
2,698.5 |
24.5 |
- |
|
Current Portion of
LT Debt |
505.6 |
447.9 |
280.4 |
210.3 |
- |
|
Short-term
Borrowings |
66,507.2 |
94,532.5 |
104,113.1 |
38,097.2 |
80,785.5 |
|
Total Current
Liabilities |
925,348.0 |
923,563.2 |
1,191,939.4 |
730,905.8 |
483,120.8 |
|
|
|
|
|
|
|
|
Long Term
Borrowings |
1,539.6 |
2,026.4 |
2,474.3 |
2,732.7 |
1,402.0 |
|
Total Long Term
Debt |
1,539.6 |
2,026.4 |
2,474.3 |
2,732.7 |
1,402.0 |
|
|
|
|
|
|
|
|
Long-term Trade
Payables |
22,880.4 |
23,028.1 |
23,580.4 |
- |
- |
|
Long-term Advances
from Customers |
10,935.1 |
10,215.4 |
8,385.7 |
- |
- |
|
LT Guaranteed
Liabilities |
48,324.2 |
35,445.4 |
73,993.6 |
- |
- |
|
Rental Secur Dep |
- |
- |
- |
24,938.4 |
27,460.4 |
|
LT Deposit
Withheld |
- |
- |
- |
112.4 |
64.5 |
|
Deferred Income
Taxes Liabilities Non-cu |
167,502.5 |
167,345.1 |
106,761.9 |
124,534.8 |
103,528.2 |
|
Reserve-Lawsuit |
- |
- |
- |
364.0 |
- |
|
Reserve
Liability-Sales Return |
- |
- |
- |
894.1 |
1,796.9 |
|
LT Reserve |
2,219.8 |
2,256.4 |
1,957.0 |
- |
- |
|
Tobacco Stabil R |
- |
- |
- |
- |
74,483.6 |
|
Retire Reserve |
- |
- |
- |
86,392.5 |
99,506.4 |
|
Minority Interest |
42,130.0 |
27,112.2 |
27,563.8 |
20,117.4 |
20,218.5 |
|
Total
Liabilities |
1,220,879.7 |
1,190,992.2 |
1,436,656.3 |
990,992.1 |
811,581.3 |
|
|
|
|
|
|
|
|
Common Stock |
954,959.5 |
954,959.5 |
954,959.5 |
954,959.5 |
954,959.5 |
|
Other Capital
Surplus |
5,332.7 |
5,320.5 |
2,869.3 |
465,866.0 |
335,349.6 |
|
Treasury Stock |
-216,827.0 |
-226,944.7 |
-226,944.7 |
-414,947.3 |
-321,903.9 |
|
Gains on Sale of
Treasury Stock |
482,128.5 |
468,274.4 |
468,274.4 |
- |
- |
|
Reserves |
2,179,227.1 |
2,075,268.8 |
1,825,708.4 |
- |
- |
|
Retained Earning
Carried Forward |
1,151,358.6 |
704,012.5 |
451,406.4 |
2,134,736.0 |
2,061,348.6 |
|
G-Sec for Sale V |
- |
- |
- |
2,100.2 |
15,929.3 |
|
G-Inv. Secs. Under
Equity Method Valu. |
- |
- |
- |
1,034.8 |
1,009.0 |
|
Overseas Business
Translation Credit |
- |
- |
- |
-639.2 |
-1,147.5 |
|
Total Equity |
4,556,179.4 |
3,980,891.0 |
3,476,273.2 |
3,143,110.0 |
3,045,544.5 |
|
|
|
|
|
|
|
|
Total
Liabilities & Shareholders' Equity |
5,777,059.1 |
5,171,883.2 |
4,912,929.4 |
4,134,102.1 |
3,857,125.8 |
|
|
|
|
|
|
|
|
S/O-Common Stock |
127.6 |
127.2 |
128.7 |
130.8 |
133.2 |
|
Total Common
Shares Outstanding |
127.6 |
127.2 |
128.7 |
130.8 |
133.2 |
|
T/S-Common Stock |
9.6 |
10.1 |
10.1 |
12.6 |
14.2 |
|
Deferred Revenue, Current |
9,334.7 |
23,516.0 |
71,708.0 |
6,215.8 |
8,416.8 |
|
Accu. Intangible Amort&Impair, Supple. |
20,105.0 |
15,217.0 |
- |
- |
- |
|
Full-Time Employees |
4,214 |
4,653 |
4,750 |
4,367 |
4,317 |
|
Number of Common Shareholders |
104,382 |
132,863 |
105,512 |
107,629 |
120,524 |
|
Long Term Debt Maturing within 1 Year |
505.6 |
447.9 |
280.0 |
210.0 |
- |
|
Long Term Debt Maturing within 2 Years |
- |
- |
448.0 |
280.0 |
195.0 |
|
Long Term Debt Maturing within 3 Years |
- |
- |
504.0 |
446.0 |
259.0 |
|
Long Term Debt Maturing within 4 Years |
- |
- |
504.0 |
501.0 |
259.0 |
|
Long Term Debt Remaining Maturities |
- |
- |
1,018.0 |
1,506.0 |
689.0 |
|
Total Long Term Debt, Supplemental |
505.6 |
447.9 |
2,754.0 |
2,943.0 |
1,402.0 |
Annual Cash Flows
Financials in: KRW (mil)
|
|
31-Dec-2010 |
31-Dec-2009 |
31-Dec-2008 |
31-Dec-2007 |
31-Dec-2006 |
|
Period Length |
12 Months |
12 Months |
12 Months |
12 Months |
12 Months |
|
UpdateType/Date |
Updated
Normal |
Updated
Normal |
Restated
Normal |
Reclassified
Normal |
Updated
Normal |
|
Filed Currency |
KRW |
KRW |
KRW |
KRW |
KRW |
|
Exchange Rate
(Period Average) |
1 |
1 |
1 |
1 |
1 |
|
Auditor |
KPMG LLP |
KPMG LLP |
KPMG LLP |
KPMG LLP |
KPMG LLP |
|
Auditor Opinion |
Unqualified with
Explanation |
Unqualified |
Unqualified |
Unqualified |
Unqualified |
|
|
|
|
|
|
|
|
Net Income |
1,030,789.0 |
850,094.0 |
1,063,379.1 |
646,405.1 |
648,930.0 |
|
Depreciation |
147,673.0 |
151,884.0 |
- |
150,867.2 |
132,571.2 |
|
Corporate Tax |
374,886.0 |
311,784.0 |
- |
- |
- |
|
Financial Expense |
4,469.0 |
6,526.0 |
- |
- |
- |
|
Financial Income |
-270,338.0 |
-12,853.0 |
- |
- |
- |
|
Amort. Intangible |
1,324.0 |
1,492.0 |
- |
4,527.3 |
4,513.2 |
|
Amort-Bad Debt
Exp. |
- |
- |
- |
7,241.9 |
3,849.6 |
|
Donations |
- |
- |
- |
0.1 |
- |
|
Amort-Other Bad
Debt |
- |
- |
- |
1,218.9 |
2,331.9 |
|
Retirement
Allowance |
86,939.0 |
41,541.0 |
- |
40,335.5 |
59,371.9 |
|
Loss-Valuation of
Derivatives |
- |
- |
- |
24.5 |
- |
|
L-Sec for Sale
Disposal |
- |
- |
- |
723.6 |
427.5 |
|
L-Sec for Sale
Redct |
- |
- |
- |
2,163.1 |
2,363.8 |
|
L-For Exch
Translatn |
5,755.0 |
17,708.0 |
- |
219.4 |
3,435.3 |
|
Loss-Disposal of
Trade Receivable |
- |
- |
- |
483.2 |
- |
|
L-Inventory
Scrapping |
- |
- |
- |
814.2 |
257.3 |
|
Loss on Valuation
of Inventory |
164.0 |
- |
- |
38,221.6 |
23,578.8 |
|
Loss Redu.of Trade
Receivable&Other Rece |
473.0 |
720.0 |
- |
- |
- |
|
Disp Tang Asst
Loss |
2,386.0 |
7,496.0 |
- |
4,845.4 |
7,591.0 |
|
L-Tang Asset Redct |
- |
657.0 |
- |
- |
- |
|
Loss-Reduction of
Intangible Assets |
- |
647.0 |
- |
1,065.8 |
- |
|
Loss on Sale of
Intangible Assets |
159.0 |
- |
- |
- |
- |
|
Loss Reduction of
Intangible Assets |
3,681.0 |
- |
- |
- |
- |
|
Loss-Reduction of
Tangible Assets |
- |
- |
- |
2,179.1 |
204.8 |
|
Loss Reduction of
Investment Properties |
1,437.0 |
- |
- |
- |
- |
|
Other Expense |
7,237.0 |
4,154.0 |
- |
- |
- |
|
Transfer-Resrve
Installment |
- |
- |
- |
3,737.1 |
2,034.7 |
|
Provision for
Litigation Loss |
- |
- |
- |
364.0 |
- |
|
Transfr-Tobacco
Fund |
- |
- |
- |
35,516.4 |
18,730.2 |
|
Loss-Prior Period
Error Correction |
- |
- |
- |
20,958.9 |
- |
|
Stock Compensation
Expense |
- |
- |
- |
348.7 |
- |
|
Miscellaneous Loss |
- |
- |
- |
26.5 |
52.6 |
|
Gain on Sec Sales |
- |
- |
- |
-10,840.0 |
-1,790.2 |
|
Loss-Disposal of
Other Fixed Assets |
- |
- |
- |
-141.2 |
- |
|
Gain Disp Tang.
Ast |
-101,886.0 |
-17,033.0 |
- |
-10,237.1 |
-8,348.8 |
|
Gain on Sale of
Intangible Assets |
-24.0 |
- |
- |
- |
- |
|
Gain under Equity
Method |
- |
- |
- |
-1,187.8 |
-789.7 |
|
Gain-Disposal of
Sec. under Equity Mtd. |
-300.0 |
- |
- |
- |
-17,428.3 |
|
Gain-Valu. of
Securities Avail-for-Sale |
- |
- |
- |
-11.4 |
- |
|
Reversal Prov.
Doubt |
- |
- |
- |
-1,913.4 |
-28,720.0 |
|
Recovery-Loss
Reduct.of Trade Recei |
-216.0 |
-46.0 |
- |
- |
- |
|
Recovery-Inventory
Valuation Loss |
- |
-3,807.0 |
- |
-35,001.3 |
-11,779.5 |
|
G-For Curr
Transactn |
- |
- |
- |
-2,621.2 |
-59.1 |
|
Gain on Foreign
Currency Translation |
-1,717.0 |
-1,184.0 |
- |
- |
- |
|
Interest Income |
- |
- |
- |
-11,416.4 |
-11,760.4 |
|
Accrued LT
Interest |
- |
- |
- |
- |
-48.2 |
|
Gain-Convertible
Bonds Conversion |
- |
- |
- |
- |
-1,875.9 |
|
Loss-Minority
Interest |
- |
- |
- |
- |
-2,942.1 |
|
Miscellaneous Gain |
- |
-94.0 |
- |
-29.8 |
- |
|
Inventories |
14,122.0 |
48,067.0 |
- |
-18,927.1 |
44,252.5 |
|
Trade Receivables |
-51,650.0 |
17,697.0 |
- |
-36,651.8 |
-22,025.8 |
|
Accrued Income |
- |
- |
- |
-84.2 |
4,418.4 |
|
Account
Receivables |
- |
- |
- |
-10,222.4 |
4,290.0 |
|
Prepaid Expenses |
-2,143.0 |
-3,595.0 |
- |
-3,626.3 |
-836.4 |
|
Advance Payments |
-3,599.0 |
-28,083.0 |
- |
29,367.8 |
16,270.9 |
|
LT Advance Payment |
- |
- |
- |
-37,174.4 |
-7,326.2 |
|
Corporate Tax
Refundable |
-7,603.0 |
32,333.0 |
- |
360.4 |
-1,882.6 |
|
Trade Guarantee |
- |
- |
- |
122.4 |
-69.7 |
|
Deferred
Taxes-Asset |
- |
- |
- |
-8,945.6 |
3,042.7 |
|
Trade Payables |
-23,947.0 |
-122,072.0 |
- |
-7,786.2 |
-30,423.7 |
|
Account Payables |
- |
- |
- |
74,349.0 |
11,482.1 |
|
Accrued Expenses |
- |
- |
- |
11,288.7 |
-21,059.9 |
|
Accrued Inc Tax |
- |
- |
- |
35,909.3 |
56,551.1 |
|
Tobacco Fund |
- |
- |
- |
-110,000.0 |
- |
|
Decrease-Reserve |
- |
- |
- |
-661.8 |
- |
|
Accrued Cigarette
Consumption Taxes |
-25,193.0 |
-20,147.0 |
- |
126,346.3 |
36,463.1 |
|
Unearned Income |
- |
- |
- |
-929.8 |
-373.8 |
|
LT Account Payable |
- |
- |
- |
- |
-40.0 |
|
Advances Received |
-13,257.0 |
-46,045.0 |
- |
-1,768.2 |
4,292.9 |
|
Deposits Withheld |
- |
- |
- |
-4,790.9 |
-9,268.3 |
|
Security Deposit
Withheld |
- |
- |
- |
-110.0 |
- |
|
VAT Withheld |
- |
- |
- |
37.5 |
-12,198.1 |
|
Nation Pension Fnd |
- |
- |
- |
182.9 |
-10.7 |
|
Retiremt Allow
Paymt |
-81,201.0 |
-54,184.0 |
- |
-21,517.6 |
-13,465.9 |
|
Retirement
Insurance |
- |
- |
- |
-23,790.4 |
-21,154.1 |
|
Deferred Income
Tax Credit, A/L |
- |
- |
- |
24,512.6 |
6,971.6 |
|
Reserve for
Returned Goods |
- |
- |
- |
-298.2 |
876.3 |
|
Oversea Op
Translatn |
- |
- |
- |
21.0 |
-431.3 |
|
Taxes Paid |
-253,596.2 |
-352,728.7 |
-365,569.5 |
- |
- |
|
Gain on Equity
Method Securities |
- |
-6.0 |
- |
- |
- |
|
Loss on Equity
Method Securities |
287.0 |
191.0 |
- |
- |
- |
|
Operating
Activities, Adjustment |
0.5 |
-0.4 |
- |
- |
- |
|
Cash from
Operating Activities |
845,111.2 |
831,112.9 |
697,809.6 |
904,100.8 |
873,046.7 |
|
|
|
|
|
|
|
|
Dec-ST Finl Assets |
- |
- |
- |
11,940.0 |
240,000.0 |
|
Decrease-LT
Financial Assets |
- |
- |
- |
19.2 |
33.3 |
|
Decrease-Loans |
47,795.8 |
25,671.0 |
29,162.2 |
- |
- |
|
Interest Received |
20,547.2 |
10,720.7 |
17,453.0 |
- |
- |
|
Decrease-ST Loans |
- |
- |
- |
1,315.2 |
- |
|
Decrease-LT Loans |
- |
- |
- |
246.9 |
- |
|
Received-Gain on
LT Deposit Investment |
1,243.8 |
- |
- |
- |
- |
|
Decrease-Current
Portion of LT Loans |
- |
- |
- |
111,459.0 |
3,095.4 |
|
Dec-Secs for Sale |
- |
- |
- |
2,005.0 |
9,707.6 |
|
Proceeds from Sale
of Equity Method Secu |
- |
1.1 |
- |
- |
40,147.6 |
|
Dividend Income,
IP |
2,056.4 |
215.3 |
3,458.2 |
- |
- |
|
Decrease in
Deposits Provided |
39,793.2 |
17,307.9 |
12,275.4 |
20,055.8 |
23,777.0 |
|
Proceeds from Sale
of Available for sale |
265,677.8 |
2,346.4 |
348.7 |
- |
- |
|
Dec. Other Inv
Asset |
- |
- |
- |
106.6 |
96.7 |
|
Disposal of
Non-Current Assets Held for |
100,830.4 |
- |
- |
- |
- |
|
Proceeds from Sale
of Property Plant and |
35,725.7 |
18,637.6 |
23,107.4 |
- |
- |
|
Disposal of
Subsidiary Investment |
- |
- |
281.5 |
- |
- |
|
Disposal of Land |
- |
- |
- |
22,111.4 |
10,627.8 |
|
Disposal of
Building |
- |
- |
- |
2,496.0 |
10,140.0 |
|
Disposal Structure |
- |
- |
- |
48.8 |
76.3 |
|
Disposal
Mach./Equip |
- |
- |
- |
1,153.9 |
291.9 |
|
Disposal Trans
Equip |
- |
- |
- |
838.3 |
415.1 |
|
Disp
Tools/Supplies |
- |
- |
- |
35.1 |
105.7 |
|
Disp-Fixtures |
- |
- |
- |
112.3 |
58.2 |
|
Decrease-Membership
Right |
- |
- |
- |
204.5 |
- |
|
Decrease-Intangible
Assets |
1,016.1 |
63.9 |
35.5 |
- |
20.1 |
|
Increase-ST Loans |
- |
- |
- |
-1,787.1 |
- |
|
Inc-LT Finl Assets |
- |
- |
- |
-19.2 |
-12.7 |
|
Increase-Loans |
-16,022.6 |
-10,403.2 |
-22,607.4 |
- |
- |
|
Increase in LT
Loans |
- |
- |
- |
-11,123.7 |
-1,126.8 |
|
Inc LT Shrhldr
Loans |
- |
- |
- |
- |
-5,541.1 |
|
Increase in
Deposits Provided |
-49,004.0 |
-20,187.2 |
-18,401.2 |
-24,375.9 |
-25,154.9 |
|
Increase-LT
Deposit |
-13,625.2 |
-18,054.9 |
-17,895.0 |
-20,415.0 |
-19,840.8 |
|
Purchase of
Derivatives Assets |
- |
-4,409.8 |
-6,319.7 |
- |
- |
|
Purchase of
Available for sale Securitie |
-39,923.4 |
-11,995.5 |
-19,098.8 |
-242,324.2 |
-8,263.6 |
|
Purchase of Equity
Method Securities |
- |
-500.0 |
-500.0 |
- |
- |
|
Inc Other Invt Ast |
- |
- |
- |
-2,774.3 |
-2,735.1 |
|
Purchase of
Investment Properties |
- |
-323.4 |
-222.1 |
- |
- |
|
Purchase of
Property, Plant and Equipmen |
-211,635.8 |
-152,247.8 |
-205,649.4 |
- |
- |
|
Acquisition of
Land |
- |
- |
- |
-22,265.6 |
-21,645.2 |
|
Acquis. of
Building |
- |
- |
- |
-7,683.4 |
-14,349.4 |
|
Purch. of
Structure |
- |
- |
- |
-1,822.3 |
-1,311.9 |
|
Purch. of
Mach/Equip |
- |
- |
- |
-12,262.5 |
-9,132.1 |
|
Acq. of Trans
Equip |
- |
- |
- |
-763.2 |
-639.1 |
|
Acq. in
Tools/Suppl. |
- |
- |
- |
-2,940.0 |
-2,460.8 |
|
Acquis. of
Supplies |
- |
- |
- |
-37,130.1 |
-34,241.8 |
|
Acq. Const. In Prog |
- |
- |
- |
-186,138.2 |
-201,169.4 |
|
Inc-Other Tangible
Assets |
- |
- |
- |
-139.1 |
-45.5 |
|
Purchase of
Intangible Assets |
-13,606.3 |
-5,892.2 |
-6,382.3 |
- |
- |
|
Deduction from
Other Investing Activitie |
-16,517.0 |
654.5 |
-665.9 |
- |
- |
|
Increase-Membership
Right |
- |
- |
- |
-698.0 |
- |
|
Acq Intangible
Asset |
- |
- |
- |
-1,709.9 |
-931.8 |
|
Cash from
Investing Activities |
154,352.0 |
-148,395.6 |
-211,619.9 |
-402,223.7 |
-10,009.2 |
|
|
|
|
|
|
|
|
Interest Paid |
-2,717.1 |
-4,976.3 |
-4,254.7 |
- |
- |
|
Payments in
Dividends |
-356,156.6 |
-360,356.6 |
-340,449.2 |
-319,712.0 |
-249,702.7 |
|
Proceeds from
Short-term Borrowings |
45,832.3 |
75,261.6 |
80,905.0 |
183,977.9 |
140,192.2 |
|
Increase-LT
Borrowings |
- |
- |
22.0 |
1,541.0 |
105.0 |
|
Disposal-Treasury
Stock |
28,395.0 |
- |
- |
235,232.8 |
76,767.5 |
|
Inc Lease Guarantee |
5,633.4 |
2,953.2 |
4,375.6 |
7,931.4 |
9,500.0 |
|
Capital Increase |
16,688.1 |
- |
- |
17,870.5 |
- |
|
Repayments of
Short-term Borrowings |
-62,941.3 |
-83,227.1 |
-64,735.9 |
-226,662.3 |
-125,527.3 |
|
Repayments of
Long-term Borrowings |
-429.1 |
-280.4 |
-210.3 |
- |
- |
|
Decrease-Lease
Guarantee Deposit |
-6,968.5 |
-3,592.5 |
-5,898.3 |
-10,731.2 |
-8,164.7 |
|
Purchase of
Treasury Stock |
- |
-103,998.9 |
-194,128.1 |
-455,034.7 |
-857,777.5 |
|
Changes-Consolidation
Scope |
- |
- |
- |
-887.5 |
- |
|
Cash Inflow-Merger |
- |
- |
- |
415.0 |
- |
|
Cash Flow Due to
Consolidation |
- |
- |
- |
- |
4,530.5 |
|
Cash from
Financing Activities |
-332,664.0 |
-478,217.1 |
-524,374.0 |
-566,059.2 |
-1,010,077.0 |
|
|
|
|
|
|
|
|
Foreign Exchange Effects |
-2,157.3 |
1,926.6 |
2,211.3 |
- |
- |
|
Net Change in
Cash |
664,642.0 |
206,426.9 |
-35,973.0 |
-64,182.1 |
-147,039.5 |
|
|
|
|
|
|
|
|
Cash and Cash Equivalent at Beginning |
316,671.8 |
110,244.9 |
146,217.9 |
201,869.2 |
348,908.7 |
|
Cash and Cash Equivalent at End |
981,313.8 |
316,671.8 |
110,244.9 |
137,687.1 |
201,869.2 |
|
Cash Interest Paid |
2,717.1 |
4,976.3 |
4,254.7 |
- |
- |
|
Cash Taxes Paid |
253,596.2 |
352,728.7 |
365,569.5 |
- |
- |
Financial Health
Financials in: REP (mil)
Except for share items (millions) and per share items (actual units)
|
|||||||||||||||||||||||||||||||||||||||||||||||||||||||||||||||||||||||||||||||||||||||||||||||||||||||||||||||||||||||||||||||
|
|||||||||||||||||||||||||||||||||||||||||||||||||||||||||||||||||||||||||||||||||||||||||||||||||||||||||||||||||||||||||||||||
|
|||||||||||||||||||||||||||||||||||||||||||||||||||||||||||||||||||||||||||||||||||||||||||||||||||||||||||||||||||||||||||||||
Annual Ratios
Financials in: REP (mil)
Except for share items (millions) and per share items (actual units)
|
|
|||||||||||||||||||||||||||||||||||||||||||||||||||||||||||||||||||||||||||||||||||||||||||||||||||||||||||||||||||||||||||||||||||||||||||||||||||||||||||||||||||||||||||||||||||||||||||||||||||||||||||||||||||||||||||||||||||||||||||||||||||||||
|
|||||||||||||||||||||||||||||||||||||||||||||||||||||||||||||||||||||||||||||||||||||||||||||||||||||||||||||||||||||||||||||||||||||||||||||||||||||||||||||||||||||||||||||||||||||||||||||||||||||||||||||||||||||||||||||||||||||||||||||||||||||||
|
|||||||||||||||||||||||||||||||||||||||||||||||||||||||||||||||||||||||||||||||||||||||||||||||||||||||||||||||||||||||||||||||||||||||||||||||||||||||||||||||||||||||||||||||||||||||||||||||||||||||||||||||||||||||||||||||||||||||||||||||||||||||
Annual Income
Statement
Standardized
Financials in: REP (mil)
Except for share items (millions) and per share items (actual units)
|
|
31-Dec-2010 |
31-Dec-2009 |
31-Dec-2008 |
31-Dec-2007 |
31-Dec-2006 |
|
Period Length |
12 Months |
12 Months |
12 Months |
12 Months |
12 Months |
|
UpdateType/Date |
Updated
Normal |
Updated
Normal |
Restated
Normal |
Updated
Normal |
Updated
Normal |
|
Filed Currency |
KRW |
KRW |
KRW |
KRW |
KRW |
|
Exchange Rate
(Period Average) |
1 |
1 |
1 |
1 |
1 |
|
Auditor |
KPMG LLP |
KPMG LLP |
KPMG LLP |
KPMG LLP |
KPMG LLP |
|
Auditor Opinion |
Unqualified with
Explanation |
Unqualified |
Unqualified |
Unqualified |
Unqualified |
|
|
|
|
|
|
|
|
Net Sales |
3,461,418.4 |
3,626,353.0 |
3,312,319.2 |
3,046,384.2 |
2,816,117.4 |
|
Revenue |
3,461,418.4 |
3,626,353.0 |
3,312,319.2 |
3,046,384.2 |
2,816,117.4 |
|
Total Revenue |
3,461,418.4 |
3,626,353.0 |
3,312,319.2 |
3,046,384.2 |
2,816,117.4 |
|
|
|
|
|
|
|
|
Cost of Revenue |
1,446,708.4 |
1,553,264.1 |
1,312,531.6 |
- |
- |
|
Cost of Revenue,
Total |
1,446,708.4 |
1,553,264.1 |
1,312,531.6 |
- |
- |
|
Gross Profit |
2,014,710.0 |
2,073,089.0 |
1,999,787.5 |
3,046,384.2 |
2,816,117.4 |
|
|
|
|
|
|
|
|
Selling/General/Administrative
Expense |
279,526.7 |
254,185.8 |
809,681.3 |
218,676.3 |
197,138.4 |
|
Labor &
Related Expense |
334,975.2 |
317,197.0 |
21,000.0 |
277,951.4 |
266,945.9 |
|
Advertising
Expense |
245,802.0 |
219,332.0 |
- |
172,050.4 |
171,069.7 |
|
Total
Selling/General/Administrative Expenses |
860,303.9 |
790,714.8 |
830,681.3 |
668,678.1 |
635,154.0 |
|
Research & Development |
21,550.0 |
20,345.0 |
- |
22,834.3 |
20,920.9 |
|
Depreciation |
47,704.0 |
53,118.0 |
- |
56,243.1 |
49,104.2 |
|
Amortization of
Intangibles |
1,219.0 |
1,378.0 |
- |
4,508.4 |
4,494.3 |
|
Depreciation/Amortization |
48,923.0 |
54,496.0 |
- |
60,751.5 |
53,598.5 |
|
Investment
Income - Operating |
11,146.0 |
28,321.0 |
- |
- |
- |
|
Interest/Investment
Income - Operating |
11,146.0 |
28,321.0 |
- |
- |
- |
|
Interest Expense
(Income) - Net Operating Total |
11,146.0 |
28,321.0 |
- |
- |
- |
|
Impairment-Assets
Held for Use |
- |
- |
- |
3,244.9 |
204.8 |
|
Impairment-Assets
Held for Sale |
- |
- |
- |
2,163.1 |
2,363.8 |
|
Loss (Gain) on
Sale of Assets - Operating |
-93,114.0 |
-5,383.0 |
- |
- |
- |
|
Other Unusual
Expense (Income) |
2,769.0 |
1,669.0 |
- |
6.5 |
3.0 |
|
Unusual Expense
(Income) |
-90,345.0 |
-3,714.0 |
- |
5,414.5 |
2,571.6 |
|
Other Operating
Expense |
5,721.4 |
6,917.8 |
50,061.2 |
1,055.2 |
1,089.2 |
|
Other, Net |
17,316.6 |
20,272.9 |
-118,859.4 |
1,313,029.3 |
1,248,129.0 |
|
Other Operating
Expenses, Total |
23,038.0 |
27,190.8 |
-68,798.2 |
1,314,084.5 |
1,249,218.2 |
|
Total Operating
Expense |
2,321,324.3 |
2,470,617.6 |
2,074,414.7 |
2,071,762.9 |
1,961,463.1 |
|
|
|
|
|
|
|
|
Operating Income |
1,140,094.1 |
1,155,735.4 |
1,237,904.5 |
974,621.3 |
854,654.3 |
|
|
|
|
|
|
|
|
Interest
Expense - Non-Operating |
-3,255.0 |
-4,815.0 |
-13,711.2 |
-4,501.7 |
-3,856.3 |
|
Interest Expense,
Net Non-Operating |
-3,255.0 |
-4,815.0 |
-13,711.2 |
-4,501.7 |
-3,856.3 |
|
Interest
Income - Non-Operating |
- |
- |
21,251.7 |
41,497.0 |
43,276.1 |
|
Investment
Income - Non-Operating |
245,294.8 |
-1,094.6 |
-317.5 |
13,740.5 |
10,877.6 |
|
Interest/Investment
Income - Non-Operating |
245,294.8 |
-1,094.6 |
20,934.2 |
55,237.5 |
54,153.7 |
|
Interest Income
(Expense) - Net Non-Operating |
23,541.0 |
12,052.0 |
- |
- |
- |
|
Interest Income
(Expense) - Net Non-Operating Total |
265,580.8 |
6,142.4 |
7,223.0 |
50,735.8 |
50,297.4 |
|
Gain (Loss) on Sale of Assets |
- |
- |
- |
4,718.7 |
500.5 |
|
Other Non-Operating
Income (Expense) |
- |
0.3 |
- |
-92,277.1 |
-17,397.8 |
|
Other, Net |
- |
0.3 |
- |
-92,277.1 |
-17,397.8 |
|
Income Before
Tax |
1,405,674.9 |
1,161,878.1 |
1,245,127.5 |
937,798.8 |
888,054.5 |
|
|
|
|
|
|
|
|
Total Income Tax |
374,886.3 |
311,783.7 |
349,998.9 |
291,393.7 |
242,066.6 |
|
Income After Tax |
1,030,788.6 |
850,094.3 |
895,128.6 |
646,405.1 |
645,987.8 |
|
|
|
|
|
|
|
|
Minority Interest |
1,034.8 |
996.3 |
2,648.5 |
16,200.6 |
2,942.1 |
|
Net Income
Before Extraord Items |
1,031,823.4 |
851,090.6 |
897,777.0 |
662,605.6 |
648,930.0 |
|
Net Income |
1,031,823.4 |
851,090.6 |
897,777.0 |
662,605.6 |
648,930.0 |
|
|
|
|
|
|
|
|
Income Available
to Common Excl Extraord Items |
1,031,823.4 |
851,090.6 |
897,777.0 |
662,605.6 |
648,930.0 |
|
|
|
|
|
|
|
|
Income Available
to Common Incl Extraord Items |
1,031,823.4 |
851,090.6 |
897,777.0 |
662,605.6 |
648,930.0 |
|
|
|
|
|
|
|
|
Basic/Primary Weighted Average Shares |
127.3 |
128.4 |
130.1 |
132.4 |
141.0 |
|
Basic EPS Excl Extraord Items |
8,108.52 |
6,629.86 |
6,898.52 |
5,002.97 |
4,603.19 |
|
Basic/Primary EPS Incl Extraord Items |
8,108.52 |
6,629.86 |
6,898.52 |
5,002.97 |
4,603.19 |
|
Diluted Net Income |
1,031,823.4 |
851,090.6 |
897,777.0 |
662,605.6 |
648,930.0 |
|
Diluted Weighted Average Shares |
127.3 |
128.4 |
130.1 |
132.4 |
141.0 |
|
Diluted EPS Excl Extraord Items |
8,108.52 |
6,629.86 |
6,898.52 |
5,002.97 |
4,603.19 |
|
Diluted EPS Incl Extraord Items |
8,108.52 |
6,629.86 |
6,898.52 |
5,002.97 |
4,603.19 |
|
Dividends per Share - Common Stock Primary
Issue |
3,000.00 |
2,800.00 |
2,800.00 |
2,600.00 |
2,400.00 |
|
Gross Dividends - Common Stock |
382,946.0 |
356,157.0 |
360,357.0 |
340,449.0 |
319,712.0 |
|
Interest Expense, Supplemental |
4,469.1 |
4,815.0 |
4,714.0 |
4,501.7 |
3,856.3 |
|
Depreciation, Supplemental |
147,673.0 |
151,884.0 |
151,151.0 |
150,867.2 |
132,571.2 |
|
Total Special Items |
-90,345.0 |
-3,714.0 |
- |
3,665.8 |
5,041.0 |
|
Normalized
Income Before Tax |
1,315,329.9 |
1,158,164.1 |
1,245,127.5 |
941,464.6 |
893,095.5 |
|
|
|
|
|
|
|
|
Effect of Special Items on Income Taxes |
-24,094.5 |
-996.6 |
- |
216.2 |
564.5 |
|
Inc Tax Ex Impact of Sp Items |
350,791.7 |
310,787.1 |
349,998.9 |
291,609.9 |
242,631.2 |
|
Normalized
Income After Tax |
964,538.2 |
847,377.0 |
895,128.6 |
649,854.7 |
650,464.3 |
|
|
|
|
|
|
|
|
Normalized Inc.
Avail to Com. |
965,572.9 |
848,373.3 |
897,777.0 |
666,055.2 |
653,406.5 |
|
|
|
|
|
|
|
|
Basic Normalized EPS |
7,587.89 |
6,608.69 |
6,898.52 |
5,029.02 |
4,634.94 |
|
Diluted Normalized EPS |
7,587.89 |
6,608.69 |
6,898.52 |
5,029.02 |
4,634.94 |
|
Amort of Acquisition Costs, Supplemental |
- |
- |
- |
2,970.0 |
2,970.0 |
|
Amort of Intangibles, Supplemental |
1,324.0 |
1,492.0 |
2,034.0 |
1,557.3 |
4,513.2 |
|
Rental Expenses |
21,061.0 |
18,049.0 |
13,922.0 |
8,804.0 |
6,205.9 |
|
Advertising Expense, Supplemental |
245,802.0 |
219,332.0 |
198,861.0 |
172,050.4 |
171,069.7 |
|
Research & Development Exp,
Supplemental |
21,550.0 |
20,345.0 |
21,908.0 |
22,834.3 |
20,920.9 |
|
Normalized EBIT |
1,060,895.1 |
1,180,342.4 |
1,237,904.5 |
980,035.8 |
857,225.8 |
|
Normalized EBITDA |
1,209,892.1 |
1,333,718.4 |
1,391,089.5 |
1,135,430.3 |
997,280.2 |
Interim
Income Statement
Standardized
Financials in: REP (mil)
Except for share items (millions) and per share items (actual units)
|
|
30-Sep-2011 |
30-Jun-2011 |
31-Mar-2011 |
31-Dec-2010 |
30-Sep-2010 |
|
Period Length |
3 Months |
3 Months |
3 Months |
3 Months |
3 Months |
|
UpdateType/Date |
Updated
Normal |
Updated
Normal |
Reclassified
Calculated |
Updated
Normal |
Updated
Normal |
|
Filed Currency |
KRW |
KRW |
KRW |
KRW |
KRW |
|
Exchange Rate
(Period Average) |
1 |
1 |
1 |
1 |
1 |
|
|
|
|
|
|
|
|
Net Sales |
1,045,870.7 |
898,595.5 |
824,444.9 |
882,252.4 |
943,044.3 |
|
Revenue |
1,045,870.7 |
898,595.5 |
824,444.9 |
882,252.4 |
943,044.3 |
|
Total Revenue |
1,045,870.7 |
898,595.5 |
824,444.9 |
882,252.4 |
943,044.3 |
|
|
|
|
|
|
|
|
Cost of Revenue |
453,867.4 |
380,427.7 |
346,800.7 |
375,393.2 |
391,639.1 |
|
Cost of Revenue,
Total |
453,867.4 |
380,427.7 |
346,800.7 |
375,393.2 |
391,639.1 |
|
Gross Profit |
592,003.2 |
518,167.8 |
477,644.2 |
506,859.1 |
551,405.2 |
|
|
|
|
|
|
|
|
Selling/General/Administrative
Expense |
267,077.7 |
224,964.2 |
217,839.8 |
80,197.8 |
69,969.5 |
|
Labor & Related
Expense |
- |
- |
- |
94,811.0 |
77,143.2 |
|
Advertising
Expense |
- |
- |
- |
106,824.0 |
45,416.0 |
|
Total
Selling/General/Administrative Expenses |
267,077.7 |
224,964.2 |
217,839.8 |
281,832.8 |
192,528.7 |
|
Research & Development |
- |
- |
- |
7,366.0 |
4,613.0 |
|
Depreciation |
- |
- |
- |
11,638.0 |
11,886.0 |
|
Amortization of
Intangibles |
- |
- |
- |
320.0 |
331.0 |
|
Depreciation/Amortization |
- |
- |
- |
11,958.0 |
12,217.0 |
|
Investment
Income - Operating |
- |
- |
- |
830.0 |
27,802.0 |
|
Interest/Investment
Income - Operating |
- |
- |
- |
830.0 |
27,802.0 |
|
Interest Expense
(Income) - Net Operating Total |
- |
- |
- |
830.0 |
27,802.0 |
|
Loss (Gain) on
Sale of Assets - Operating |
- |
- |
- |
-30,305.0 |
-661.0 |
|
Unusual Expense
(Income) |
- |
- |
- |
-30,305.0 |
-661.0 |
|
Other Operating
Expense |
18,980.5 |
22,141.7 |
22,550.9 |
-2,527.6 |
66.4 |
|
Other, Net |
-68,934.3 |
-10,357.1 |
-12,142.1 |
18,175.0 |
247.0 |
|
Other Operating
Expenses, Total |
-49,953.8 |
11,784.6 |
10,408.8 |
15,647.4 |
313.4 |
|
Total Operating
Expense |
670,991.3 |
617,176.5 |
575,049.3 |
662,722.4 |
628,452.2 |
|
|
|
|
|
|
|
|
Operating Income |
374,879.3 |
281,419.0 |
249,395.6 |
219,529.9 |
314,592.1 |
|
|
|
|
|
|
|
|
Interest
Expense - Non-Operating |
-1,433.3 |
-1,157.4 |
-4,665.6 |
-589.4 |
-997.0 |
|
Interest Expense,
Net Non-Operating |
-1,433.3 |
-1,157.4 |
-4,665.6 |
-589.4 |
-997.0 |
|
Interest
Income - Non-Operating |
- |
- |
- |
8,213.0 |
7,041.0 |
|
Investment
Income - Non-Operating |
16,701.8 |
11,288.9 |
12,625.5 |
-2,990.9 |
969.3 |
|
Interest/Investment
Income - Non-Operating |
16,701.8 |
11,288.9 |
12,625.5 |
5,222.1 |
8,010.3 |
|
Interest Income
(Expense) - Net Non-Operating Total |
15,268.5 |
10,131.5 |
7,959.8 |
4,632.7 |
7,013.3 |
|
Other
Non-Operating Income (Expense) |
- |
- |
- |
0.2 |
-0.5 |
|
Other, Net |
- |
- |
- |
0.2 |
-0.5 |
|
Income Before
Tax |
390,147.8 |
291,550.5 |
257,355.5 |
224,162.8 |
321,604.8 |
|
|
|
|
|
|
|
|
Total Income Tax |
108,366.8 |
76,260.0 |
74,242.4 |
59,690.5 |
85,738.1 |
|
Income After Tax |
281,780.9 |
215,290.6 |
183,113.0 |
164,472.3 |
235,866.8 |
|
|
|
|
|
|
|
|
Minority Interest |
890.4 |
-243.1 |
-715.5 |
566.1 |
-426.2 |
|
Net Income
Before Extraord Items |
282,671.3 |
215,047.5 |
182,397.6 |
165,038.4 |
235,440.6 |
|
Net Income |
282,671.3 |
215,047.5 |
182,397.6 |
165,038.4 |
235,440.6 |
|
|
|
|
|
|
|
|
Income Available
to Common Excl Extraord Items |
282,671.3 |
215,047.5 |
182,397.6 |
165,038.4 |
235,440.6 |
|
|
|
|
|
|
|
|
Income Available
to Common Incl Extraord Items |
282,671.3 |
215,047.5 |
182,397.6 |
165,038.4 |
235,440.6 |
|
|
|
|
|
|
|
|
Basic/Primary Weighted Average Shares |
125.7 |
127.1 |
127.6 |
127.4 |
127.2 |
|
Basic EPS Excl Extraord Items |
2,249.38 |
1,692.37 |
1,428.94 |
1,295.32 |
1,850.97 |
|
Basic/Primary EPS Incl Extraord Items |
2,249.38 |
1,692.37 |
1,428.94 |
1,295.32 |
1,850.97 |
|
Diluted Net Income |
282,671.3 |
215,047.5 |
182,397.6 |
165,038.4 |
235,440.6 |
|
Diluted Weighted Average Shares |
125.7 |
127.1 |
127.6 |
127.4 |
127.2 |
|
Diluted EPS Excl Extraord Items |
2,249.38 |
1,692.37 |
1,428.94 |
1,295.32 |
1,850.97 |
|
Diluted EPS Incl Extraord Items |
2,249.38 |
1,692.37 |
1,428.94 |
1,295.32 |
1,850.97 |
|
Dividends per Share - Common Stock Primary
Issue |
0.00 |
0.00 |
0.00 |
3,000.00 |
0.00 |
|
Gross Dividends - Common Stock |
0.0 |
0.0 |
0.0 |
382,946.0 |
0.0 |
|
Interest Expense, Supplemental |
1,433.0 |
1,157.4 |
677.0 |
1,803.5 |
997.0 |
|
Depreciation, Supplemental |
39,439.0 |
38,759.0 |
34,697.0 |
37,971.0 |
36,545.0 |
|
Total Special Items |
- |
- |
- |
-30,305.0 |
-661.0 |
|
Normalized
Income Before Tax |
390,147.8 |
291,550.5 |
257,355.5 |
193,857.8 |
320,943.8 |
|
|
|
|
|
|
|
|
Effect of Special Items on Income Taxes |
- |
- |
- |
-8,069.7 |
-176.2 |
|
Inc Tax Ex Impact of Sp Items |
108,366.8 |
76,260.0 |
74,242.4 |
51,620.8 |
85,561.8 |
|
Normalized
Income After Tax |
281,780.9 |
215,290.6 |
183,113.0 |
142,237.0 |
235,382.0 |
|
|
|
|
|
|
|
|
Normalized Inc.
Avail to Com. |
282,671.3 |
215,047.5 |
182,397.6 |
142,803.1 |
234,955.8 |
|
|
|
|
|
|
|
|
Basic Normalized EPS |
2,249.38 |
1,692.37 |
1,428.94 |
1,120.81 |
1,847.15 |
|
Diluted Normalized EPS |
2,249.38 |
1,692.37 |
1,428.94 |
1,120.81 |
1,847.15 |
|
Amort of Intangibles, Supplemental |
1,611.0 |
542.0 |
399.0 |
389.0 |
325.0 |
|
Rental Expenses |
7,718.0 |
6,149.0 |
6,082.0 |
6,864.0 |
4,751.0 |
|
Advertising Expense, Supplemental |
66,898.0 |
52,233.0 |
51,893.0 |
106,824.0 |
45,416.0 |
|
Research & Development Exp,
Supplemental |
7,757.0 |
6,192.0 |
5,168.0 |
7,366.0 |
5,041.0 |
|
Normalized EBIT |
374,879.3 |
281,419.0 |
249,395.6 |
190,054.9 |
341,733.1 |
|
Normalized EBITDA |
415,929.3 |
320,720.0 |
284,491.6 |
228,414.9 |
378,603.1 |
Annual Balance Sheet
Standardized
Financials in: REP (mil)
Except for share items (millions) and per share items (actual units)
|
|
31-Dec-2010 |
31-Dec-2009 |
31-Dec-2008 |
31-Dec-2007 |
31-Dec-2006 |
|
UpdateType/Date |
Updated
Normal |
Updated
Normal |
Restated
Normal |
Updated
Normal |
Updated
Normal |
|
Filed Currency |
KRW |
KRW |
KRW |
KRW |
KRW |
|
Exchange Rate |
1 |
1 |
1 |
1 |
1 |
|
Auditor |
KPMG LLP |
KPMG LLP |
KPMG LLP |
KPMG LLP |
KPMG LLP |
|
Auditor Opinion |
Unqualified with
Explanation |
Unqualified |
Unqualified |
Unqualified |
Unqualified |
|
|
|
|
|
|
|
|
Cash &
Equivalents |
981,313.8 |
316,671.8 |
110,244.9 |
137,687.1 |
201,869.2 |
|
Short Term
Investments |
16,272.8 |
49,034.8 |
26,772.3 |
1,091.9 |
1,555.0 |
|
Cash and Short
Term Investments |
997,586.5 |
365,706.5 |
137,017.1 |
138,779.0 |
203,424.2 |
|
Accounts
Receivable - Trade, Gross |
543,788.8 |
529,531.6 |
558,567.8 |
381,223.9 |
394,335.0 |
|
Provision
for Doubtful Accounts |
-6,875.0 |
-8,035.0 |
-7,869.0 |
-11,419.6 |
-39,306.0 |
|
Trade Accounts
Receivable - Net |
539,117.8 |
522,069.6 |
551,082.8 |
370,130.7 |
355,271.3 |
|
Other Receivables |
87,291.0 |
78,734.0 |
82,557.0 |
54,653.0 |
144,418.7 |
|
Total
Receivables, Net |
626,408.8 |
600,803.6 |
633,639.8 |
424,783.7 |
499,690.0 |
|
Inventories -
Finished Goods |
253,465.0 |
269,397.0 |
187,703.0 |
137,912.3 |
141,937.4 |
|
Inventories - Work
In Progress |
313,301.0 |
318,780.0 |
478,131.0 |
279,229.0 |
231,518.8 |
|
Inventories - Raw
Materials |
878,502.0 |
878,360.0 |
859,806.0 |
818,492.7 |
890,867.1 |
|
Inventories -
Other |
93,309.6 |
86,156.1 |
64,233.5 |
105,786.4 |
65,737.4 |
|
Total Inventory |
1,538,577.6 |
1,552,693.1 |
1,589,873.5 |
1,341,420.4 |
1,330,060.8 |
|
Prepaid Expenses |
199,404.3 |
181,245.5 |
205,474.6 |
9,408.9 |
7,421.4 |
|
Deferred Income
Tax - Current Asset |
- |
- |
- |
17,604.5 |
8,225.9 |
|
Other Current
Assets |
- |
0.0 |
0.0 |
- |
122.4 |
|
Other Current
Assets, Total |
- |
0.0 |
0.0 |
17,604.5 |
8,348.3 |
|
Total Current
Assets |
3,361,977.3 |
2,700,448.8 |
2,566,005.0 |
1,931,996.5 |
2,048,944.7 |
|
|
|
|
|
|
|
|
Buildings |
825,647.0 |
758,966.0 |
733,416.0 |
792,374.5 |
743,745.7 |
|
Land/Improvements |
436,950.0 |
437,143.0 |
436,527.0 |
431,727.8 |
381,943.7 |
|
Machinery/Equipment |
1,241,963.0 |
1,252,074.0 |
1,215,497.0 |
1,159,073.5 |
1,028,826.8 |
|
Construction
in Progress |
89,389.0 |
69,340.0 |
57,120.0 |
84,053.3 |
84,606.9 |
|
Other
Property/Plant/Equipment |
748.9 |
744.2 |
743.6 |
744.2 |
605.0 |
|
Property/Plant/Equipment
- Gross |
2,594,697.9 |
2,518,267.2 |
2,443,303.6 |
2,467,973.2 |
2,239,728.2 |
|
Accumulated
Depreciation |
-1,083,860.0 |
-1,046,712.0 |
-939,313.0 |
-908,684.1 |
-776,984.3 |
|
Property/Plant/Equipment
- Net |
1,510,837.9 |
1,471,555.2 |
1,503,990.6 |
1,559,289.1 |
1,462,743.9 |
|
Intangibles, Net |
63,145.2 |
55,699.9 |
51,933.9 |
30,796.2 |
12,248.4 |
|
LT Investment -
Affiliate Companies |
1,596.5 |
1,584.4 |
1,270.2 |
36,207.5 |
2,598.5 |
|
LT Investments -
Other |
436,305.7 |
546,484.8 |
409,458.1 |
259,719.1 |
96,517.2 |
|
Long Term
Investments |
437,902.3 |
548,069.2 |
410,728.3 |
295,926.5 |
99,115.7 |
|
Note Receivable - Long Term |
114,539.5 |
130,046.6 |
138,379.1 |
100,041.7 |
63,448.0 |
|
Deferred Income
Tax - Long Term Asset |
11,066.9 |
8,169.1 |
7,108.7 |
1,764.7 |
- |
|
Other Long Term
Assets |
277,590.0 |
257,894.5 |
234,783.7 |
214,287.4 |
170,625.1 |
|
Other Long Term
Assets, Total |
288,656.9 |
266,063.6 |
241,892.4 |
216,052.1 |
170,625.1 |
|
Total Assets |
5,777,059.1 |
5,171,883.2 |
4,912,929.4 |
4,134,102.1 |
3,857,125.8 |
|
|
|
|
|
|
|
|
Accounts Payable |
301,211.2 |
326,598.2 |
455,332.6 |
15,201.8 |
14,896.3 |
|
Accrued Expenses |
324,857.0 |
350,049.8 |
370,196.9 |
328,062.5 |
194,854.8 |
|
Notes Payable/Short Term Debt |
66,507.2 |
94,532.5 |
104,113.1 |
38,199.5 |
80,997.8 |
|
Current Portion - Long Term Debt/Capital
Leases |
505.6 |
447.9 |
280.4 |
210.3 |
- |
|
Customer Advances |
9,334.7 |
23,516.0 |
71,708.0 |
6,215.8 |
8,416.8 |
|
Income Taxes
Payable |
222,932.3 |
128,418.8 |
187,609.9 |
220,427.5 |
135,654.4 |
|
Other Payables |
- |
- |
- |
105,692.9 |
30,548.0 |
|
Other Current
Liabilities |
- |
- |
2,698.5 |
16,895.6 |
17,752.7 |
|
Other Current
liabilities, Total |
232,267.0 |
151,934.8 |
262,016.5 |
349,231.7 |
192,371.9 |
|
Total Current
Liabilities |
925,348.0 |
923,563.2 |
1,191,939.4 |
730,905.8 |
483,120.8 |
|
|
|
|
|
|
|
|
Long Term Debt |
1,539.6 |
2,026.4 |
2,474.3 |
2,732.7 |
1,402.0 |
|
Total Long Term
Debt |
1,539.6 |
2,026.4 |
2,474.3 |
2,732.7 |
1,402.0 |
|
Total Debt |
68,552.4 |
97,006.8 |
106,867.8 |
41,142.5 |
82,399.8 |
|
|
|
|
|
|
|
|
Deferred Income
Tax - LT Liability |
167,502.5 |
167,345.1 |
106,761.9 |
124,534.8 |
103,528.2 |
|
Deferred Income
Tax |
167,502.5 |
167,345.1 |
106,761.9 |
124,534.8 |
103,528.2 |
|
Minority Interest |
42,130.0 |
27,112.2 |
27,563.8 |
20,117.4 |
20,218.5 |
|
Reserves |
2,219.8 |
2,256.4 |
1,957.0 |
1,258.1 |
76,280.5 |
|
Pension Benefits -
Underfunded |
- |
- |
- |
86,392.5 |
99,506.4 |
|
Other Long Term
Liabilities |
82,139.7 |
68,688.9 |
105,959.8 |
25,050.8 |
27,524.9 |
|
Other
Liabilities, Total |
84,359.5 |
70,945.3 |
107,916.8 |
112,701.4 |
203,311.8 |
|
Total
Liabilities |
1,220,879.7 |
1,190,992.2 |
1,436,656.3 |
990,992.1 |
811,581.3 |
|
|
|
|
|
|
|
|
Common Stock |
954,959.5 |
954,959.5 |
954,959.5 |
954,959.5 |
954,959.5 |
|
Common Stock |
954,959.5 |
954,959.5 |
954,959.5 |
954,959.5 |
954,959.5 |
|
Additional Paid-In Capital |
5,332.7 |
5,320.5 |
2,869.3 |
465,866.0 |
335,349.6 |
|
Retained Earnings (Accumulated Deficit) |
3,330,585.7 |
2,779,281.3 |
2,277,114.7 |
2,134,736.0 |
2,061,348.6 |
|
Treasury Stock - Common |
-216,827.0 |
-226,944.7 |
-226,944.7 |
-414,947.3 |
-321,903.9 |
|
Unrealized Gain (Loss) |
- |
- |
- |
3,135.0 |
16,938.3 |
|
Translation
Adjustment |
- |
- |
- |
-639.2 |
-1,147.5 |
|
Other Equity |
482,128.5 |
468,274.4 |
468,274.4 |
- |
- |
|
Other Equity,
Total |
482,128.5 |
468,274.4 |
468,274.4 |
-639.2 |
-1,147.5 |
|
Total Equity |
4,556,179.4 |
3,980,891.0 |
3,476,273.2 |
3,143,110.0 |
3,045,544.5 |
|
|
|
|
|
|
|
|
Total
Liabilities & Shareholders’ Equity |
5,777,059.1 |
5,171,883.2 |
4,912,929.4 |
4,134,102.1 |
3,857,125.8 |
|
|
|
|
|
|
|
|
Shares Outstanding
- Common Stock Primary Issue |
127.6 |
127.2 |
128.7 |
130.8 |
133.2 |
|
Total Common
Shares Outstanding |
127.6 |
127.2 |
128.7 |
130.8 |
133.2 |
|
Treasury Shares - Common Stock Primary
Issue |
9.6 |
10.1 |
10.1 |
12.6 |
14.2 |
|
Employees |
4,214 |
4,653 |
4,750 |
4,367 |
4,317 |
|
Number of Common Shareholders |
104,382 |
132,863 |
105,512 |
107,629 |
120,524 |
|
Accumulated Intangible Amort, Suppl. |
20,105.0 |
15,217.0 |
- |
- |
- |
|
Deferred Revenue - Current |
9,334.7 |
23,516.0 |
71,708.0 |
6,215.8 |
8,416.8 |
|
Total Long Term Debt, Supplemental |
505.6 |
447.9 |
2,754.0 |
2,943.0 |
1,402.0 |
|
Long Term Debt Maturing within 1 Year |
505.6 |
447.9 |
280.0 |
210.0 |
97.5 |
|
Long Term Debt Maturing in Year 2 |
- |
- |
448.0 |
280.0 |
97.5 |
|
Long Term Debt Maturing in Year 3 |
- |
- |
504.0 |
446.0 |
259.0 |
|
Long Term Debt Maturing in Year 4 |
- |
- |
504.0 |
501.0 |
259.0 |
|
Long Term Debt Maturing in 2-3 Years |
- |
- |
952.0 |
726.0 |
356.5 |
|
Long Term Debt Maturing in 4-5 Years |
- |
- |
504.0 |
501.0 |
259.0 |
|
Long Term Debt Matur. in Year 6 &
Beyond |
0.0 |
0.0 |
1,018.0 |
1,506.0 |
689.0 |
Annual Balance
Sheet
Financials in: KRW (mil)
|
|
31-Dec-2010 |
31-Dec-2009 |
31-Dec-2008 |
31-Dec-2007 |
31-Dec-2006 |
|
UpdateType/Date |
Updated
Normal |
Updated
Normal |
Restated
Normal |
Updated
Normal |
Updated
Normal |
|
Filed Currency |
KRW |
KRW |
KRW |
KRW |
KRW |
|
Exchange Rate |
1 |
1 |
1 |
1 |
1 |
|
Auditor |
KPMG LLP |
KPMG LLP |
KPMG LLP |
KPMG LLP |
KPMG LLP |
|
Auditor Opinion |
Unqualified with
Explanation |
Unqualified |
Unqualified |
Unqualified |
Unqualified |
|
|
|
|
|
|
|
|
Cash and
CashEquivalents |
981,313.8 |
316,671.8 |
110,244.9 |
137,687.1 |
201,869.2 |
|
Other Financial
Assets, current |
15,272.8 |
925.8 |
1,717.1 |
- |
- |
|
ST Finl Assets |
- |
- |
- |
1,000.0 |
1,000.0 |
|
ST Secs for Sale |
1,000.0 |
1,956.8 |
2,148.6 |
91.9 |
555.0 |
|
Trade Rcvb Gross |
543,789.0 |
529,532.0 |
558,568.0 |
381,223.9 |
394,335.0 |
|
Doubtful Account |
-6,875.0 |
-8,035.0 |
-7,869.0 |
-11,419.6 |
-39,306.0 |
|
ST Loans Shrhldr |
19,300.0 |
24,031.0 |
28,036.0 |
19,503.8 |
19,254.8 |
|
ST Loan, Net |
898.0 |
1,242.0 |
1,073.0 |
1,094.4 |
99,646.7 |
|
Other Rcvbls |
69,027.0 |
55,663.0 |
55,154.0 |
34,054.8 |
25,517.2 |
|
Doubtful
Account-Account Rcvbls |
-1,934.0 |
-2,202.0 |
-1,706.0 |
- |
- |
|
Trade Guarantee |
- |
0.0 |
0.0 |
- |
122.4 |
|
Accrued Income |
2,204.0 |
573.0 |
384.0 |
326.5 |
242.3 |
|
Adjustment |
-0.2 |
-0.4 |
-0.2 |
- |
- |
|
Advance Payments |
41,544.0 |
43,614.4 |
30,988.6 |
23,715.6 |
30,292.1 |
|
Prepaid Expenses
Total |
22,361.2 |
11,805.1 |
3,700.6 |
9,374.7 |
7,025.8 |
|
Receivable-Recovery
of Taxes |
- |
- |
- |
34.2 |
395.7 |
|
Prepaid Taxes on
Cigarette Consumption |
177,043.1 |
169,440.4 |
201,773.9 |
- |
- |
|
Fixed Assets
Reduction Provision |
- |
46,152.2 |
22,906.5 |
- |
- |
|
Deferred Income
Tax, Current Assets |
- |
- |
- |
17,604.5 |
8,225.9 |
|
Merchandises |
7,914.0 |
2,623.0 |
793.0 |
1,107.5 |
1,439.6 |
|
Finished Goods |
238,009.0 |
207,308.0 |
183,668.0 |
134,163.8 |
136,230.7 |
|
Work in Progress |
312,920.0 |
318,780.0 |
296,072.0 |
259,058.7 |
218,190.3 |
|
Raw Materials |
869,053.0 |
878,360.0 |
842,193.0 |
804,740.6 |
878,729.1 |
|
Stored Goods |
25,941.0 |
25,256.0 |
23,269.0 |
21,855.8 |
19,751.1 |
|
Residual Products |
7,542.0 |
5,650.0 |
3,242.0 |
2,640.9 |
4,267.1 |
|
Finished Housing |
- |
53,816.0 |
0.0 |
- |
- |
|
Unfinished Housing |
381.0 |
0.0 |
182,059.0 |
- |
- |
|
CA Land |
9,449.0 |
0.0 |
17,613.0 |
13,204.0 |
11,570.9 |
|
Goods in Transit |
25,825.0 |
17,286.0 |
9,976.0 |
8,064.6 |
12,949.5 |
|
Adjustment |
-0.4 |
-0.2 |
-0.1 |
- |
- |
|
Semi-finish Good |
- |
- |
- |
20,170.3 |
13,328.5 |
|
Assistance Mat. |
- |
- |
- |
548.0 |
567.2 |
|
Unsold Comm Prop |
- |
- |
- |
52,150.4 |
2,744.7 |
|
Total Current
Assets |
3,361,977.3 |
2,700,448.8 |
2,566,005.0 |
1,931,996.5 |
2,048,944.7 |
|
|
|
|
|
|
|
|
LT Finl Assets |
646.3 |
286.3 |
6.3 |
43.7 |
43.8 |
|
Investment in
Properties |
121,482.7 |
104,115.5 |
107,330.7 |
- |
- |
|
Financial Assets
Available for Sale |
314,176.7 |
442,083.0 |
302,121.2 |
257,097.6 |
71,156.2 |
|
LT Trade
Receivable |
114,539.5 |
130,046.6 |
138,379.1 |
84.7 |
- |
|
LT Account
Receivable |
- |
- |
- |
1,017.4 |
- |
|
LT Interest Rcvb |
- |
- |
- |
- |
26.5 |
|
Equity Method
Securities |
1,596.5 |
1,584.4 |
1,270.2 |
35,969.1 |
1,111.0 |
|
LT Loans |
- |
- |
- |
2,771.8 |
2,013.7 |
|
Other Investment
Assets |
- |
- |
- |
2,577.7 |
25,317.2 |
|
LT Security
Deposit |
- |
- |
- |
51,162.1 |
42,265.0 |
|
LT Deposits |
- |
- |
- |
- |
1,003.2 |
|
Long-Term Prepaid
Expenses |
6,280.7 |
6,411.2 |
6,282.3 |
- |
- |
|
LT Loans Shrhldr |
- |
- |
- |
96,167.8 |
61,407.7 |
|
Long-term Advance
Payments |
138,895.7 |
133,361.9 |
118,240.3 |
96,492.8 |
81,745.9 |
|
LT Affiliat Loan |
- |
- |
- |
238.4 |
1,487.5 |
|
LT Deposit
Withheld |
132,413.6 |
118,121.4 |
110,261.1 |
66,632.5 |
45,611.0 |
|
Land |
436,950.0 |
437,143.0 |
436,527.0 |
431,727.8 |
381,943.7 |
|
Buildings |
761,383.0 |
699,249.0 |
673,719.0 |
735,932.4 |
689,849.3 |
|
Buildings Depre. |
-265,030.0 |
-236,698.0 |
-210,289.0 |
-212,194.2 |
-189,704.0 |
|
Buildings-Reduction |
- |
- |
- |
-36.1 |
-198.1 |
|
Structures |
64,264.0 |
59,717.0 |
59,697.0 |
56,482.8 |
54,101.2 |
|
Structure Depre. |
-32,217.0 |
-30,234.0 |
-28,216.0 |
-27,250.2 |
-25,537.2 |
|
Structures-Reduction |
- |
- |
- |
-4.5 |
-6.7 |
|
Machinery/Equip. |
994,532.0 |
968,088.0 |
954,593.0 |
892,064.1 |
804,969.3 |
|
Mach/Equip Depre |
-613,152.0 |
-574,301.0 |
-530,235.0 |
-500,275.9 |
-435,208.2 |
|
Machinery &
Equipment-Reduction |
- |
- |
- |
-1,085.0 |
- |
|
Transport Equip. |
8,903.0 |
13,001.0 |
17,445.0 |
19,035.4 |
20,906.0 |
|
Transport Deprec |
-7,114.0 |
-11,490.0 |
-14,864.0 |
-15,681.5 |
-15,034.4 |
|
Tools/Equipments |
46,069.0 |
45,837.0 |
47,936.0 |
42,050.2 |
35,745.2 |
|
Tool/Equip Depr. |
-33,903.0 |
-33,716.0 |
-32,795.0 |
-28,721.6 |
-24,222.1 |
|
Tools &
Equipments, Reduction |
- |
- |
- |
-0.2 |
- |
|
Fixtures |
192,459.0 |
225,148.0 |
195,523.0 |
207,008.9 |
167,206.3 |
|
Deprec. Fixtures |
-132,444.0 |
-160,273.0 |
-122,914.0 |
-124,560.7 |
-87,278.3 |
|
Other Tangible
Assets |
749.0 |
744.0 |
744.0 |
744.2 |
605.0 |
|
Construct in Pro |
89,389.0 |
69,340.0 |
57,120.0 |
85,147.2 |
84,606.9 |
|
Construction in
Progress-Reduction |
- |
- |
- |
-1,093.9 |
- |
|
Adjustment |
-0.1 |
0.2 |
-0.4 |
- |
- |
|
Deferred Income
Taxes Assets Non-current |
11,066.9 |
8,169.1 |
7,108.7 |
1,764.7 |
- |
|
Indust.-Patent |
2,049.0 |
1,481.0 |
1,847.0 |
2,223.8 |
3,713.7 |
|
Usage
Right-Facility |
24,189.0 |
20,750.0 |
19,964.0 |
- |
- |
|
Other
Intangible |
4,194.0 |
2,981.0 |
2,951.0 |
2,428.0 |
1,557.5 |
|
Intangible
Assets-under Development |
32,713.0 |
30,488.0 |
27,172.0 |
- |
- |
|
Adjustment |
0.2 |
-0.1 |
-0.1 |
- |
- |
|
Goodwill |
- |
- |
- |
4,007.4 |
6,977.2 |
|
Membership
Right |
- |
- |
- |
22,137.0 |
- |
|
Total Assets |
5,777,059.1 |
5,171,883.2 |
4,912,929.4 |
4,134,102.1 |
3,857,125.8 |
|
|
|
|
|
|
|
|
Accounts Payable |
- |
- |
- |
105,692.9 |
30,548.0 |
|
Trade Acct. Pay. |
301,211.2 |
326,598.2 |
455,332.6 |
15,201.8 |
14,896.3 |
|
Inc. Taxes Pay. |
222,932.3 |
128,418.8 |
187,609.9 |
220,427.5 |
135,654.4 |
|
Accrd Cigaret Tx |
324,857.0 |
350,049.8 |
370,196.9 |
181,734.2 |
55,387.9 |
|
Accrued Expenses |
- |
- |
- |
17,342.8 |
10,518.9 |
|
Advance for
Customers |
9,334.7 |
23,516.0 |
71,708.0 |
6,126.8 |
7,998.5 |
|
Unearned Income |
- |
- |
- |
89.0 |
418.3 |
|
Deposit Withheld |
- |
- |
- |
11,763.1 |
15,718.0 |
|
Security Deposit Withheld |
- |
- |
- |
102.2 |
212.2 |
|
VAT Withheld |
- |
- |
- |
128,985.5 |
128,948.0 |
|
Reserve Liability |
- |
- |
- |
5,108.0 |
2,034.7 |
|
Derivatives in
Liabilities, Current |
- |
- |
2,698.5 |
24.5 |
- |
|
Current Portion of
LT Debt |
505.6 |
447.9 |
280.4 |
210.3 |
- |
|
Short-term Borrowings |
66,507.2 |
94,532.5 |
104,113.1 |
38,097.2 |
80,785.5 |
|
Total Current
Liabilities |
925,348.0 |
923,563.2 |
1,191,939.4 |
730,905.8 |
483,120.8 |
|
|
|
|
|
|
|
|
Long Term
Borrowings |
1,539.6 |
2,026.4 |
2,474.3 |
2,732.7 |
1,402.0 |
|
Total Long Term
Debt |
1,539.6 |
2,026.4 |
2,474.3 |
2,732.7 |
1,402.0 |
|
|
|
|
|
|
|
|
Long-term Trade
Payables |
22,880.4 |
23,028.1 |
23,580.4 |
- |
- |
|
Long-term Advances
from Customers |
10,935.1 |
10,215.4 |
8,385.7 |
- |
- |
|
LT Guaranteed
Liabilities |
48,324.2 |
35,445.4 |
73,993.6 |
- |
- |
|
Rental Secur Dep |
- |
- |
- |
24,938.4 |
27,460.4 |
|
LT Deposit
Withheld |
- |
- |
- |
112.4 |
64.5 |
|
Deferred Income
Taxes Liabilities Non-cu |
167,502.5 |
167,345.1 |
106,761.9 |
124,534.8 |
103,528.2 |
|
Reserve-Lawsuit |
- |
- |
- |
364.0 |
- |
|
Reserve
Liability-Sales Return |
- |
- |
- |
894.1 |
1,796.9 |
|
LT Reserve |
2,219.8 |
2,256.4 |
1,957.0 |
- |
- |
|
Tobacco Stabil R |
- |
- |
- |
- |
74,483.6 |
|
Retire Reserve |
- |
- |
- |
86,392.5 |
99,506.4 |
|
Minority Interest |
42,130.0 |
27,112.2 |
27,563.8 |
20,117.4 |
20,218.5 |
|
Total
Liabilities |
1,220,879.7 |
1,190,992.2 |
1,436,656.3 |
990,992.1 |
811,581.3 |
|
|
|
|
|
|
|
|
Common Stock |
954,959.5 |
954,959.5 |
954,959.5 |
954,959.5 |
954,959.5 |
|
Other Capital
Surplus |
5,332.7 |
5,320.5 |
2,869.3 |
465,866.0 |
335,349.6 |
|
Treasury Stock |
-216,827.0 |
-226,944.7 |
-226,944.7 |
-414,947.3 |
-321,903.9 |
|
Gains on Sale of
Treasury Stock |
482,128.5 |
468,274.4 |
468,274.4 |
- |
- |
|
Reserves |
2,179,227.1 |
2,075,268.8 |
1,825,708.4 |
- |
- |
|
Retained Earning
Carried Forward |
1,151,358.6 |
704,012.5 |
451,406.4 |
2,134,736.0 |
2,061,348.6 |
|
G-Sec for Sale V |
- |
- |
- |
2,100.2 |
15,929.3 |
|
G-Inv. Secs. Under
Equity Method Valu. |
- |
- |
- |
1,034.8 |
1,009.0 |
|
Overseas Business
Translation Credit |
- |
- |
- |
-639.2 |
-1,147.5 |
|
Total Equity |
4,556,179.4 |
3,980,891.0 |
3,476,273.2 |
3,143,110.0 |
3,045,544.5 |
|
|
|
|
|
|
|
|
Total
Liabilities & Shareholders' Equity |
5,777,059.1 |
5,171,883.2 |
4,912,929.4 |
4,134,102.1 |
3,857,125.8 |
|
|
|
|
|
|
|
|
S/O-Common Stock |
127.6 |
127.2 |
128.7 |
130.8 |
133.2 |
|
Total Common
Shares Outstanding |
127.6 |
127.2 |
128.7 |
130.8 |
133.2 |
|
T/S-Common Stock |
9.6 |
10.1 |
10.1 |
12.6 |
14.2 |
|
Deferred Revenue, Current |
9,334.7 |
23,516.0 |
71,708.0 |
6,215.8 |
8,416.8 |
|
Accu. Intangible Amort&Impair, Supple. |
20,105.0 |
15,217.0 |
- |
- |
- |
|
Full-Time Employees |
4,214 |
4,653 |
4,750 |
4,367 |
4,317 |
|
Number of Common Shareholders |
104,382 |
132,863 |
105,512 |
107,629 |
120,524 |
|
Long Term Debt Maturing within 1 Year |
505.6 |
447.9 |
280.0 |
210.0 |
- |
|
Long Term Debt Maturing within 2 Years |
- |
- |
448.0 |
280.0 |
195.0 |
|
Long Term Debt Maturing within 3 Years |
- |
- |
504.0 |
446.0 |
259.0 |
|
Long Term Debt Maturing within 4 Years |
- |
- |
504.0 |
501.0 |
259.0 |
|
Long Term Debt Remaining Maturities |
- |
- |
1,018.0 |
1,506.0 |
689.0 |
|
Total Long Term Debt, Supplemental |
505.6 |
447.9 |
2,754.0 |
2,943.0 |
1,402.0 |
Annual Cash Flows
Financials in: KRW (mil)
|
|
31-Dec-2010 |
31-Dec-2009 |
31-Dec-2008 |
31-Dec-2007 |
31-Dec-2006 |
|
Period Length |
12 Months |
12 Months |
12 Months |
12 Months |
12 Months |
|
UpdateType/Date |
Updated
Normal |
Updated
Normal |
Restated
Normal |
Reclassified
Normal |
Updated
Normal |
|
Filed Currency |
KRW |
KRW |
KRW |
KRW |
KRW |
|
Exchange Rate
(Period Average) |
1 |
1 |
1 |
1 |
1 |
|
Auditor |
KPMG LLP |
KPMG LLP |
KPMG LLP |
KPMG LLP |
KPMG LLP |
|
Auditor Opinion |
Unqualified with
Explanation |
Unqualified |
Unqualified |
Unqualified |
Unqualified |
|
|
|
|
|
|
|
|
Net Income |
1,030,789.0 |
850,094.0 |
1,063,379.1 |
646,405.1 |
648,930.0 |
|
Depreciation |
147,673.0 |
151,884.0 |
- |
150,867.2 |
132,571.2 |
|
Corporate Tax |
374,886.0 |
311,784.0 |
- |
- |
- |
|
Financial Expense |
4,469.0 |
6,526.0 |
- |
- |
- |
|
Financial Income |
-270,338.0 |
-12,853.0 |
- |
- |
- |
|
Amort. Intangible |
1,324.0 |
1,492.0 |
- |
4,527.3 |
4,513.2 |
|
Amort-Bad Debt
Exp. |
- |
- |
- |
7,241.9 |
3,849.6 |
|
Donations |
- |
- |
- |
0.1 |
- |
|
Amort-Other Bad
Debt |
- |
- |
- |
1,218.9 |
2,331.9 |
|
Retirement
Allowance |
86,939.0 |
41,541.0 |
- |
40,335.5 |
59,371.9 |
|
Loss-Valuation of
Derivatives |
- |
- |
- |
24.5 |
- |
|
L-Sec for Sale
Disposal |
- |
- |
- |
723.6 |
427.5 |
|
L-Sec for Sale
Redct |
- |
- |
- |
2,163.1 |
2,363.8 |
|
L-For Exch
Translatn |
5,755.0 |
17,708.0 |
- |
219.4 |
3,435.3 |
|
Loss-Disposal of
Trade Receivable |
- |
- |
- |
483.2 |
- |
|
L-Inventory
Scrapping |
- |
- |
- |
814.2 |
257.3 |
|
Loss on Valuation
of Inventory |
164.0 |
- |
- |
38,221.6 |
23,578.8 |
|
Loss Redu.of Trade
Receivable&Other Rece |
473.0 |
720.0 |
- |
- |
- |
|
Disp Tang Asst
Loss |
2,386.0 |
7,496.0 |
- |
4,845.4 |
7,591.0 |
|
L-Tang Asset Redct |
- |
657.0 |
- |
- |
- |
|
Loss-Reduction of
Intangible Assets |
- |
647.0 |
- |
1,065.8 |
- |
|
Loss on Sale of
Intangible Assets |
159.0 |
- |
- |
- |
- |
|
Loss Reduction of
Intangible Assets |
3,681.0 |
- |
- |
- |
- |
|
Loss-Reduction of
Tangible Assets |
- |
- |
- |
2,179.1 |
204.8 |
|
Loss Reduction of
Investment Properties |
1,437.0 |
- |
- |
- |
- |
|
Other Expense |
7,237.0 |
4,154.0 |
- |
- |
- |
|
Transfer-Resrve
Installment |
- |
- |
- |
3,737.1 |
2,034.7 |
|
Provision for
Litigation Loss |
- |
- |
- |
364.0 |
- |
|
Transfr-Tobacco
Fund |
- |
- |
- |
35,516.4 |
18,730.2 |
|
Loss-Prior Period
Error Correction |
- |
- |
- |
20,958.9 |
- |
|
Stock Compensation
Expense |
- |
- |
- |
348.7 |
- |
|
Miscellaneous Loss |
- |
- |
- |
26.5 |
52.6 |
|
Gain on Sec Sales |
- |
- |
- |
-10,840.0 |
-1,790.2 |
|
Loss-Disposal of
Other Fixed Assets |
- |
- |
- |
-141.2 |
- |
|
Gain Disp Tang.
Ast |
-101,886.0 |
-17,033.0 |
- |
-10,237.1 |
-8,348.8 |
|
Gain on Sale of
Intangible Assets |
-24.0 |
- |
- |
- |
- |
|
Gain under Equity
Method |
- |
- |
- |
-1,187.8 |
-789.7 |
|
Gain-Disposal of
Sec. under Equity Mtd. |
-300.0 |
- |
- |
- |
-17,428.3 |
|
Gain-Valu. of Securities
Avail-for-Sale |
- |
- |
- |
-11.4 |
- |
|
Reversal Prov.
Doubt |
- |
- |
- |
-1,913.4 |
-28,720.0 |
|
Recovery-Loss
Reduct.of Trade Recei |
-216.0 |
-46.0 |
- |
- |
- |
|
Recovery-Inventory
Valuation Loss |
- |
-3,807.0 |
- |
-35,001.3 |
-11,779.5 |
|
G-For Curr
Transactn |
- |
- |
- |
-2,621.2 |
-59.1 |
|
Gain on Foreign
Currency Translation |
-1,717.0 |
-1,184.0 |
- |
- |
- |
|
Interest Income |
- |
- |
- |
-11,416.4 |
-11,760.4 |
|
Accrued LT
Interest |
- |
- |
- |
- |
-48.2 |
|
Gain-Convertible
Bonds Conversion |
- |
- |
- |
- |
-1,875.9 |
|
Loss-Minority
Interest |
- |
- |
- |
- |
-2,942.1 |
|
Miscellaneous Gain |
- |
-94.0 |
- |
-29.8 |
- |
|
Inventories |
14,122.0 |
48,067.0 |
- |
-18,927.1 |
44,252.5 |
|
Trade Receivables |
-51,650.0 |
17,697.0 |
- |
-36,651.8 |
-22,025.8 |
|
Accrued Income |
- |
- |
- |
-84.2 |
4,418.4 |
|
Account
Receivables |
- |
- |
- |
-10,222.4 |
4,290.0 |
|
Prepaid Expenses |
-2,143.0 |
-3,595.0 |
- |
-3,626.3 |
-836.4 |
|
Advance Payments |
-3,599.0 |
-28,083.0 |
- |
29,367.8 |
16,270.9 |
|
LT Advance Payment |
- |
- |
- |
-37,174.4 |
-7,326.2 |
|
Corporate Tax
Refundable |
-7,603.0 |
32,333.0 |
- |
360.4 |
-1,882.6 |
|
Trade Guarantee |
- |
- |
- |
122.4 |
-69.7 |
|
Deferred
Taxes-Asset |
- |
- |
- |
-8,945.6 |
3,042.7 |
|
Trade Payables |
-23,947.0 |
-122,072.0 |
- |
-7,786.2 |
-30,423.7 |
|
Account Payables |
- |
- |
- |
74,349.0 |
11,482.1 |
|
Accrued Expenses |
- |
- |
- |
11,288.7 |
-21,059.9 |
|
Accrued Inc Tax |
- |
- |
- |
35,909.3 |
56,551.1 |
|
Tobacco Fund |
- |
- |
- |
-110,000.0 |
- |
|
Decrease-Reserve |
- |
- |
- |
-661.8 |
- |
|
Accrued Cigarette
Consumption Taxes |
-25,193.0 |
-20,147.0 |
- |
126,346.3 |
36,463.1 |
|
Unearned Income |
- |
- |
- |
-929.8 |
-373.8 |
|
LT Account Payable |
- |
- |
- |
- |
-40.0 |
|
Advances Received |
-13,257.0 |
-46,045.0 |
- |
-1,768.2 |
4,292.9 |
|
Deposits Withheld |
- |
- |
- |
-4,790.9 |
-9,268.3 |
|
Security Deposit
Withheld |
- |
- |
- |
-110.0 |
- |
|
VAT Withheld |
- |
- |
- |
37.5 |
-12,198.1 |
|
Nation Pension Fnd |
- |
- |
- |
182.9 |
-10.7 |
|
Retiremt Allow
Paymt |
-81,201.0 |
-54,184.0 |
- |
-21,517.6 |
-13,465.9 |
|
Retirement Insurance |
- |
- |
- |
-23,790.4 |
-21,154.1 |
|
Deferred Income
Tax Credit, A/L |
- |
- |
- |
24,512.6 |
6,971.6 |
|
Reserve for
Returned Goods |
- |
- |
- |
-298.2 |
876.3 |
|
Oversea Op
Translatn |
- |
- |
- |
21.0 |
-431.3 |
|
Taxes Paid |
-253,596.2 |
-352,728.7 |
-365,569.5 |
- |
- |
|
Gain on Equity
Method Securities |
- |
-6.0 |
- |
- |
- |
|
Loss on Equity
Method Securities |
287.0 |
191.0 |
- |
- |
- |
|
Operating
Activities, Adjustment |
0.5 |
-0.4 |
- |
- |
- |
|
Cash from Operating
Activities |
845,111.2 |
831,112.9 |
697,809.6 |
904,100.8 |
873,046.7 |
|
|
|
|
|
|
|
|
Dec-ST Finl Assets |
- |
- |
- |
11,940.0 |
240,000.0 |
|
Decrease-LT
Financial Assets |
- |
- |
- |
19.2 |
33.3 |
|
Decrease-Loans |
47,795.8 |
25,671.0 |
29,162.2 |
- |
- |
|
Interest Received |
20,547.2 |
10,720.7 |
17,453.0 |
- |
- |
|
Decrease-ST Loans |
- |
- |
- |
1,315.2 |
- |
|
Decrease-LT Loans |
- |
- |
- |
246.9 |
- |
|
Received-Gain on
LT Deposit Investment |
1,243.8 |
- |
- |
- |
- |
|
Decrease-Current
Portion of LT Loans |
- |
- |
- |
111,459.0 |
3,095.4 |
|
Dec-Secs for Sale |
- |
- |
- |
2,005.0 |
9,707.6 |
|
Proceeds from Sale
of Equity Method Secu |
- |
1.1 |
- |
- |
40,147.6 |
|
Dividend Income,
IP |
2,056.4 |
215.3 |
3,458.2 |
- |
- |
|
Decrease in
Deposits Provided |
39,793.2 |
17,307.9 |
12,275.4 |
20,055.8 |
23,777.0 |
|
Proceeds from Sale
of Available for sale |
265,677.8 |
2,346.4 |
348.7 |
- |
- |
|
Dec. Other Inv Asset |
- |
- |
- |
106.6 |
96.7 |
|
Disposal of
Non-Current Assets Held for |
100,830.4 |
- |
- |
- |
- |
|
Proceeds from Sale
of Property Plant and |
35,725.7 |
18,637.6 |
23,107.4 |
- |
- |
|
Disposal of
Subsidiary Investment |
- |
- |
281.5 |
- |
- |
|
Disposal of Land |
- |
- |
- |
22,111.4 |
10,627.8 |
|
Disposal of
Building |
- |
- |
- |
2,496.0 |
10,140.0 |
|
Disposal Structure |
- |
- |
- |
48.8 |
76.3 |
|
Disposal
Mach./Equip |
- |
- |
- |
1,153.9 |
291.9 |
|
Disposal Trans
Equip |
- |
- |
- |
838.3 |
415.1 |
|
Disp
Tools/Supplies |
- |
- |
- |
35.1 |
105.7 |
|
Disp-Fixtures |
- |
- |
- |
112.3 |
58.2 |
|
Decrease-Membership
Right |
- |
- |
- |
204.5 |
- |
|
Decrease-Intangible
Assets |
1,016.1 |
63.9 |
35.5 |
- |
20.1 |
|
Increase-ST Loans |
- |
- |
- |
-1,787.1 |
- |
|
Inc-LT Finl Assets |
- |
- |
- |
-19.2 |
-12.7 |
|
Increase-Loans |
-16,022.6 |
-10,403.2 |
-22,607.4 |
- |
- |
|
Increase in LT
Loans |
- |
- |
- |
-11,123.7 |
-1,126.8 |
|
Inc LT Shrhldr
Loans |
- |
- |
- |
- |
-5,541.1 |
|
Increase in
Deposits Provided |
-49,004.0 |
-20,187.2 |
-18,401.2 |
-24,375.9 |
-25,154.9 |
|
Increase-LT
Deposit |
-13,625.2 |
-18,054.9 |
-17,895.0 |
-20,415.0 |
-19,840.8 |
|
Purchase of Derivatives
Assets |
- |
-4,409.8 |
-6,319.7 |
- |
- |
|
Purchase of
Available for sale Securitie |
-39,923.4 |
-11,995.5 |
-19,098.8 |
-242,324.2 |
-8,263.6 |
|
Purchase of Equity
Method Securities |
- |
-500.0 |
-500.0 |
- |
- |
|
Inc Other Invt Ast |
- |
- |
- |
-2,774.3 |
-2,735.1 |
|
Purchase of
Investment Properties |
- |
-323.4 |
-222.1 |
- |
- |
|
Purchase of
Property, Plant and Equipmen |
-211,635.8 |
-152,247.8 |
-205,649.4 |
- |
- |
|
Acquisition of
Land |
- |
- |
- |
-22,265.6 |
-21,645.2 |
|
Acquis. of
Building |
- |
- |
- |
-7,683.4 |
-14,349.4 |
|
Purch. of
Structure |
- |
- |
- |
-1,822.3 |
-1,311.9 |
|
Purch. of
Mach/Equip |
- |
- |
- |
-12,262.5 |
-9,132.1 |
|
Acq. of Trans
Equip |
- |
- |
- |
-763.2 |
-639.1 |
|
Acq. in
Tools/Suppl. |
- |
- |
- |
-2,940.0 |
-2,460.8 |
|
Acquis. of
Supplies |
- |
- |
- |
-37,130.1 |
-34,241.8 |
|
Acq. Const. In
Prog |
- |
- |
- |
-186,138.2 |
-201,169.4 |
|
Inc-Other Tangible
Assets |
- |
- |
- |
-139.1 |
-45.5 |
|
Purchase of
Intangible Assets |
-13,606.3 |
-5,892.2 |
-6,382.3 |
- |
- |
|
Deduction from
Other Investing Activitie |
-16,517.0 |
654.5 |
-665.9 |
- |
- |
|
Increase-Membership
Right |
- |
- |
- |
-698.0 |
- |
|
Acq Intangible Asset |
- |
- |
- |
-1,709.9 |
-931.8 |
|
Cash from
Investing Activities |
154,352.0 |
-148,395.6 |
-211,619.9 |
-402,223.7 |
-10,009.2 |
|
|
|
|
|
|
|
|
Interest Paid |
-2,717.1 |
-4,976.3 |
-4,254.7 |
- |
- |
|
Payments in
Dividends |
-356,156.6 |
-360,356.6 |
-340,449.2 |
-319,712.0 |
-249,702.7 |
|
Proceeds from
Short-term Borrowings |
45,832.3 |
75,261.6 |
80,905.0 |
183,977.9 |
140,192.2 |
|
Increase-LT
Borrowings |
- |
- |
22.0 |
1,541.0 |
105.0 |
|
Disposal-Treasury Stock |
28,395.0 |
- |
- |
235,232.8 |
76,767.5 |
|
Inc Lease
Guarantee |
5,633.4 |
2,953.2 |
4,375.6 |
7,931.4 |
9,500.0 |
|
Capital Increase |
16,688.1 |
- |
- |
17,870.5 |
- |
|
Repayments of
Short-term Borrowings |
-62,941.3 |
-83,227.1 |
-64,735.9 |
-226,662.3 |
-125,527.3 |
|
Repayments of
Long-term Borrowings |
-429.1 |
-280.4 |
-210.3 |
- |
- |
|
Decrease-Lease
Guarantee Deposit |
-6,968.5 |
-3,592.5 |
-5,898.3 |
-10,731.2 |
-8,164.7 |
|
Purchase of
Treasury Stock |
- |
-103,998.9 |
-194,128.1 |
-455,034.7 |
-857,777.5 |
|
Changes-Consolidation
Scope |
- |
- |
- |
-887.5 |
- |
|
Cash Inflow-Merger |
- |
- |
- |
415.0 |
- |
|
Cash Flow Due to
Consolidation |
- |
- |
- |
- |
4,530.5 |
|
Cash from Financing
Activities |
-332,664.0 |
-478,217.1 |
-524,374.0 |
-566,059.2 |
-1,010,077.0 |
|
|
|
|
|
|
|
|
Foreign Exchange Effects |
-2,157.3 |
1,926.6 |
2,211.3 |
- |
- |
|
Net Change in
Cash |
664,642.0 |
206,426.9 |
-35,973.0 |
-64,182.1 |
-147,039.5 |
|
|
|
|
|
|
|
|
Cash and Cash Equivalent at Beginning |
316,671.8 |
110,244.9 |
146,217.9 |
201,869.2 |
348,908.7 |
|
Cash and Cash Equivalent at End |
981,313.8 |
316,671.8 |
110,244.9 |
137,687.1 |
201,869.2 |
|
Cash Interest Paid |
2,717.1 |
4,976.3 |
4,254.7 |
- |
- |
|
Cash Taxes Paid |
253,596.2 |
352,728.7 |
365,569.5 |
- |
- |
Financial Health
Financials in: REP (mil)
Except for share items (millions) and per share items (actual units)
|
|||||||||||||||||||||||||||||||||||||||||||||||||||||||||||||||||||||||||||||||||||||||||||||||||||||||||||||||||||||||||||||||
|
|||||||||||||||||||||||||||||||||||||||||||||||||||||||||||||||||||||||||||||||||||||||||||||||||||||||||||||||||||||||||||||||
|
|||||||||||||||||||||||||||||||||||||||||||||||||||||||||||||||||||||||||||||||||||||||||||||||||||||||||||||||||||||||||||||||
Annual Ratios
Financials in: REP (mil)
Except for share items (millions) and per share items (actual units)
|
|
|||||||||||||||||||||||||||||||||||||||||||||||||||||||||||||||||||||||||||||||||||||||||||||||||||||||||||||||||||||||||||||||||||||||||||||||||||||||||||||||||||||||||||||||||||||||||||||||||||||||||||||||||||||||||||||||||||||||||||||||||||||||
|
|||||||||||||||||||||||||||||||||||||||||||||||||||||||||||||||||||||||||||||||||||||||||||||||||||||||||||||||||||||||||||||||||||||||||||||||||||||||||||||||||||||||||||||||||||||||||||||||||||||||||||||||||||||||||||||||||||||||||||||||||||||||
|
|||||||||||||||||||||||||||||||||||||||||||||||||||||||||||||||||||||||||||||||||||||||||||||||||||||||||||||||||||||||||||||||||||||||||||||||||||||||||||||||||||||||||||||||||||||||||||||||||||||||||||||||||||||||||||||||||||||||||||||||||||||||
Annual Income Statement
Standardized
Financials in: REP (mil)
Except for share items (millions) and per share items (actual units)
|
|
31-Dec-2010 |
31-Dec-2009 |
31-Dec-2008 |
31-Dec-2007 |
31-Dec-2006 |
|
Period Length |
12 Months |
12 Months |
12 Months |
12 Months |
12 Months |
|
UpdateType/Date |
Updated
Normal |
Updated
Normal |
Restated
Normal |
Updated
Normal |
Updated
Normal |
|
Filed Currency |
KRW |
KRW |
KRW |
KRW |
KRW |
|
Exchange Rate
(Period Average) |
1 |
1 |
1 |
1 |
1 |
|
Auditor |
KPMG LLP |
KPMG LLP |
KPMG LLP |
KPMG LLP |
KPMG LLP |
|
Auditor Opinion |
Unqualified with
Explanation |
Unqualified |
Unqualified |
Unqualified |
Unqualified |
|
|
|
|
|
|
|
|
Net Sales |
3,461,418.4 |
3,626,353.0 |
3,312,319.2 |
3,046,384.2 |
2,816,117.4 |
|
Revenue |
3,461,418.4 |
3,626,353.0 |
3,312,319.2 |
3,046,384.2 |
2,816,117.4 |
|
Total Revenue |
3,461,418.4 |
3,626,353.0 |
3,312,319.2 |
3,046,384.2 |
2,816,117.4 |
|
|
|
|
|
|
|
|
Cost of Revenue |
1,446,708.4 |
1,553,264.1 |
1,312,531.6 |
- |
- |
|
Cost of Revenue,
Total |
1,446,708.4 |
1,553,264.1 |
1,312,531.6 |
- |
- |
|
Gross Profit |
2,014,710.0 |
2,073,089.0 |
1,999,787.5 |
3,046,384.2 |
2,816,117.4 |
|
|
|
|
|
|
|
|
Selling/General/Administrative
Expense |
279,526.7 |
254,185.8 |
809,681.3 |
218,676.3 |
197,138.4 |
|
Labor &
Related Expense |
334,975.2 |
317,197.0 |
21,000.0 |
277,951.4 |
266,945.9 |
|
Advertising
Expense |
245,802.0 |
219,332.0 |
- |
172,050.4 |
171,069.7 |
|
Total
Selling/General/Administrative Expenses |
860,303.9 |
790,714.8 |
830,681.3 |
668,678.1 |
635,154.0 |
|
Research & Development |
21,550.0 |
20,345.0 |
- |
22,834.3 |
20,920.9 |
|
Depreciation |
47,704.0 |
53,118.0 |
- |
56,243.1 |
49,104.2 |
|
Amortization of
Intangibles |
1,219.0 |
1,378.0 |
- |
4,508.4 |
4,494.3 |
|
Depreciation/Amortization |
48,923.0 |
54,496.0 |
- |
60,751.5 |
53,598.5 |
|
Investment
Income - Operating |
11,146.0 |
28,321.0 |
- |
- |
- |
|
Interest/Investment
Income - Operating |
11,146.0 |
28,321.0 |
- |
- |
- |
|
Interest Expense
(Income) - Net Operating Total |
11,146.0 |
28,321.0 |
- |
- |
- |
|
Impairment-Assets
Held for Use |
- |
- |
- |
3,244.9 |
204.8 |
|
Impairment-Assets
Held for Sale |
- |
- |
- |
2,163.1 |
2,363.8 |
|
Loss (Gain) on
Sale of Assets - Operating |
-93,114.0 |
-5,383.0 |
- |
- |
- |
|
Other Unusual Expense
(Income) |
2,769.0 |
1,669.0 |
- |
6.5 |
3.0 |
|
Unusual Expense
(Income) |
-90,345.0 |
-3,714.0 |
- |
5,414.5 |
2,571.6 |
|
Other Operating
Expense |
5,721.4 |
6,917.8 |
50,061.2 |
1,055.2 |
1,089.2 |
|
Other, Net |
17,316.6 |
20,272.9 |
-118,859.4 |
1,313,029.3 |
1,248,129.0 |
|
Other Operating
Expenses, Total |
23,038.0 |
27,190.8 |
-68,798.2 |
1,314,084.5 |
1,249,218.2 |
|
Total Operating
Expense |
2,321,324.3 |
2,470,617.6 |
2,074,414.7 |
2,071,762.9 |
1,961,463.1 |
|
|
|
|
|
|
|
|
Operating Income |
1,140,094.1 |
1,155,735.4 |
1,237,904.5 |
974,621.3 |
854,654.3 |
|
|
|
|
|
|
|
|
Interest
Expense - Non-Operating |
-3,255.0 |
-4,815.0 |
-13,711.2 |
-4,501.7 |
-3,856.3 |
|
Interest Expense, Net
Non-Operating |
-3,255.0 |
-4,815.0 |
-13,711.2 |
-4,501.7 |
-3,856.3 |
|
Interest
Income - Non-Operating |
- |
- |
21,251.7 |
41,497.0 |
43,276.1 |
|
Investment
Income - Non-Operating |
245,294.8 |
-1,094.6 |
-317.5 |
13,740.5 |
10,877.6 |
|
Interest/Investment
Income - Non-Operating |
245,294.8 |
-1,094.6 |
20,934.2 |
55,237.5 |
54,153.7 |
|
Interest Income
(Expense) - Net Non-Operating |
23,541.0 |
12,052.0 |
- |
- |
- |
|
Interest Income
(Expense) - Net Non-Operating Total |
265,580.8 |
6,142.4 |
7,223.0 |
50,735.8 |
50,297.4 |
|
Gain (Loss) on Sale of Assets |
- |
- |
- |
4,718.7 |
500.5 |
|
Other
Non-Operating Income (Expense) |
- |
0.3 |
- |
-92,277.1 |
-17,397.8 |
|
Other, Net |
- |
0.3 |
- |
-92,277.1 |
-17,397.8 |
|
Income Before
Tax |
1,405,674.9 |
1,161,878.1 |
1,245,127.5 |
937,798.8 |
888,054.5 |
|
|
|
|
|
|
|
|
Total Income Tax |
374,886.3 |
311,783.7 |
349,998.9 |
291,393.7 |
242,066.6 |
|
Income After Tax |
1,030,788.6 |
850,094.3 |
895,128.6 |
646,405.1 |
645,987.8 |
|
|
|
|
|
|
|
|
Minority Interest |
1,034.8 |
996.3 |
2,648.5 |
16,200.6 |
2,942.1 |
|
Net Income
Before Extraord Items |
1,031,823.4 |
851,090.6 |
897,777.0 |
662,605.6 |
648,930.0 |
|
Net Income |
1,031,823.4 |
851,090.6 |
897,777.0 |
662,605.6 |
648,930.0 |
|
|
|
|
|
|
|
|
Income Available
to Common Excl Extraord Items |
1,031,823.4 |
851,090.6 |
897,777.0 |
662,605.6 |
648,930.0 |
|
|
|
|
|
|
|
|
Income Available
to Common Incl Extraord Items |
1,031,823.4 |
851,090.6 |
897,777.0 |
662,605.6 |
648,930.0 |
|
|
|
|
|
|
|
|
Basic/Primary Weighted Average Shares |
127.3 |
128.4 |
130.1 |
132.4 |
141.0 |
|
Basic EPS Excl Extraord Items |
8,108.52 |
6,629.86 |
6,898.52 |
5,002.97 |
4,603.19 |
|
Basic/Primary EPS Incl Extraord Items |
8,108.52 |
6,629.86 |
6,898.52 |
5,002.97 |
4,603.19 |
|
Diluted Net Income |
1,031,823.4 |
851,090.6 |
897,777.0 |
662,605.6 |
648,930.0 |
|
Diluted Weighted Average Shares |
127.3 |
128.4 |
130.1 |
132.4 |
141.0 |
|
Diluted EPS Excl Extraord Items |
8,108.52 |
6,629.86 |
6,898.52 |
5,002.97 |
4,603.19 |
|
Diluted EPS Incl Extraord Items |
8,108.52 |
6,629.86 |
6,898.52 |
5,002.97 |
4,603.19 |
|
Dividends per Share - Common Stock Primary
Issue |
3,000.00 |
2,800.00 |
2,800.00 |
2,600.00 |
2,400.00 |
|
Gross Dividends - Common Stock |
382,946.0 |
356,157.0 |
360,357.0 |
340,449.0 |
319,712.0 |
|
Interest Expense, Supplemental |
4,469.1 |
4,815.0 |
4,714.0 |
4,501.7 |
3,856.3 |
|
Depreciation, Supplemental |
147,673.0 |
151,884.0 |
151,151.0 |
150,867.2 |
132,571.2 |
|
Total Special Items |
-90,345.0 |
-3,714.0 |
- |
3,665.8 |
5,041.0 |
|
Normalized
Income Before Tax |
1,315,329.9 |
1,158,164.1 |
1,245,127.5 |
941,464.6 |
893,095.5 |
|
|
|
|
|
|
|
|
Effect of Special Items on Income Taxes |
-24,094.5 |
-996.6 |
- |
216.2 |
564.5 |
|
Inc Tax Ex Impact of Sp Items |
350,791.7 |
310,787.1 |
349,998.9 |
291,609.9 |
242,631.2 |
|
Normalized
Income After Tax |
964,538.2 |
847,377.0 |
895,128.6 |
649,854.7 |
650,464.3 |
|
|
|
|
|
|
|
|
Normalized Inc.
Avail to Com. |
965,572.9 |
848,373.3 |
897,777.0 |
666,055.2 |
653,406.5 |
|
|
|
|
|
|
|
|
Basic Normalized EPS |
7,587.89 |
6,608.69 |
6,898.52 |
5,029.02 |
4,634.94 |
|
Diluted Normalized EPS |
7,587.89 |
6,608.69 |
6,898.52 |
5,029.02 |
4,634.94 |
|
Amort of Acquisition Costs, Supplemental |
- |
- |
- |
2,970.0 |
2,970.0 |
|
Amort of Intangibles, Supplemental |
1,324.0 |
1,492.0 |
2,034.0 |
1,557.3 |
4,513.2 |
|
Rental Expenses |
21,061.0 |
18,049.0 |
13,922.0 |
8,804.0 |
6,205.9 |
|
Advertising Expense, Supplemental |
245,802.0 |
219,332.0 |
198,861.0 |
172,050.4 |
171,069.7 |
|
Research & Development Exp,
Supplemental |
21,550.0 |
20,345.0 |
21,908.0 |
22,834.3 |
20,920.9 |
|
Normalized EBIT |
1,060,895.1 |
1,180,342.4 |
1,237,904.5 |
980,035.8 |
857,225.8 |
|
Normalized EBITDA |
1,209,892.1 |
1,333,718.4 |
1,391,089.5 |
1,135,430.3 |
997,280.2 |
Interim Income Statement
Standardized
Financials in: REP (mil)
Except for share items (millions) and per share items (actual units)
|
|
30-Sep-2011 |
30-Jun-2011 |
31-Mar-2011 |
31-Dec-2010 |
30-Sep-2010 |
|
Period Length |
3 Months |
3 Months |
3 Months |
3 Months |
3 Months |
|
UpdateType/Date |
Updated
Normal |
Updated
Normal |
Reclassified
Calculated |
Updated
Normal |
Updated
Normal |
|
Filed Currency |
KRW |
KRW |
KRW |
KRW |
KRW |
|
Exchange Rate
(Period Average) |
1 |
1 |
1 |
1 |
1 |
|
|
|
|
|
|
|
|
Net Sales |
1,045,870.7 |
898,595.5 |
824,444.9 |
882,252.4 |
943,044.3 |
|
Revenue |
1,045,870.7 |
898,595.5 |
824,444.9 |
882,252.4 |
943,044.3 |
|
Total Revenue |
1,045,870.7 |
898,595.5 |
824,444.9 |
882,252.4 |
943,044.3 |
|
|
|
|
|
|
|
|
Cost of Revenue |
453,867.4 |
380,427.7 |
346,800.7 |
375,393.2 |
391,639.1 |
|
Cost of Revenue,
Total |
453,867.4 |
380,427.7 |
346,800.7 |
375,393.2 |
391,639.1 |
|
Gross Profit |
592,003.2 |
518,167.8 |
477,644.2 |
506,859.1 |
551,405.2 |
|
|
|
|
|
|
|
|
Selling/General/Administrative
Expense |
267,077.7 |
224,964.2 |
217,839.8 |
80,197.8 |
69,969.5 |
|
Labor & Related
Expense |
- |
- |
- |
94,811.0 |
77,143.2 |
|
Advertising
Expense |
- |
- |
- |
106,824.0 |
45,416.0 |
|
Total
Selling/General/Administrative Expenses |
267,077.7 |
224,964.2 |
217,839.8 |
281,832.8 |
192,528.7 |
|
Research & Development |
- |
- |
- |
7,366.0 |
4,613.0 |
|
Depreciation |
- |
- |
- |
11,638.0 |
11,886.0 |
|
Amortization of
Intangibles |
- |
- |
- |
320.0 |
331.0 |
|
Depreciation/Amortization |
- |
- |
- |
11,958.0 |
12,217.0 |
|
Investment
Income - Operating |
- |
- |
- |
830.0 |
27,802.0 |
|
Interest/Investment
Income - Operating |
- |
- |
- |
830.0 |
27,802.0 |
|
Interest Expense
(Income) - Net Operating Total |
- |
- |
- |
830.0 |
27,802.0 |
|
Loss (Gain) on
Sale of Assets - Operating |
- |
- |
- |
-30,305.0 |
-661.0 |
|
Unusual Expense
(Income) |
- |
- |
- |
-30,305.0 |
-661.0 |
|
Other Operating
Expense |
18,980.5 |
22,141.7 |
22,550.9 |
-2,527.6 |
66.4 |
|
Other, Net |
-68,934.3 |
-10,357.1 |
-12,142.1 |
18,175.0 |
247.0 |
|
Other Operating
Expenses, Total |
-49,953.8 |
11,784.6 |
10,408.8 |
15,647.4 |
313.4 |
|
Total Operating
Expense |
670,991.3 |
617,176.5 |
575,049.3 |
662,722.4 |
628,452.2 |
|
|
|
|
|
|
|
|
Operating Income |
374,879.3 |
281,419.0 |
249,395.6 |
219,529.9 |
314,592.1 |
|
|
|
|
|
|
|
|
Interest
Expense - Non-Operating |
-1,433.3 |
-1,157.4 |
-4,665.6 |
-589.4 |
-997.0 |
|
Interest Expense,
Net Non-Operating |
-1,433.3 |
-1,157.4 |
-4,665.6 |
-589.4 |
-997.0 |
|
Interest
Income - Non-Operating |
- |
- |
- |
8,213.0 |
7,041.0 |
|
Investment
Income - Non-Operating |
16,701.8 |
11,288.9 |
12,625.5 |
-2,990.9 |
969.3 |
|
Interest/Investment
Income - Non-Operating |
16,701.8 |
11,288.9 |
12,625.5 |
5,222.1 |
8,010.3 |
|
Interest Income (Expense)
- Net Non-Operating Total |
15,268.5 |
10,131.5 |
7,959.8 |
4,632.7 |
7,013.3 |
|
Other
Non-Operating Income (Expense) |
- |
- |
- |
0.2 |
-0.5 |
|
Other, Net |
- |
- |
- |
0.2 |
-0.5 |
|
Income Before
Tax |
390,147.8 |
291,550.5 |
257,355.5 |
224,162.8 |
321,604.8 |
|
|
|
|
|
|
|
|
Total Income Tax |
108,366.8 |
76,260.0 |
74,242.4 |
59,690.5 |
85,738.1 |
|
Income After Tax |
281,780.9 |
215,290.6 |
183,113.0 |
164,472.3 |
235,866.8 |
|
|
|
|
|
|
|
|
Minority Interest |
890.4 |
-243.1 |
-715.5 |
566.1 |
-426.2 |
|
Net Income
Before Extraord Items |
282,671.3 |
215,047.5 |
182,397.6 |
165,038.4 |
235,440.6 |
|
Net Income |
282,671.3 |
215,047.5 |
182,397.6 |
165,038.4 |
235,440.6 |
|
|
|
|
|
|
|
|
Income Available
to Common Excl Extraord Items |
282,671.3 |
215,047.5 |
182,397.6 |
165,038.4 |
235,440.6 |
|
|
|
|
|
|
|
|
Income Available
to Common Incl Extraord Items |
282,671.3 |
215,047.5 |
182,397.6 |
165,038.4 |
235,440.6 |
|
|
|
|
|
|
|
|
Basic/Primary Weighted Average Shares |
125.7 |
127.1 |
127.6 |
127.4 |
127.2 |
|
Basic EPS Excl Extraord Items |
2,249.38 |
1,692.37 |
1,428.94 |
1,295.32 |
1,850.97 |
|
Basic/Primary EPS Incl Extraord Items |
2,249.38 |
1,692.37 |
1,428.94 |
1,295.32 |
1,850.97 |
|
Diluted Net Income |
282,671.3 |
215,047.5 |
182,397.6 |
165,038.4 |
235,440.6 |
|
Diluted Weighted Average Shares |
125.7 |
127.1 |
127.6 |
127.4 |
127.2 |
|
Diluted EPS Excl Extraord Items |
2,249.38 |
1,692.37 |
1,428.94 |
1,295.32 |
1,850.97 |
|
Diluted EPS Incl Extraord Items |
2,249.38 |
1,692.37 |
1,428.94 |
1,295.32 |
1,850.97 |
|
Dividends per Share - Common Stock Primary
Issue |
0.00 |
0.00 |
0.00 |
3,000.00 |
0.00 |
|
Gross Dividends - Common Stock |
0.0 |
0.0 |
0.0 |
382,946.0 |
0.0 |
|
Interest Expense, Supplemental |
1,433.0 |
1,157.4 |
677.0 |
1,803.5 |
997.0 |
|
Depreciation, Supplemental |
39,439.0 |
38,759.0 |
34,697.0 |
37,971.0 |
36,545.0 |
|
Total Special Items |
- |
- |
- |
-30,305.0 |
-661.0 |
|
Normalized Income
Before Tax |
390,147.8 |
291,550.5 |
257,355.5 |
193,857.8 |
320,943.8 |
|
|
|
|
|
|
|
|
Effect of Special Items on Income Taxes |
- |
- |
- |
-8,069.7 |
-176.2 |
|
Inc Tax Ex Impact of Sp Items |
108,366.8 |
76,260.0 |
74,242.4 |
51,620.8 |
85,561.8 |
|
Normalized
Income After Tax |
281,780.9 |
215,290.6 |
183,113.0 |
142,237.0 |
235,382.0 |
|
|
|
|
|
|
|
|
Normalized Inc.
Avail to Com. |
282,671.3 |
215,047.5 |
182,397.6 |
142,803.1 |
234,955.8 |
|
|
|
|
|
|
|
|
Basic Normalized EPS |
2,249.38 |
1,692.37 |
1,428.94 |
1,120.81 |
1,847.15 |
|
Diluted Normalized EPS |
2,249.38 |
1,692.37 |
1,428.94 |
1,120.81 |
1,847.15 |
|
Amort of Intangibles, Supplemental |
1,611.0 |
542.0 |
399.0 |
389.0 |
325.0 |
|
Rental Expenses |
7,718.0 |
6,149.0 |
6,082.0 |
6,864.0 |
4,751.0 |
|
Advertising Expense, Supplemental |
66,898.0 |
52,233.0 |
51,893.0 |
106,824.0 |
45,416.0 |
|
Research & Development Exp,
Supplemental |
7,757.0 |
6,192.0 |
5,168.0 |
7,366.0 |
5,041.0 |
|
Normalized EBIT |
374,879.3 |
281,419.0 |
249,395.6 |
190,054.9 |
341,733.1 |
|
Normalized EBITDA |
415,929.3 |
320,720.0 |
284,491.6 |
228,414.9 |
378,603.1 |
Annual Balance Sheet
Standardized
Financials in: REP (mil)
Except for share items (millions) and per share items (actual units)
|
|
31-Dec-2010 |
31-Dec-2009 |
31-Dec-2008 |
31-Dec-2007 |
31-Dec-2006 |
|
UpdateType/Date |
Updated
Normal |
Updated
Normal |
Restated
Normal |
Updated
Normal |
Updated
Normal |
|
Filed Currency |
KRW |
KRW |
KRW |
KRW |
KRW |
|
Exchange Rate |
1 |
1 |
1 |
1 |
1 |
|
Auditor |
KPMG LLP |
KPMG LLP |
KPMG LLP |
KPMG LLP |
KPMG LLP |
|
Auditor Opinion |
Unqualified with
Explanation |
Unqualified |
Unqualified |
Unqualified |
Unqualified |
|
|
|
|
|
|
|
|
Cash &
Equivalents |
981,313.8 |
316,671.8 |
110,244.9 |
137,687.1 |
201,869.2 |
|
Short Term
Investments |
16,272.8 |
49,034.8 |
26,772.3 |
1,091.9 |
1,555.0 |
|
Cash and Short
Term Investments |
997,586.5 |
365,706.5 |
137,017.1 |
138,779.0 |
203,424.2 |
|
Accounts
Receivable - Trade, Gross |
543,788.8 |
529,531.6 |
558,567.8 |
381,223.9 |
394,335.0 |
|
Provision
for Doubtful Accounts |
-6,875.0 |
-8,035.0 |
-7,869.0 |
-11,419.6 |
-39,306.0 |
|
Trade Accounts
Receivable - Net |
539,117.8 |
522,069.6 |
551,082.8 |
370,130.7 |
355,271.3 |
|
Other Receivables |
87,291.0 |
78,734.0 |
82,557.0 |
54,653.0 |
144,418.7 |
|
Total
Receivables, Net |
626,408.8 |
600,803.6 |
633,639.8 |
424,783.7 |
499,690.0 |
|
Inventories -
Finished Goods |
253,465.0 |
269,397.0 |
187,703.0 |
137,912.3 |
141,937.4 |
|
Inventories - Work
In Progress |
313,301.0 |
318,780.0 |
478,131.0 |
279,229.0 |
231,518.8 |
|
Inventories - Raw
Materials |
878,502.0 |
878,360.0 |
859,806.0 |
818,492.7 |
890,867.1 |
|
Inventories -
Other |
93,309.6 |
86,156.1 |
64,233.5 |
105,786.4 |
65,737.4 |
|
Total Inventory |
1,538,577.6 |
1,552,693.1 |
1,589,873.5 |
1,341,420.4 |
1,330,060.8 |
|
Prepaid Expenses |
199,404.3 |
181,245.5 |
205,474.6 |
9,408.9 |
7,421.4 |
|
Deferred Income
Tax - Current Asset |
- |
- |
- |
17,604.5 |
8,225.9 |
|
Other Current
Assets |
- |
0.0 |
0.0 |
- |
122.4 |
|
Other Current
Assets, Total |
- |
0.0 |
0.0 |
17,604.5 |
8,348.3 |
|
Total Current
Assets |
3,361,977.3 |
2,700,448.8 |
2,566,005.0 |
1,931,996.5 |
2,048,944.7 |
|
|
|
|
|
|
|
|
Buildings |
825,647.0 |
758,966.0 |
733,416.0 |
792,374.5 |
743,745.7 |
|
Land/Improvements |
436,950.0 |
437,143.0 |
436,527.0 |
431,727.8 |
381,943.7 |
|
Machinery/Equipment |
1,241,963.0 |
1,252,074.0 |
1,215,497.0 |
1,159,073.5 |
1,028,826.8 |
|
Construction
in Progress |
89,389.0 |
69,340.0 |
57,120.0 |
84,053.3 |
84,606.9 |
|
Other
Property/Plant/Equipment |
748.9 |
744.2 |
743.6 |
744.2 |
605.0 |
|
Property/Plant/Equipment
- Gross |
2,594,697.9 |
2,518,267.2 |
2,443,303.6 |
2,467,973.2 |
2,239,728.2 |
|
Accumulated
Depreciation |
-1,083,860.0 |
-1,046,712.0 |
-939,313.0 |
-908,684.1 |
-776,984.3 |
|
Property/Plant/Equipment
- Net |
1,510,837.9 |
1,471,555.2 |
1,503,990.6 |
1,559,289.1 |
1,462,743.9 |
|
Intangibles, Net |
63,145.2 |
55,699.9 |
51,933.9 |
30,796.2 |
12,248.4 |
|
LT Investment -
Affiliate Companies |
1,596.5 |
1,584.4 |
1,270.2 |
36,207.5 |
2,598.5 |
|
LT Investments -
Other |
436,305.7 |
546,484.8 |
409,458.1 |
259,719.1 |
96,517.2 |
|
Long Term
Investments |
437,902.3 |
548,069.2 |
410,728.3 |
295,926.5 |
99,115.7 |
|
Note Receivable - Long Term |
114,539.5 |
130,046.6 |
138,379.1 |
100,041.7 |
63,448.0 |
|
Deferred Income
Tax - Long Term Asset |
11,066.9 |
8,169.1 |
7,108.7 |
1,764.7 |
- |
|
Other Long Term
Assets |
277,590.0 |
257,894.5 |
234,783.7 |
214,287.4 |
170,625.1 |
|
Other Long Term
Assets, Total |
288,656.9 |
266,063.6 |
241,892.4 |
216,052.1 |
170,625.1 |
|
Total Assets |
5,777,059.1 |
5,171,883.2 |
4,912,929.4 |
4,134,102.1 |
3,857,125.8 |
|
|
|
|
|
|
|
|
Accounts Payable |
301,211.2 |
326,598.2 |
455,332.6 |
15,201.8 |
14,896.3 |
|
Accrued Expenses |
324,857.0 |
350,049.8 |
370,196.9 |
328,062.5 |
194,854.8 |
|
Notes Payable/Short Term Debt |
66,507.2 |
94,532.5 |
104,113.1 |
38,199.5 |
80,997.8 |
|
Current Portion - Long Term Debt/Capital
Leases |
505.6 |
447.9 |
280.4 |
210.3 |
- |
|
Customer Advances |
9,334.7 |
23,516.0 |
71,708.0 |
6,215.8 |
8,416.8 |
|
Income Taxes
Payable |
222,932.3 |
128,418.8 |
187,609.9 |
220,427.5 |
135,654.4 |
|
Other Payables |
- |
- |
- |
105,692.9 |
30,548.0 |
|
Other Current
Liabilities |
- |
- |
2,698.5 |
16,895.6 |
17,752.7 |
|
Other Current
liabilities, Total |
232,267.0 |
151,934.8 |
262,016.5 |
349,231.7 |
192,371.9 |
|
Total Current
Liabilities |
925,348.0 |
923,563.2 |
1,191,939.4 |
730,905.8 |
483,120.8 |
|
|
|
|
|
|
|
|
Long Term Debt |
1,539.6 |
2,026.4 |
2,474.3 |
2,732.7 |
1,402.0 |
|
Total Long Term
Debt |
1,539.6 |
2,026.4 |
2,474.3 |
2,732.7 |
1,402.0 |
|
Total Debt |
68,552.4 |
97,006.8 |
106,867.8 |
41,142.5 |
82,399.8 |
|
|
|
|
|
|
|
|
Deferred Income
Tax - LT Liability |
167,502.5 |
167,345.1 |
106,761.9 |
124,534.8 |
103,528.2 |
|
Deferred Income
Tax |
167,502.5 |
167,345.1 |
106,761.9 |
124,534.8 |
103,528.2 |
|
Minority Interest |
42,130.0 |
27,112.2 |
27,563.8 |
20,117.4 |
20,218.5 |
|
Reserves |
2,219.8 |
2,256.4 |
1,957.0 |
1,258.1 |
76,280.5 |
|
Pension Benefits -
Underfunded |
- |
- |
- |
86,392.5 |
99,506.4 |
|
Other Long Term
Liabilities |
82,139.7 |
68,688.9 |
105,959.8 |
25,050.8 |
27,524.9 |
|
Other
Liabilities, Total |
84,359.5 |
70,945.3 |
107,916.8 |
112,701.4 |
203,311.8 |
|
Total
Liabilities |
1,220,879.7 |
1,190,992.2 |
1,436,656.3 |
990,992.1 |
811,581.3 |
|
|
|
|
|
|
|
|
Common Stock |
954,959.5 |
954,959.5 |
954,959.5 |
954,959.5 |
954,959.5 |
|
Common Stock |
954,959.5 |
954,959.5 |
954,959.5 |
954,959.5 |
954,959.5 |
|
Additional Paid-In Capital |
5,332.7 |
5,320.5 |
2,869.3 |
465,866.0 |
335,349.6 |
|
Retained Earnings (Accumulated Deficit) |
3,330,585.7 |
2,779,281.3 |
2,277,114.7 |
2,134,736.0 |
2,061,348.6 |
|
Treasury Stock - Common |
-216,827.0 |
-226,944.7 |
-226,944.7 |
-414,947.3 |
-321,903.9 |
|
Unrealized Gain (Loss) |
- |
- |
- |
3,135.0 |
16,938.3 |
|
Translation
Adjustment |
- |
- |
- |
-639.2 |
-1,147.5 |
|
Other Equity |
482,128.5 |
468,274.4 |
468,274.4 |
- |
- |
|
Other Equity,
Total |
482,128.5 |
468,274.4 |
468,274.4 |
-639.2 |
-1,147.5 |
|
Total Equity |
4,556,179.4 |
3,980,891.0 |
3,476,273.2 |
3,143,110.0 |
3,045,544.5 |
|
|
|
|
|
|
|
|
Total
Liabilities & Shareholders’ Equity |
5,777,059.1 |
5,171,883.2 |
4,912,929.4 |
4,134,102.1 |
3,857,125.8 |
|
|
|
|
|
|
|
|
Shares Outstanding
- Common Stock Primary Issue |
127.6 |
127.2 |
128.7 |
130.8 |
133.2 |
|
Total Common
Shares Outstanding |
127.6 |
127.2 |
128.7 |
130.8 |
133.2 |
|
Treasury Shares - Common Stock Primary
Issue |
9.6 |
10.1 |
10.1 |
12.6 |
14.2 |
|
Employees |
4,214 |
4,653 |
4,750 |
4,367 |
4,317 |
|
Number of Common Shareholders |
104,382 |
132,863 |
105,512 |
107,629 |
120,524 |
|
Accumulated Intangible Amort, Suppl. |
20,105.0 |
15,217.0 |
- |
- |
- |
|
Deferred Revenue - Current |
9,334.7 |
23,516.0 |
71,708.0 |
6,215.8 |
8,416.8 |
|
Total Long Term Debt, Supplemental |
505.6 |
447.9 |
2,754.0 |
2,943.0 |
1,402.0 |
|
Long Term Debt Maturing within 1 Year |
505.6 |
447.9 |
280.0 |
210.0 |
97.5 |
|
Long Term Debt Maturing in Year 2 |
- |
- |
448.0 |
280.0 |
97.5 |
|
Long Term Debt Maturing in Year 3 |
- |
- |
504.0 |
446.0 |
259.0 |
|
Long Term Debt Maturing in Year 4 |
- |
- |
504.0 |
501.0 |
259.0 |
|
Long Term Debt Maturing in 2-3 Years |
- |
- |
952.0 |
726.0 |
356.5 |
|
Long Term Debt Maturing in 4-5 Years |
- |
- |
504.0 |
501.0 |
259.0 |
|
Long Term Debt Matur. in Year 6 &
Beyond |
0.0 |
0.0 |
1,018.0 |
1,506.0 |
689.0 |
FOREIGN EXCHANGE RATES
|
Currency |
Unit
|
Indian Rupees |
|
US Dollar |
1 |
Rs.49.53 |
|
UK Pound |
1 |
Rs.77.95 |
|
Euro |
1 |
Rs.64.66 |
RATING EXPLANATIONS
|
RATING |
STATUS |
PROPOSED CREDIT LINE |
|
|
>86 |
Aaa |
Possesses an extremely sound financial base with the strongest capability
for timely payment of interest and principal sums |
Unlimited |
|
71-85 |
Aa |
Possesses adequate working capital. No caution needed for credit
transaction. It has above average (strong) capability for payment of interest
and principal sums |
Large |
|
56-70 |
A |
Financial & operational base are regarded healthy. General
unfavourable factors will not cause fatal effect. Satisfactory capability for
payment of interest and principal sums |
Fairly Large |
|
41-55 |
Ba |
Overall operation is considered normal. Capable to meet normal
commitments. |
Satisfactory |
|
26-40 |
B |
Capability to overcome financial difficulties seems comparatively
below average. |
Small |
|
11-25 |
Ca |
Adverse factors are apparent. Repayment of interest and principal sums
in default or expected to be in default upon maturity |
Limited with
full security |
|
<10 |
C |
Absolute credit risk exists. Caution needed to be exercised |
Credit not
recommended |
|
---- |
NB |
New Business |
---- |
This score serves as a reference to assess SC’s credit risk
and to set the amount of credit to be extended. It is calculated from a
composite of weighted scores obtained from each of the major sections of this report.
The assessed factors and their relative weights (as indicated through %) are as
follows:
Financial
condition (40%) Ownership
background (20%) Payment
record (10%)
Credit history
(10%) Market trend
(10%) Operational
size (10%)
This report is issued at your request without any risk
and responsibility on the part of MIRA INFORM PRIVATE LIMITED (MIPL) or its
officials.