![]()
MIRA INFORM REPORT
|
Report Date : |
04.02.2012 |
IDENTIFICATION DETAILS
|
Name : |
GOLDEN
PRIZE CANNING CO., LTD. |
|
|
|
|
Registered Office : |
69
Jaransanitwong 49/1 Road,
Bangbamru, Bangplad, Bangkok 10700 |
|
|
|
|
Country : |
Thailand |
|
|
|
|
Financials (as on) : |
31.12.2010 |
|
|
|
|
Date of Incorporation : |
28.04.1998 |
|
|
|
|
Com. Reg. No.: |
0745541000592 |
|
|
|
|
Legal Form : |
Private Limited Company |
|
|
|
|
Line of Business : |
Manufacturer and exporter of canned food products |
|
|
|
|
No. of Employees
: |
1500 |
RATING & COMMENTS
|
MIRA’s Rating : |
Ba |
|
RATING |
STATUS |
PROPOSED CREDIT LINE |
|
|
41-55 |
Ba |
Overall operation is considered normal. Capable to meet normal
commitments. |
Satisfactory |
|
Status : |
Good |
|
|
|
|
Payment
Behaviour : |
No Complaints |
|
|
|
|
Litigation : |
Clear |
NOTES:
Any query related to this report can be made
on e-mail : infodept@mirainform.com
while quoting report number, name and date.
ECGC Country Risk Classification List – September 30th, 2011
|
Country Name |
Previous Rating (30.06.2011) |
Current Rating (30.09.2011) |
|
Thailand |
b1 |
b1 |
|
Risk Category |
ECGC
Classification |
|
Insignificant |
A1 |
|
Low |
A2 |
|
Moderate |
B1 |
|
High |
B2 |
|
Very High |
C1 |
|
Restricted |
C2 |
|
Off-credit |
D |
Company name
GOLDEN PRIZE
CANNING CO., LTD.
SUMMARY
BUSINESS
ADDRESS : 69
JARANSANITWONG 49/1 ROAD,
BANGBAMRU,
BANGPLAD, BANGKOK 10700, THAILAND
TELEPHONE : [66] 2434-8953-6,
2433-0201-4
FAX :
[66] 2433-5972
E-MAIL
ADDRESS : gprize@asiaaccess.net.th
REGISTRATION
ADDRESS : 55/4
MOO 3, KOKKHAM
ROAD, BANGYARAEK,
MUANG, SAMUTSAKORN
74000
ESTABLISHED
: 1998
REGISTRATION
NO. : 0745541000592
CAPITAL REGISTERED : BHT. 20,000,000
CAPITAL PAID-UP : BHT.
20,000,000
SHAREHOLDER’S PROPORTION : THAI : 100%
FISCAL YEAR CLOSING DATE : DECEMBER 31
LEGAL
STATUS : PRIVATE LIMITED
COMPANY
EXECUTIVE : MS.
SUKANYA PATTANASOPHON, THAI
MANAGING DIRECTOR
NO.
OF STAFF : 1,500
LINES
OF BUSINESS : CANNED FOOD
PRODUCTS
MANUFACTURER AND
EXPORTER
CORPORATE PROFILE
OPERATING
TREND : STABLE
PRESENT
SITUATION : OPERATING NORMALLY
REPUTATION : GOOD
WITH NORMAL BUSINESS
ENGAGEMENT
MANAGEMENT
STANDARD : MANAGEMENT WITH
GOOD PERFORMANCE
HISTORY
The subject was established
on April 28,
1998 as a
private limited company
under the name style GOLDEN PRIZE CANNING CO., LTD. by Thai groups. It
is one of
Thailand’s leading canned
seafood manufacturers and exporters which was applied
its advance processing
and quality control
systems supported by
international standards such
as HACCP, GMP,
PDA [approval [FCE No. 12029], EU
approval [Thailand] No. 2043], ITS for
non-GMO product. It
has the staff strength of 1,500.
The subject is
also a member
of Thai Food
Processors Association, Thai
Chamber of Commerce.
The subject’s registered address
is 55/4 Moo 3,
Kokkham Rd., Bangyapraek,
Muang, Samutsakorn 74000, while
the subject’s current
operation address is at
69 Jaransanitwong 49/1
Rd., Bangbamru, Bangplad,
Bangkok 10700.
THE BOARD OF DIRECTOR
Ms. Sukanya Pattanasophon
AUTHORIZED PERSON
The above director
signs on behalf
of the subject
with company’s affixed.
MANAGEMENT
Ms. Sukanya Pattanasophon is
the Managing Director.
She is Thai
nationality with the
age of 55
years old.
Mr. Preecha Chitsupa is
the Chief of
Production.
He is Thai
nationality.
Mr. Chanchit Vanasartkla is
the Factory Manager.
He is Thai
nationality.
BUSINESS OPERATIONS
The subject is engaged in
manufacturing service and
exporting various kinds
of canned seafood
products, such as
canned tuna, sardines,
pilchards, mackerel and
saury, under its own
brand name “GOLDEN
PRIZE”, as well
as various customer’s
brands.
PRODUCTION CAPACITY
Canned Tuna : 200
metric tons per
day
Canned Sardines / Mackerel : 80
metric tons per
day
Annual capacity : 5,000
twenty-feet containers
Cold storage capacity : 12,500
metric tons
PURCHASE
80% of the raw
material, food ingredient
& packaging materials
are purchased from
local suppliers and
agents, while the
remaining 20% especially tuna,
sardine, pilchards and
mackerel are imported
from Japan, Malaysia,
Indonesia, India, Republic
of China and
Singapore.
EXPORT [COUNTRY]
100% of its
products are exported
mainly to overseas
dealers in Europe,
United States of America,
Middle East, Africa
and Asian countries.
SUBSIDIARY AND AFFILIATED
COMPANY
The subject is
not found to
have any subsidiary
or affiliated company
here in Thailand.
LITIGATION
Bankruptcy and
Receivership
There are no
litigation on bankruptcy
and receivership cases
filed against the
subject found at
Legal Execution Department
for the past
five years.
Others
There are no
legal suits filed
against the subject
for the past
two years.
CREDIT
Local bills are
by cash or
on the credits
term of 30-60
days.
Imports are by
L/C at sight
or T/T.
Exports are against
T/T.
BUSINESS TRANSACTION
In term of
sales, the products
are sold to
overseas customers by
T/T on negotiated
terms. Occasionally late payment
is found and
it is acceptable
within 7 days. In term of purchasing, the products are
purchased from local
suppliers with the
maximum credit receive at
30-60 days and
from overseas suppliers
by L/C and
T/T. The subject
has no payment
problem on account payable.
BANKING
Kasikornbank Public Co.,
Ltd.
EMPLOYMENT
The subject employs
approximately 1,500 staff
comprising office, sales
and factory workers.
LOCATION DETAILS
The premise is
rented for administrative office
at the heading
address. Premise is
located in commercial/residential area.
Factory is located at 55/4 Moo 3, Kokkham Rd., Bangyapraek, Muang,
Samutsakorn 74000, Tel:
[66] 34 841-426,
Fax: [66] 34
841-428. Premise is
located on 100,000
square meters of
land.
REMARK
MAXIMUM CREDIT SHOULD
BE GRANTED AT
US$ 10,000,000.
COMMENT
The hefty export canned foods from
Thailand was recorded
in the past several
years. Thailand has emerged as one of the world’s leading suppliers
of seafood products to the world,
as well
as continue increasing on yearly
basis. The subject is
one of the leading
exporters of canned seafood
to international markets and
the outlook of the canned foods exports
appears to be quite strong. Its
sales is expected to increase over the
coming year, while consumption in the
world market remains constant.
FINANCIAL INFORMATION
The capital was
initially registered at
Bht. 1,000,000, divided
into 10,000 shares
of Bht. 100 each.
The capital was
increased later as
follows:
Bht. 10,000,000
on August 16,
1999
Bht. 20,000,000
on July 10,
2002
The latest registered
capital was increased
to Bht. 20,000,000
divided into 200,000
shares of Bht.
100 each with
fully paid.
THE SHAREHOLDERS LISTED
WERE : [as at
April 30, 2011]
|
NAME |
HOLDING |
% |
|
|
|
|
|
Mr. Phaisal Wangthamrongwit
Nationality: Thai Address : 185
Jaransanitwong Rd., Bangbamru, Bangplad, Bangkok
10700 |
157,600 |
78.80 |
|
Mrs. Truengta Pattanasophon Nationality: Thai Address : 185
Jaransanitwong Rd., Bangbamru, Bangplad, Bangkok
10700 |
40,000 |
20.00 |
|
Mr. Vichai Lohacharoon Nationality: Thai Address : 6/23
Moo 4, Jomthong,
Bangkok 10140 |
400 |
0.20 |
|
Ms. Wannee Pattanasophon Nationality: Thai Address : 723/920
Jaransanitwong Rd., Bangbamru,
Bangplad, Bangkok 10700 |
400 |
0.20 |
|
Ms. Varaporn Saenthien Nationality: Thai Address : 68/1
Moo 7, Donkamin,
Thamaka,
Kanchanaburi 71120 |
400 |
0.20 |
|
Ms. Duangporn Vithyapratsakul Nationality: Thai Address : 331-333
Trok Thevivorayart, Thepsirin,
Pomprab, Bangkok 10100 |
400 |
0.20 |
|
Mrs. Somnuek Nilsalab Nationality: Thai Address : 15/77
Moo 5, Omnoi, Krathumban,
Samutsakorn 74130 |
400 |
0.20 |
|
Ms. Kannikar Kongchanthuk Nationality: Thai Address : 150
Pakchong, Nakornratchasima 30130 |
400 |
0.20 |
Total Shareholders : 8
Share Structure [as
at April 30,
2011]
|
Nationality |
Shareholders |
No. of
Share |
% Shares |
|
|
|
|
|
|
Thai |
8 |
200,000 |
100.00 |
|
Foreign |
- |
- |
- |
|
Total |
8 |
200,000 |
100.00 |
NAME OF AUDITOR
& CERTIFIED PUBLIC
ACCOUNTANT NO. :
Mr. Siri Arayavibul No. 5130
BALANCE SHEET [BAHT]
The
latest financial figures
published for December
31, 2010 &
2009 were:
ASSETS
|
Current Assets |
2010 |
2009 |
|
|
|
|
|
Cash and Cash Equivalents |
253,593,096.55 |
11,966,612.72 |
|
Trade Accounts Receivable |
88,715,146.78 |
242,003,534.64 |
|
Inventories |
355,890,934.53 |
324,709,379.37 |
|
Other Current Assets
|
245,101,295.45 |
67,811,668.28 |
|
|
|
|
|
Total Current Assets
|
943,300,473.31 |
646,491,195.01 |
|
Fixed Assets |
280,609,988.99 |
238,360,915.57 |
|
Other Assets |
2,216,883.81 |
2,212,883.81 |
|
Total Assets |
1,226,127,346.11 |
887,064,994.39 |
LIABILITIES &
SHAREHOLDERS' EQUITY [BAHT]
|
Current
Liabilities |
2010 |
2009 |
|
|
|
|
|
Bank Overdraft &
Short-term Loan from Financial Institutions |
4,347,509.64 |
25,070,941.59 |
|
Trust Receipt Payable |
626,153,562.22 |
177,028,975.59 |
|
Trade Accounts &
Notes Payable |
190,695,943.31 |
203,993,285.26 |
|
Short-term Loan from
Person or Related
Company |
141,405,226.18 |
219,495,833.52 |
|
Other Current Liabilities |
91,206,249.18 |
127,226,763.30 |
|
|
|
|
|
Total Current Liabilities |
1,053,808,490.53 |
752,815,799.26 |
|
Long-term Loan from Person or Related Company |
22,990,854.69 |
- |
|
Total Liabilities |
1,076,799,345.22 |
752,815,799.26 |
|
|
|
|
|
Shareholders' Equity |
|
|
|
|
|
|
|
Share capital : Baht 100
par value authorized, issued
and fully paid share
capital 200,000 shares |
20,000,000.00 |
20,000,000.00 |
|
|
|
|
|
Capital Paid |
20,000,000.00 |
20,000,000.00 |
|
Retained Earning -
Unappropriated |
129,328,000.89 |
114,249,195.13 |
|
Total Shareholders' Equity |
149,328,000.89 |
134,249,195.13 |
|
Total Liabilities & Shareholders' Equity |
1,226,127,346.11 |
887,064,994.39 |
PROFIT & LOSS ACCOUNT
|
Revenue |
2010 |
2009 |
|
|
|
|
|
Sales |
3,220,003,114.13 |
3,033,588,029.34 |
|
Other Income |
8,034,462.39 |
12,290,004.90 |
|
Total Revenues |
3,228,037,576.52 |
3,345,878,034.24 |
|
Expenses |
|
|
|
|
|
|
|
Change in Finished Goods |
[36,570,361.64] |
27,684,577.81 |
|
Purchase of Goods |
76,281,901.20 |
56,070,802.86 |
|
Raw Material and Material Supplies |
2,630,239,006.43 |
2,483,548,996.27 |
|
Employees Expenses |
146,454,338.21 |
110,799,086.97 |
|
Depreciation |
47,298,869.45 |
49,714,870.97 |
|
Commission |
10,865,627.74 |
12,551,197.11 |
|
Electrical & Water |
40,192,748.92 |
38,481,616.81 |
|
Other Expenses |
287,978,921.32 |
239,010,483.81 |
|
Total Expenses |
3,202,741,051.63 |
3,017,861,632.61 |
|
|
|
|
|
Profit / [Loss] before Financial Cost |
25,296,524.89 |
28,016,401.63 |
|
Financial Cost |
[3,252,105.94] |
[3,694,038.97] |
|
Profit / [Loss] before Income Tax |
22,044,418.95 |
24,322,362.66 |
|
Income Tax |
[6,965,613.19] |
[7,831,350.08] |
|
|
|
|
|
Net Profit / [Loss] |
15,078,805.76 |
16,491,012.58 |
FINANCIAL ANALYSIS
|
ITEM |
UNIT |
2010 |
2009 |
|
|
|
|
|
|
LIQUIDITY RATIO |
|
|
|
|
CURRENT RATIO |
TIMES |
0.90 |
0.86 |
|
QUICK RATIO |
TIMES |
0.32 |
0.34 |
|
|
|
|
|
|
ACTIVITY RATIO |
|
|
|
|
FIXED ASSETS TURNOVER |
TIMES |
11.48 |
12.73 |
|
TOTAL ASSETS TURNOVER |
TIMES |
2.63 |
3.42 |
|
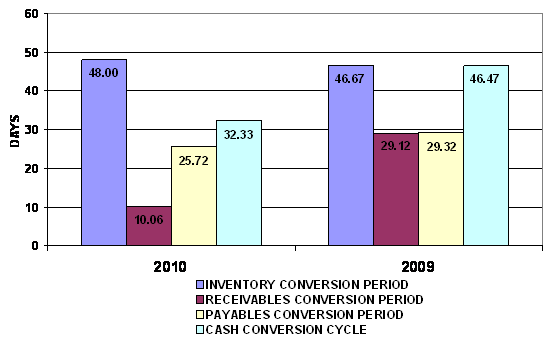
INVENTORY CONVERSION PERIOD |
DAYS |
48.00 |
46.67 |
|
INVENTORY TURNOVER |
TIMES |
7.60 |
7.82 |
|
RECEIVABLES CONVERSION PERIOD |
DAYS |
10.06 |
29.12 |
|
RECEIVABLES TURNOVER |
TIMES |
36.30 |
12.54 |
|
PAYABLES CONVERSION PERIOD |
DAYS |
25.72 |
29.32 |
|
CASH CONVERSION CYCLE |
DAYS |
32.33 |
46.47 |
|
|
|
|
|
|
PROFITABILITY
RATIO |
|
|
|
|
COST OF GOODS SOLD |
% |
84.05 |
83.72 |
|
SELLING & ADMINISTRATION |
% |
6.47 |
7.89 |
|
INTEREST |
% |
0.10 |
0.12 |
|
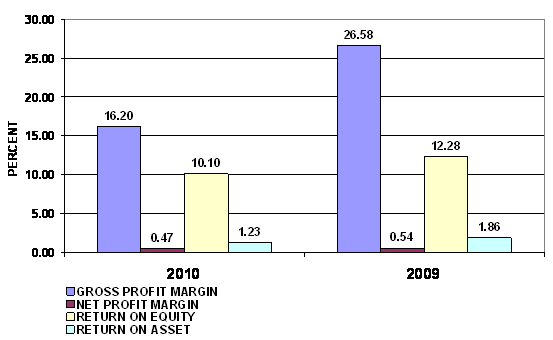
GROSS PROFIT MARGIN |
% |
16.20 |
26.58 |
|
NET PROFIT MARGIN BEFORE EX. ITEM |
% |
0.79 |
10.81 |
|
NET PROFIT MARGIN |
% |
0.47 |
0.54 |
|
RETURN ON EQUITY |
% |
10.10 |
12.28 |
|
RETURN ON ASSET |
% |
1.23 |
1.86 |
|
EARNING PER SHARE |
BAHT |
75.39 |
82.46 |
|
|
|
|
|
|
LEVERAGE RATIO |
|
|
|
|
DEBT RATIO |
TIMES |
0.88 |
0.85 |
|
DEBT TO EQUITY RATIO |
TIMES |
7.21 |
5.61 |
|
TIME INTEREST EARNED |
TIMES |
7.78 |
88.80 |
|
|
|
|
|
|
ANNUAL GROWTH |
|
|
|
|
SALES GROWTH |
% |
6.15 |
|
|
OPERATING PROFIT |
% |
(92.29) |
|
|
NET PROFIT |
% |
(8.56) |
|
|
FIXED ASSETS |
% |
17.72 |
|
|
TOTAL ASSETS |
% |
38.22 |
|
PROFITABILITY RATIO
|
Gross Profit Margin |
16.20 |
Satisfactory |
Industrial Average |
17.06 |
|
Net Profit Margin |
0.47 |
Impressive |
Industrial Average |
(0.54) |
|
Return on Assets |
1.23 |
Impressive |
Industrial Average |
(0.89) |
|
Return on Equity |
10.10 |
Impressive |
Industrial Average |
3.14 |
Gross Profit Margin used to assess a firm's financial health by revealing
the proportion of money left over from revenues after accounting for the cost
of goods sold. Gross profit margin serves as the source for paying additional
expenses and future savings. The company's figure is 16.2%. When compared with
the industry average, the ratio of the company was lower. This indicated that
company was originated from the problems with control over its costs.
Net Profit Margin is the indicator of the company's efficiency in that
net profit takes into consideration all expenses of the company. A low profit
margin indicates a low margin of safety, higher risk that a decline in sales
will erase profits and result in a net loss. Net Profit Margin ratio is 0.47%,
higher figure when compared with those of its average competitors in the same
industry, indicated that business was an efficient operator in a dominant
position within its industry.
Return on Assets measures how efficiently profits are being generated
from the assets employed in the business when compared with the ratios of firms
in a similar business. A low ratio in comparison with industry averages
indicates an inefficient use of business assets. Return on Assets ratio is
1.23%, higher figure when compared with those of its average competitors in the
same industry, indicated that business was an efficient profit in a dominant position within its industry.
Return on Equity indicates how profitable a company is by comparing its
net income to its average shareholders' equity, ROE measures how much the
shareholders earned for their investment in the company. Return on Equity ratio
is 10.1%, higher figure when compared with those of its average competitors in
the same industry, indicated that business was an efficient profit in a
dominant position within its industry.
Trend of the
average competitors in the same industry for last 5 years
Return on Assets Downtrend
Return on Equity Uptrend

LIQUIDITY RATIO
|
Current Ratio |
0.90 |
Risky |
Industrial Average |
43.96 |
|
Quick Ratio |
0.32 |
|
|
|
|
Cash Conversion Cycle |
32.33 |
|
|
|
The Current Ratio is to ascertain whether a company's short-term assets
are readily available to pay off its short-term liabilities. The company's figure
is 0.9 times in 2010, increase from 0.86 times, then the company may have
problems meeting its short-term obligations. When compared with the industry
average, the ratio of the company was lower.
The Quick Ratio is a liquidity indicator that further refines the
current ratio by measuring the amount of the most liquid current assets there
are to cover current liabilities. The company's figure is 0.32 times in 2010,
decrease from 0.34 times, then the company has not enough current assets that
presumably can be quickly converted to cash for pay financial obligations.
The Cash Conversion Cycle measures the number of days a company's cash
is tied up in the production and sales process of its operations and the
benefit from payment terms from its creditors. It meant the company could
survive when no cash inflow was received from sale for 33 days.
Trend of the
average competitors in the same industry for last 5 years
Current Ratio Uptrend


LEVERAGE RATIO
|
Debt Ratio |
0.88 |
Acceptable |
Industrial Average |
0.84 |
|
Debt to Equity Ratio |
7.21 |
Risky |
Industrial Average |
1.77 |
|
Times Interest Earned |
7.78 |
Impressive |
Industrial Average |
(72.61) |
Debt to Equity Ratio a measurement of how much suppliers, lenders, creditors
and obligors have committed to the company versus what the shareholders have
committed. A lower the percentage means that the company is using less leverage
and has a stronger equity position.
Times Interest Earned measuring a company's ability to meet its debt
obligations. Ratio is 7.78 higher than 1, so the company can pay interest
expenses on outstanding debt.
Debt Ratio shows the proportion of a company's assets which are financed
through debt. The company's figure is 0.88 greater than 0.5, most of the
company's assets are financed through debt.
Trend of the
average competitors in the same industry for last 5 years
Debt Ratio Uptrend
Times Interest Earned Downtrend
ACTIVITY RATIO
|
Fixed Assets Turnover |
11.48 |
Deteriorated |
Industrial Average |
37,907.43 |
|
Total Assets Turnover |
2.63 |
Deteriorated |
Industrial Average |
5.83 |
|
Inventory Conversion Period |
48.00 |
|
|
|
|
Inventory Turnover |
7.60 |
Deteriorated |
Industrial Average |
61.29 |
|
Receivables Conversion Period |
10.06 |
|
|
|
|
Receivables Turnover |
36.30 |
Impressive |
Industrial Average |
28.37 |
|
Payables Conversion Period |
25.72 |
|
|
|
Trend of the
average competitors in the same industry for last 5 years
Fixed Assets Turnover Uptrend
Total Assets Turnover Uptrend
Inventory Turnover Uptrend
Receivables Turnover Uptrend
FOREIGN EXCHANGE RATES
|
Currency |
Unit
|
Indian Rupees |
|
US Dollar |
1 |
Rs.48.96 |
|
UK Pound |
1 |
Rs.77.47 |
|
Euro |
1 |
Rs.64.39 |
RATING EXPLANATIONS
|
RATING |
STATUS |
PROPOSED CREDIT LINE |
|
|
>86 |
Aaa |
Possesses an extremely sound financial base with the strongest
capability for timely payment of interest and principal sums |
Unlimited |
|
71-85 |
Aa |
Possesses adequate working capital. No caution needed for credit
transaction. It has above average (strong) capability for payment of interest
and principal sums |
Large |
|
56-70 |
A |
Financial & operational base are regarded healthy. General unfavourable
factors will not cause fatal effect. Satisfactory capability for payment of
interest and principal sums |
Fairly Large |
|
41-55 |
Ba |
Overall operation is considered normal. Capable to meet normal
commitments. |
Satisfactory |
|
26-40 |
B |
Capability to overcome financial difficulties seems comparatively
below average. |
Small |
|
11-25 |
Ca |
Adverse factors are apparent. Repayment of interest and principal sums
in default or expected to be in default upon maturity |
Limited with full
security |
|
<10 |
C |
Absolute credit risk exists. Caution needed to be exercised |
Credit not
recommended |
|
---- |
NB |
New Business |
---- |
This score serves as a reference to assess SC’s credit risk and
to set the amount of credit to be extended. It is calculated from a composite
of weighted scores obtained from each of the major sections of this report. The
assessed factors and their relative weights (as indicated through %) are as
follows:
Financial
condition (40%) Ownership
background (20%) Payment
record (10%)
Credit history
(10%) Market trend
(10%) Operational
size (10%)
This report is issued at your request without any
risk and responsibility on the part of MIRA INFORM PRIVATE LIMITED (MIPL)
or its officials.