MIRA
INFORM REPORT
|
Report Date : |
03.07.2012 |
IDENTIFICATION DETAILS
|
Name : |
CONFECTION TISSAGE TEXTILE DU NORD |
|
|
|
|
Registered Office : |
13 Rue B ‑ |
|
|
|
|
Country : |
|
|
|
|
|
Financials (as on) : |
31.12. 2010 |
|
|
|
|
Year of Establishment : |
1980 |
|
|
|
|
Com. Reg. No.: |
9327 |
|
|
|
|
Legal Form : |
Societe A Responsibilite Limitee |
|
|
|
|
Line of Business : |
Weaving and finishing of textiles. |
|
|
|
|
No. of Employees : |
65 |
RATING & COMMENTS
|
MIRA’s Rating : |
B |
|
RATING |
STATUS |
PROPOSED CREDIT LINE |
|
|
26-40 |
B |
Capability to overcome financial difficulties seems comparatively
below average. |
Small |
|
Status : |
Moderate |
|
Payment Behaviour : |
No Complaints |
|
Litigation : |
Clear |
NOTES :
Any query related to this report can be made
on e-mail: infodept@mirainform.com
while quoting report number, name and date.
ECGC Country Risk Classification List – March 31st, 2012
|
Country Name |
Previous Rating (31.12.2011) |
Current Rating (31.03.2012) |
|
Morocco |
A2 |
A2 |
|
Risk Category |
ECGC
Classification |
|
Insignificant |
A1 |
|
Low |
A2 |
|
Moderate |
B1 |
|
High |
B2 |
|
Very High |
C1 |
|
Restricted |
C2 |
|
Off-credit |
D |
Company name
CONFECTION TISSAGE TEXTILE DU NORD
Rating Briefing
Payment Record: NO COMPLAINTS
This rating is based on available data. In the event of additional information a
possibility for a different rating applies.
Registration Briefing
Registration
Number: 9327
Registration
Date: 1980
Legal
Form: SOCIETE
A RESPONSIBILITE LIMITEE
Latest
Financials: December
31, 2010
Financial Briefing
Nominal
Capital: 8,000,000
Moroccan Dirham
Issued
Capital: N/A
Turnover: 46,734,471
Moroccan Dirham
Net
Profit: 1,685,691
Moroccan Dirham
Net
Worth: 5,115,028
Moroccan Dirham
Company Details
Company
Name: CONFECTION
TISSAGE TEXTILE DU NORD
Also
trades as: COTITENORD
SARL
Company
acronym:
Headquarter
Address: 13
Rue B ‑ Lot Al Majd,
Tanger
90000,
Morocco
Telephone: +212539
350004
Fax: +212539
350804
E‑Mail: cotitenord@menara.ma
Company
was originally started on 1980
Registration & Legal Details
Current
Legal Form: SOCIETE
A RESPONSIBILITE LIMITEE
Registration
Address: 128 Rue
Oujda, Docks Monopol N° 4,
Tanger
Registration
Number: 9327
Registration
Date: 1980
Year/Date
Company Established: 1980
Registration
Town: Tanger
Tax
Registration Number: 04903468
Capital
Currency: Moroccan
Dirham
Authorized
Capital: 8,000,000
Paid
Up Capital: 8,000,000
Authorized Capital Breakdown
Number of Shares: 80,000 Type of Shares: None Selected
Issued
Shares: 80,000 Value
per share: MDH 100.00 Value of this
type: 8,000,000.00
Shareholders / Owners
Shareholders:
Name/Other
Information Shares
Held % of Voting/Non‑Voting
capital
Mr.
Omar Bennis, 72,000 90.00%
(VOTING)
124,
Rue Sidi Mohamed Ben Abdellah,
Tanger,
Morocco
Ms.
Ghita Bennis, 8,000 10.00%
(VOTING)
124,
Rue Sidi Mohamed Ben Abdellah,
Tanger,
Morocco
Principals
Name: Mr
Omar Bennis
Position
within the company: Managing
director
Country
of Birth: Morocco
Nationality: Moroccan
Can
fluently speak: Arabic
& French
Name: Mr
Moncef Boungab
Position
within the company: Financial
Manager
Country
of Birth: Morocco
Nationality: Moroccan
Can
fluently speak: Arabic
& French
Name: Ms
Ghita Bennis
Position
within the company: Import
Manager
Country
of Birth: Morocco
Nationality: Moroccan
Can
fluently speak: Arabic,
French & English
Company Activities
NACE
Codes: 1320 Weaving of textiles
1330 Finishing of textiles
The
company is involved in weaving and finishing of textiles.
Subject
imports 80% of raw materials from China, Egypt & India and purchases the
other 20% locally.
Subject
distributes 100% of manufactured products on a wholesale basis to the local
market.
Local
Reporters consider the investigated company to be MEDIUM in their field of
concern.
Operations
Employees Company
Employs: 65
HQ Premises Operates
from: Owned Office , Factory,
Warehouse
Location: Industrial Area
Branches 24
Rue Lalla Chafia,
Tanger,
Morocco
Branch
is: Rented
Description
of branch: Shop
24
Rue Haroun Rachid,
Tanger,
Morocco
Branch
is: Rented
Description
of branch: Shop
Imports
Import
% and type of product: 80% Raw
Materials
Imports
From: China,
Egypt, India
Importing
Terms: 90‑120
days credit, letters of credit
Exports
Export
% and type of product: Subject does
not export
Trading & Selling
Territory: 100%
Nationally
Type of Customer: Group Companies,
Distributors & Resellers
Vehicles: Total number of vehicles: 5
2
vans
3
cars
Related Companies
Subsidiaries
Affiliates
Information
on Related Companies is not available/applicable
Bankers
Banque
Marocaine pour le Commerce et l'Industrie,
Branch:
Tanger Succursale
Angle
Boulevard Youssef Ibn Tachfine et Boulevard de Madrid,
Tanger,
Morocco
Société
Générale,
Branch:
Tanger Principale
58
Boulevard Mohammed V,
Tanger,
Morocco
Financial Information
Financial
Interview Date: 02/07/2012
Source: Companies
Registry
Figures
are: Official
Figures
Currency: Moroccan
Dirham
Months Sales Figures Sales Gross
Profit/Loss Net Profit/Loss
12 31/12/2010 46,734,471 1,919,364 1,685,691
12 31/12/2009 31,841,605 603,744 444,535
12 31/12/2008 17,728,311 (7,008,506) (7,097,150)
Balance Sheet & Profit &
Loss
BALANCE
SHEET
31‑Dec‑2010 31‑Dec‑2009 31‑Dec‑2008
Fixed
Assets
Land & Buildings 3,311,234 3,486,385 3,637,423
Plant & Machinery 3,581,698 4,005,659 3,558,103
Furniture & Equipment 142,884 190,849 269,310
Motor
Vehicles
Misc. Fixed
Assets
Total Fixed Assets 7,035,816 7,682,893 7,464,836
Financial
Assets
Shares in
Related Companies
Loans to
related companies
Investments
Deposits
Misc. Financial Assets 28,878 28,878 28,878
Total Financial Assets 28,878 28,878 28,878
Intangibles
Goodwill 737,615 737,615 737,615
Organisational
Expenses
Patents
Misc.
Intangible Assets
Total Intangible Assets 737,615 737,615 737,615
Current
Assets
Stock 15,923,052 7,671,700 261,985
Stock & Work in Progress 4,184,868 4,196,076 2,046,653
Trade Debtors & receivables 6,975,326 5,708,284 15,664,619
Provision
for bad debs
Other
receivables
Due from
related companies
Owed by
shareholders
Prepaid
expenses
Cash 1,153,593 39,315 94,216
Tax recoverable 2,227,168 2,147,085 1,378,705
Marketable Securities
Misc. Current Assets 6,914 7,637
Total Current Assets 30,464,007 19,769,374 19,453,815
Total Assets 38,266,316 28,218,760 27,685,144
Owner's
Equity & Liabilities
Issued and paid up capital 8,000,000 8,000,000 8,000,000
Share
premium account
Retained earnings ‑4,570,663 ‑5,015,198 1,953
Net profit/Loss for the year 1,685,691 444,535 ‑7,097,150
Revaluation
reserves
Legal
Reserves
800,000
Other
reserves
1,280,000
Net Worth 5,115,028 3,429,337 2,984,803
Deffered Taxation
Provisions/allowances 123,250 123,250 123,250
Mortgages/Loans
Hire
purchase
Due to group
of companies
Minority
interest
Misc.
deferred liabilities
Total Long Term Liabilities 123,250 123,250 123,250
Current
Liabilities
Creditors 22,514,609 17,056,752 14,919,252
Other creditors 1,850,000 1,850,000 1,850,000
Accruals 70,093 67,065 47,821
Bank overdrafts/Loans 3,188,423 675,529 1,332,514
Misc. Loans
Directors
accounts
Owing to shareholders 4,192,568 3,992,568 3,792,568
Owing to
related companies
Proposed
dividend
Long Term‑due
1 year
Hire
Purchase‑under 1 year
Taxation 1,130,366 993,352 2,604,108
Advance
receipts
Misc. Current Liabilities 81,979 30,907 30,828
Total Current Liabilities 33,028,038 24,666,173 24,577,091
Owner's Equity & Liabilities 38,266,316 28,218,760 27,685,144
PROFIT
& LOSS
Figures
are: Figures are: Figures are:
Fiscal
Year
Fiscal Year of Establishment Fiscal Year
01/01/2010 to 31/12/2010
01/01/2009 to 31/12/2009 01/01/2008to
31/12/2008
Total Income/Turnover 46,734,471 31,841,605 17,728,311
Cost
of sales
82,251
Gross Profit/(Loss) 46,734,471 31,841,605 17,646,060
Admin/selling expenses 39,162,822 27,868,298 17,386,240
Services 1,303,460 1,681,152 1,351,541
Salaries 4,246,674 3,185,702 2,984,464
Auditors Fee 94,986 81,136 83,569
Stock Depreciation ‑1,178,690 ‑2,620,393 ‑4,067,282
Depreciation 1,164,876 1,041,961 6,913,950
Misc. Operating Expenses 1 5 9
Misc.
Operating Income
Net Operating Profit/(Loss) 1,940,342 603,744 ‑7,006,431
Interest
Receivable/Finance Income
Group
related income
Misc.
Financial Income
Total Financial Income 0 0 0
Interest
Payable/Finance costs
Misc. financial expenses
20,978
2,075
Total Financial Expenses 20,978 0 2,075
Profit/(Loss) before taxes 1,919,364 603,744 ‑7,008,506
Income Tax 233,673 159,209 88,644
Other Tax
Profit/(Loss) after taxes 1,685,691 444,535 ‑7,097,150
Extraordinary
items
Exceptional
items
Misc. Items
Net Profit/(Loss) 1,685,691 444,535 ‑7,097,150
Previous
years retained earnings
Current years net income
1,685,691 444,535
Misc.
additions in current year
Current
years net loss ‑7,097,150
Dividends in
current year
Withdrawals
in current year
Misc.
deductions in current year
Retained earnings at end of 1,685,691 444,535 ‑7,097,150
financial
period
Average
employees
Directors
fee
Earnings per
share
Earnings per
share‑previous year
Auditors Comments
Date
accounts obtained: 02/07/2012
Accounts
obtained from: Companies
registry
Auditors
Opinion: The
audited financial statement gives a true and fair view of the state of affairs
of the
subject
Financial
Statements have been prepared on an on‑going basis.
Assuming
support of: shareholders
FINANCIAL RATIOS / COMPARATIVE DATA
Actual
Company Industrial Averages Actual Company Industrial Averages
Results
(2010) (2010) Results (2009) (2009)
Liquidity
Ratios
Current Ratio 0.92 1.63 0.80 1.57
Acid Test Ratio 0.31 1.07 0.32 1.07
Accounts 0.48 0.33 0.54 0.35
Payable/Sales
Ratio
Current Liabilities/Net 6.46 0.73 7.19 3.06
Worth
Current 1.64 2.61 2.08 3.16
Liabilities/Inventory
Total Liabilities/Net 6.48 ‑0.44 7.23 3.47
Worth
Fixed Assets/Net 137.55 ‑78.28 224.03 112.83
Worth (%)
Profitability
Ratios
Gross Profit Ratio (%) 100.00 94.85 100.00 93.82
Return on Capital 36.64 3.19 16.99 13.17
Employed
(ROCE)(%)
Net Profit/Sales (%) 4.11 ‑4.72 1.90 ‑7.56
Return on Assets (%) 5.02 3.90 2.14 2.98
Efficiency
Ratios
Sales/Working Capital ‑18.23 21.96 ‑6.50 2.92
Assets/Sales(%) 81.88 171.36 88.62 170.83
Shareholders 37.52 17.66 17.61 11.08
Return(%)
Average Collection 49.53 121.47 122.50 116.51
Period
Sales/Inventory 2.32 4.55 2.68 6.78
Leverage
Ratios
Capital Employed 10.68 3.63 11.83 4.85
Capital Structure (%) 2.35 25.25 3.47 26.82
Number of 369 369
Companies
within the
industry
(NACE C)
Statistics
based on Manufacturing Manufacturing
NACE(C)
The
statistical Industrial Average results are calculated against
companies
within the database for the specific country.
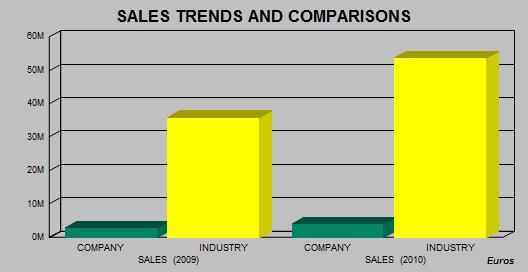
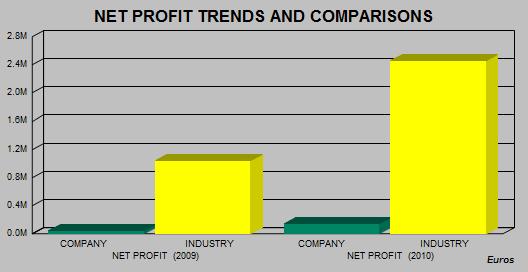
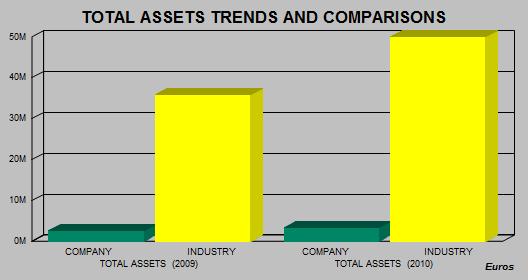
INDUSTRY
SECTOR COMPARATIVE DATA
Elements Taken Result for specific RANKING Total Companies Used
company
DATE OF REGISTRATION 1980 1 769
TOTAL EMPLOYEES 65 502 758
SALES (2010) 4,108,895 132 224
SALES (2009) 2,799,514 228 353
NET PROFIT (2010) 148,206 82 198
NET PROFIT (2009) 39,084 205 359
TOTAL ASSETS (2010) 3,364,375 121 194
TOTAL ASSETS (2009) 2,480,993 233 360
Currency:
EUROS
Rankings
The results given below are calculated against companies
with the Database for the specific country.
Scale: 1 is the highest result found in our
database.
Example: Ranking 5: Total Companies used to
generate the Ranking : 20
This means that this company is the 5th largest
company out of 20 found in our database in the specific industry
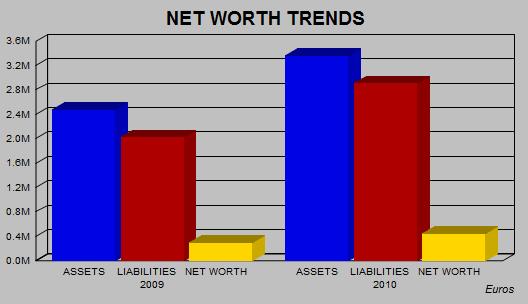
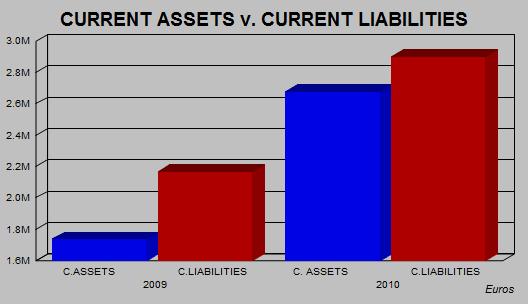
Charts of Financial Trends and Industry Comparisons
PLEASE
NOTE THAT CHARTS ARE SHOWN IN EUROS FOR TREND AND COMPARISON PURPOSES
The
statistical Industrial Average results are calculated against companies within the
database for the
specific
country.
Payments
Subject's
payments reported to be: NO COMPLAINTS
Representation
Other Comments
Other
Comments: Patent
N° : 50486725
Interview & Reporter Comments
Name/Title: Mr. Moncef Boungab Financial Manager
Comment: Subject has confirmed the general details shown in the report.
Reporter Comment: All legal forms in Morocco are obliged by law to be registered with the Registry Office (OMPIC :
Office Marocain De La Propriete Industrielle Et Commerciale) which is publicly available.
Subject was found registered and Information obtained from above official source is as follows :
Registered name / registration number / date of registration / registered address / legal form /
capital / main principals – administrators / shareholders / shareholders% / financial information.
According to the Morocco Commercial Law, all legal forms except for proprietorship entities are
obliged to file their financial accounts to the OMPIC.
Any other data stated in the report was obtained directly from the subject company and/or other
publicly available information. Therefore it should be used as a point of reference as it is not
possible to verify such data with official sources.
Conclusions
Local Reputation: The company being investigated is considered by local reporters to be a Fair / Normal Trade Risk.
Owner/Shareholders Comments: All or most of the owners / shareholders have an active participation in the running of the business.
Financial Results Trend: Financial Information indicates that the business activities of the company are
showing an upward turn.
Age of Business: The company is a long established family run business.
Country Intelligence Information
Country: Morocco
Date: 19/06/2012 00:00:00
Source: Economist Intelligence Unit
Economy: Fiscal situation remains difficult in the first quarter
June 2nd 2012
Government expenditure rose by 13.9% year on year in the first quarter of 2012, to Dh61.2bn
(US$7bn). Current spending (excluding subsidies) grew at a rapid rate of 8.7% to Dh46.3bn, but
subsidy costs were the main driver of the sharp rise in spending, increasing by 33.8% year on year to
Dh14.9bn. This follows a surge in subsidy spending in 2011 and therefore comes off an already
elevated base. The energy import bill grew by 27.2% year on year in the first quarter of 2012, to
Dh21bn. Subsidies are a major burden on the public finances and are also highly erratic. In
1999‑2004 the cost of subsidies did not exceed an average of Dh5bn a year. Between 2005 and 2011
it ranged between Dh11bn in 2005 and a peak of Dh49bn in 2011, more than 50% higher than its
previous record level in 2008 (Dh31bn). The new government has suggested that it will introduce a
long‑awaited reform of the subsidy fund by the end of 2012 (February 2012, Economic policy), but the
authorities are likely to tread carefully in such a politically sensitive area, and any proposal is unlikely
to change the situation radically.
The wage bill remains another major strain on the public finances. It has grown from an annual
average of Dh48bn in 1999‑2004 to Dh89bn in 2011. The wages and salaries bill expanded by 17%
year on year to Dh24.9bn in the first quarter of 2012, accounting for 41% of ordinary expenditure. In
these particularly turbulent times, the government will find it hard to cut back the public‑sector
workforce.
Risk: Sovereign risk
Stable. Morocco's fiscal account will remain deeply in deficit, owing to high recurrent expenditure on
subsidies and wages, but the shortfalls should be financed mostly by borrowing from domestic
banks, thus keeping the external debt stock in check, although some new borrowing is likely.
Currency risk
Stable. The current exchange‑rate system—a managed float—will remain in place. The Moroccan
dirham will strengthen against the troubled euro, causing exporters problems in their main market,
but the central bank has some capacity to intervene, although foreign‑exchange reserves are falling.
Banking sector risk
Stable. The banking sector has benefited from prudential regulation, relatively low levels of
non‑performing loans (although these are rising) and limited direct foreign exposure, but government
borrowing from the banks is a concern.
Political risk
The government will increase public spending in the short term to quell political and social protests
over unemployment and poverty. Tensions over the disputed territory of Western Sahara may also
lead to violent demonstrations.
Economic structure risk
Dependence on agriculture leaves economic performance vulnerable to weather conditions. The fiscal
and external deficits fluctuate in line with movements in international commodity prices but are
manageable.
FOREIGN EXCHANGE RATES
|
Currency |
Unit
|
Indian Rupees |
|
US Dollar |
1 |
Rs.55.83 |
|
|
1 |
Rs.87.41 |
|
Euro |
1 |
Rs.70.43 |
INFORMATION DETAILS
|
Report Prepared
by : |
PRL |
RATING EXPLANATIONS
|
RATING |
STATUS |
PROPOSED CREDIT LINE |
|
|
>86 |
Aaa |
Possesses an extremely sound financial base with the strongest capability
for timely payment of interest and principal sums |
Unlimited |
|
71-85 |
Aa |
Possesses adequate working capital. No caution needed for credit
transaction. It has above average (strong) capability for payment of interest
and principal sums |
Large |
|
56-70 |
A |
Financial & operational base are regarded healthy. General
unfavourable factors will not cause fatal effect. Satisfactory capability for
payment of interest and principal sums |
Fairly Large |
|
41-55 |
Ba |
Overall operation is considered normal. Capable to meet normal
commitments. |
Satisfactory |
|
26-40 |
B |
Capability to overcome financial difficulties seems comparatively
below average. |
Small |
|
11-25 |
Ca |
Adverse factors are apparent. Repayment of interest and principal sums
in default or expected to be in default upon maturity |
Limited with
full security |
|
<10 |
C |
Absolute credit risk exists. Caution needed to be exercised |
Credit not
recommended |
|
-- |
NB |
New Business |
-- |
This score serves as a reference to assess SC’s credit risk
and to set the amount of credit to be extended. It is calculated from a
composite of weighted scores obtained from each of the major sections of this report.
The assessed factors and their relative weights (as indicated through %) are as
follows:
Financial
condition (40%) Ownership
background (20%) Payment
record (10%)
Credit history
(10%) Market trend
(10%) Operational
size (10%)
This report is issued at your request without any risk
and responsibility on the part of MIRA INFORM PRIVATE LIMITED (MIPL) or its
officials.