MIRA
INFORM REPORT
|
Report Date : |
05.07.2012 |
IDENTIFICATION DETAILS
|
Name : |
LABORATOIRES PHARMACEUTIQUES PHARMA 5 SA |
|
|
|
|
Registered Office : |
21 Rue Des Asphodeles, Maarif, |
|
|
|
|
Country : |
|
|
|
|
|
Financials (as on) : |
31.12.2010 |
|
|
|
|
Date of Incorporation : |
30.11.1984 |
|
|
|
|
Com. Reg. No.: |
45247 |
|
|
|
|
Legal Form : |
Societe Anonyme |
|
|
|
|
Line of Business : |
Manufacture of basic pharmaceutical products |
|
|
|
|
No. of Employees : |
350 |
RATING & COMMENTS
|
MIRA’s Rating : |
Ba |
|
RATING |
STATUS |
PROPOSED CREDIT LINE |
|
|
41-55 |
Ba |
Overall operation is considered normal. Capable to meet normal
commitments. |
Satisfactory |
|
Status : |
Good |
|
Payment Behaviour : |
No Complaints |
|
Litigation : |
Clear |
NOTES :
Any query related to this report can be made
on e-mail: infodept@mirainform.com
while quoting report number, name and date.
ECGC Country Risk Classification List – March 31st, 2012
|
Country Name |
Previous Rating (31.12.2011) |
Current Rating (31.03.2012) |
|
Morocco |
A2 |
A2 |
|
Risk Category |
ECGC
Classification |
|
Insignificant |
A1 |
|
Low |
A2 |
|
Moderate |
B1 |
|
High |
B2 |
|
Very High |
C1 |
|
Restricted |
C2 |
|
Off-credit |
D |
Company name
Laboratoires Pharmaceutiques Pharma 5 SA
Rating Briefing
Payment
Record: NO
COMPLAINTS
This rating is based on available data. In the event of additional information a
possibility for a different rating applies.
Registration Briefing
Registration
Number: 45247
Registration
Date: 30/11/1984
Legal
Form: SOCIETE
ANONYME
Latest
Financials: December
31, 2010
Financial Briefing
Nominal
Capital: 30,000,000
Moroccan Dirham
Issued
Capital: N/A
Turnover: 445,331,360
Moroccan Dirham
Net
Profit: 66,349,311
Moroccan Dirham
Net
Worth: 264,047,425
Moroccan Dirham
Company Details
Company
Name: Laboratoires
Pharmaceutiques Pharma 5 SA
Company
acronym: Pharma
5
Headquarter
Address: 21
Rue Des Asphodeles,
Maarif,
Casablanca
20100,
Morocco
Telephone: +212522
235733
+212522
235862
+212522
236215
+212522
257740
Fax: +212522
232404
E‑Mail: pharma5@pharma5.ma
Web
Site: www.pharma5.ma
Company History
Former
Names Date
of Change
HOMEO
MAROC SA
Company
was originally started on 30/11/1984
Registration & Legal Details
Current
Legal Form: SOCIETE
ANONYME
Registration
Address: 21 Rue
Des Asphodeles,
Casablanca
20100
Registration
Number: 45247
Registration
Date: 30/11/1984
Year/Date
Company Established: 30/11/1984
Registration
Town: Casablanca
Tax
Registration Number: 1001935
Capital
Currency: Moroccan
Dirham
Authorized
Capital: 30,000,000
Paid
Up Capital: 30,000,000
Authorized
Capital Breakdown
Number
of Shares: 60,000 Type of
Shares: None Selected
Issued
Shares: 60,000 Value
per share: MDH 500.00 Value of this
type: 30,000,000.00
Shareholders / Owners
Shareholders:
Name/Other
Information Shares
Held % of Voting/Non‑Voting
capital
Ms
Meriem Lahlou Filali, 29,100 48.48%
(VOTING)
Route
Mekka Km 8300,
Casablanca,
Morocco
Ms
Yasmine Lahlou Filali, 29,100 48.48%
(VOTING)
Route
Mekka Km 8300,
Casablanca,
Morocco
Mr
Mokhtra Tazi, 850 1.41%
(VOTING)
Pharmacie
El Bahia,
Casablanca,
Morocco
Mr
Abdellah Lahlou Filali, 800 1.40%
(VOTING)
Pharmacie
Jamila,
Casablanca,
Morocco
Pharma
Shop, 140 0.22%
(VOTING)
112,
Boulevard Moulay Driss 1er,
Casablanca,
Morocco
Mr
Abdelhak Farihi, 10 0.01%
(VOTING)
Inara1
Rue 29 N°2,
Casablanca,
Morocco
Principals
Name: Mr
Abdellah Lahlou Filali
Position
within the company: Chairman
Date
of Birth: 30/06/1943
Country
of Birth: Morocco
Nationality: Moroccan
Can
fluently speak: Arabic
& French
Name: Mr
Jilali Ouajdi
Position
within the company: General
Director
Date
of Birth: 03/06/1962
Country
of Birth: Morocco
Nationality: Moroccan
Can
fluently speak: Arabic,
French & English
Name: Mr
Abdelhaq Farihi
Position
within the company: Financial
Director
Country
of Birth: Morocco
Nationality: Moroccan
Can
fluently speak: Arabic
& French
Name: Ms
Najat Abou
Position
within the company: Import‑export
Director
Country
of Birth: Morocco
Nationality: Moroccan
Can
fluently speak: Arabic
& French
Company Activities
NACE
Codes: 2110 Manufacture of basic pharmaceutical products
The
company is involved in manufacturing and importation of pharmaceutics products.
Local
Reporters consider the investigated company to be MEDIUM in their field of
concern.
Operations
Employees Company
Employs: 350
HQ Premises Operates
from: Owned Office , Factory,
Warehouse
Premises
Size: 3000 square meters
Location: Central Business Area, Side Road
Imports
Import
% and type of product: 98% Raw
Materials
Imports
From: Japan,
China, Germany
Importing
Terms: Bank
transfer
Brands: SANTEL
Exports
Export
% and type of product: 10%
Exports
To: Senegal
Exporting
Terms: bank
transfer
Trading & Selling
Territory: 90%
Nationally, 10% International
Type of Customer: wholesalers of pharmaceutical
products, hospitals
and
pharmacies
Number
of accounts: 300
Related Companies
Subsidiaries
Affiliates
Information on
Related Companies is not available/applicable
Bankers
Attijariwafa
Bank,
Branch:
Head Office
2
Boulevard Moulay Youssef,
Casablanca,
Morocco
Banque
Populaire,
Branch:
Head Office
101
Boulevard Mohamed Zerktouni,
Casablanca,
Morocco
Financial Information
Source: Companies
Registry
Currency: Moroccan
Dirham
Months Sales Figures Sales Gross
Profit/Loss Net Profit/Loss
12 31/12/2010 445,331,360 94,422,646 66,349,311
12 31/12/2009 432,643,692 98,664,323 68,511,379
Balance Sheet & Profit &
Loss
BALANCE
SHEET
As
at: 31‑Dec‑2010 As at: 31‑Dec‑2009
Fixed
Assets
Land & Buildings 61,502,866 72,346,793
Plant & Machinery 12,488,495 28,740,543
Furniture & Equipment 2,206,119 2,026,515
Motor Vehicles 3,743 7,446
Misc. Fixed Assets 6,081,175 1,473,685
Total Fixed Assets 82,282,398 104,594,982
Financial
Assets
Shares in Related Companies 5,073,682 3,159,682
Loans to
related companies
Investments 1,292,844 3,204,814
Deposits
Misc. Financial Assets 205,126 200,086
Total Financial Assets 6,571,652 6,564,582
Intangibles
Goodwill
Organisational
Expenses
Patents
Misc.
Intangible Assets
Total Intangible Assets 0 0
Current
Assets
Stock 67,121,060 33,586,056
Stock &
Work in Progress
Trade Debtors & receivables 135,755,417 109,590,958
Provision
for bad debs
Other receivables 121,323 121,323
Due from
related companies
Owed by
shareholders
Prepaid expenses 821,390 951,685
Cash 13,502,266 10,094,759
Tax recoverable 28,862,712 24,157,094
Marketable Securities 69,730,402 79,751,637
Misc. Current Assets 4,024,549 4,289,324
Total Current Assets 319,939,119 262,542,836
Total Assets 408,793,169 373,702,400
Owner's
Equity & Liabilities
Issued and paid up capital 30,000,000 30,000,000
Share
premium account
Retained earnings 140,798,114 112,286,735
Net profit/Loss for the year 66,349,311 68,511,379
Revaluation
reserves
Legal Reserves 3,000,000 3,000,000
Other reserves 23,900,000 18,900,000
Net Worth 264,047,425 232,698,114
Deffered
Taxation
Provisions/allowances 5,000,000
Mortgages/Loans 140,847 3,326,339
Hire
purchase
Due to group
of companies
Minority
interest
Misc.
deferred liabilities
Total Long Term Liabilities 140,847 8,326,339
Current
Liabilities
Creditors 131,792,812 109,914,538
Other
creditors
Accruals
Bank
overdrafts/Loans 5,171,091
Misc. Loans
Directors
accounts
Owing to shareholders 93,462 93,462
Owing to
related companies
Proposed
dividend
Long Term‑due
1 year
Hire
Purchase‑under 1 year
Taxation 9,290,907 14,822,416
Advance
receipts
Misc. Current Liabilities 3,427,716 2,676,440
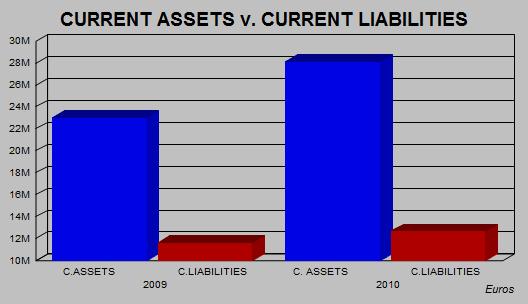
Total Current Liabilities 144,604,897 132,677,947
Owner's Equity & Liabilities 408,793,169 373,702,400
PROFIT & LOSS
Figures
are: Figures
are:
Fiscal
Year Fiscal
Year
01/01/2010
to 31/12/2010 01/01/2009 to
31/12/2009
Total Income/Turnover 445,331,360 432,643,692
Cost of sales 20,381,283 15,454,295
Gross Profit/(Loss) 424,950,077 417,189,397
Admin/selling expenses 194,115,200 157,125,668
Services 91,824,447 89,985,446
Salaries 57,874,155 45,264,220
Auditors Fee 3,005,826 2,417,914
Stock Depreciation ‑30,244,019 9,422,531
Depreciation 27,428,107 25,953,411
Misc. Operating Expenses 1,560,000 1,560,000
Misc. Operating Income 16,390,953 15,478,393
Net Operating Profit/(Loss) 95,777,314 100,938,600
Interest Receivable/Finance Income 436,511 1,671,250
Group
related income
Misc. Financial Income 24,372,233 1,225,129
Total Financial Income 24,808,744 2,896,379
Interest Payable/Finance costs 275,186 460,599
Misc. financial expenses 25,888,226 4,710,057
Total Financial Expenses 26,163,412 5,170,656
Profit/(Loss) before taxes 94,422,646 98,664,323
Income Tax 28,073,335 30,152,944
Other Tax
Profit/(Loss) after taxes 66,349,311 68,511,379
Extraordinary
items
Exceptional
items
Misc. Items
Net Profit/(Loss) 66,349,311 68,511,379
Previous
years retained earnings
Current years net income 66,349,311 68,511,379
Misc.
additions in current year
Current
years net loss
Dividends in
current year
Withdrawals
in current year
Misc.
deductions in current year
Retained earnings at end of 66,349,311 68,511,379
financial
period
Average
employees
Directors
fee
Earnings per
share
Earnings per
share‑previous year
Auditors Comments
Date
accounts obtained: 03/07/2012
Accounts
obtained from: Companies
registry
Auditors Opinion: The audited
financial statement gives a true and fair view of the state of affairs of the
subject
Assuming
support of: shareholders
FINANCIAL RATIOS / COMPARATIVE
DATA
Actual
Company Industrial Averages Actual Company Industrial Averages
Results
(2010) (2010) Results (2009) (2009)
Liquidity
Ratios
Current Ratio 2.21 1.64 1.98 1.58
Acid Test Ratio 1.75 1.08 1.73 1.07
Accounts 0.30 0.33 0.25 0.35
Payable/Sales
Ratio
Current Liabilities/Net 0.55 0.73 0.57 3.06
Worth
Total Liabilities/Net 0.55 ‑0.43 0.61 3.46
Worth
Fixed Assets/Net 31.16 ‑77.00 44.95 112.64
Worth (%)
Profitability
Ratios
Gross Profit Ratio (%) 95.42 94.87 96.43 93.82
Return on Capital 35.74 3.38 40.94 13.25
Employed
(ROCE)(%)
Net Profit/Sales (%) 21.20 ‑4.53 22.80 ‑7.47
Return on Assets (%) 23.10 4.00 26.40 3.05
Efficiency
Ratios
Sales/Working Capital 2.54 21.76 3.33 2.92
Assets/Sales(%) 91.80 170.47 86.38 170.58
Shareholders 35.76 17.70 42.40 11.17
Return(%)
Average Inventory 901.76 57,265.23 495,235.85
Period
Average Collection 100.54 121.23 116.51
Period
Leverage
Ratios
Capital Employed 1.69 3.61 1.86 4.84
Capital Structure (%) 0.05 25.19 3.45 26.72
Number of 370 370
Companies
within the
industry
(NACE C)
Statistics
based on Manufacturing Manufacturing
NACE(C)
The statistical Industrial Average results are
calculated against
companies within the database for the specific
country.
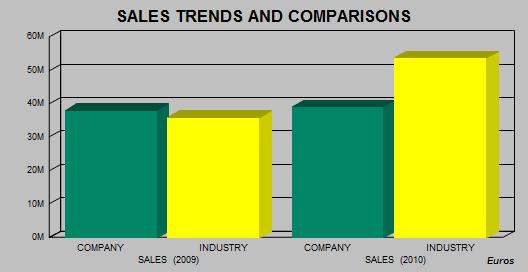
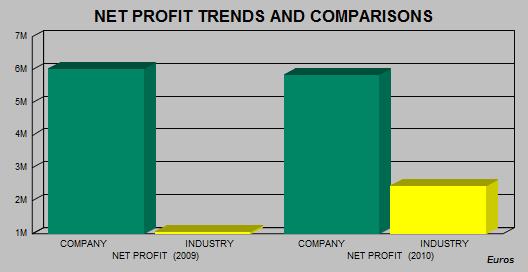
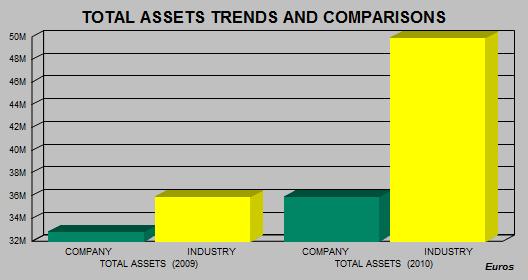
INDUSTRY SECTOR COMPARATIVE DATA
Elements Taken Result for specific RANKING Total Companies Used
company
DATE OF REGISTRATION 30/11/1984 375 769
TOTAL EMPLOYEES 350 137 758
SALES (2010) 39,153,533 42 226
SALES (2009) 38,038,033 52 354
NET PROFIT (2010) 5,833,431 18 200
NET PROFIT (2009) 6,023,520 18 360
TOTAL ASSETS (2010) 35,941,095 44 196
TOTAL ASSETS (2009) 32,855,915 68 361
Currency:
EUROS
Rankings
The results given below are calculated against
companies with the Database for the specific country.
Scale: 1 is the highest result found in our
database.
Example: Ranking 5: Total Companies used to
generate the Ranking : 20
This means that this company is the 5th largest
company out of 20 found in our database in the specific industry
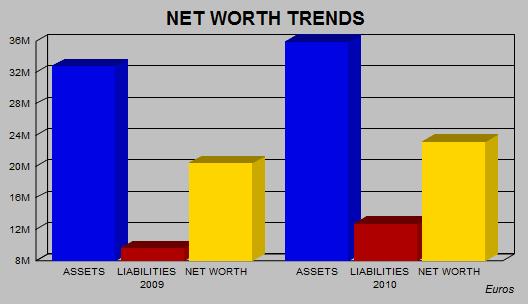
Charts of Financial Trends and Industry Comparisons
PLEASE
NOTE THAT CHARTS ARE SHOWN IN EUROS FOR TREND AND COMPARISON PURPOSES
The
statistical Industrial Average results are calculated against companies within
the database for the specific country.
Payments
Subject's payments reported to be: NO COMPLAINTS
Representation
Other Comments
Other
Comments: Patent
N°: 358006094
Interview & Reporter Comments
Name/Title: Mr Abdelhaq Farihi Manager
Comment: Subject was too busy to provide/confirm any information.
We have sent a fax/e‑mail/questionnaire however no reply has been received as of yet.
Conclusions
Local Reputation :The company being investigated is considered by local reporters to be a Fair / Normal
Trade Risk.
General Conclusion: Local informants consider granting of credit to be a fair trade risk.
Owner/Shareholders Comments: Some of the owners / shareholders have an active participation in the running of the business.
Financial Results Trend: Financial Information indicates that the business activities of the company are
declining in strength.
Age of Business: The company is a long established family run business.
Country Intelligence Information
Country: Morocco
Date: 19/06/2012 00:00:00
Source: Economist Intelligence Unit
Economy: Fiscal situation remains difficult in the first quarter
June 2nd 2012
Government expenditure rose by 13.9% year on year in the first quarter of 2012, to Dh61.2bn
(US$7bn). Current spending (excluding subsidies) grew at a rapid rate of 8.7% to Dh46.3bn, but
subsidy costs were the main driver of the sharp rise in spending, increasing by 33.8% year on year to
Dh14.9bn. This follows a surge in subsidy spending in 2011 and therefore comes off an already
elevated base. The energy import bill grew by 27.2% year on year in the first quarter of 2012, to
Dh21bn. Subsidies are a major burden on the public finances and are also highly erratic. In
1999‑2004 the cost of subsidies did not exceed an average of Dh5bn a year. Between 2005 and 2011
it ranged between Dh11bn in 2005 and a peak of Dh49bn in 2011, more than 50% higher than its
previous record level in 2008 (Dh31bn). The new government has suggested that it will introduce a
long‑awaited reform of the subsidy fund by the end of 2012 (February 2012, Economic policy), but the
authorities are likely to tread carefully in such a politically sensitive area, and any proposal is unlikely
to change the situation radically.
The wage bill remains another major strain on the public finances. It has grown from an annual
average of Dh48bn in 1999‑2004 to Dh89bn in 2011. The wages and salaries bill expanded by 17%
year on year to Dh24.9bn in the first quarter of 2012, accounting for 41% of ordinary expenditure. In
these particularly turbulent times, the government will find it hard to cut back the public‑sector
workforce.
Risk: Sovereign risk
Stable. Morocco's fiscal account will remain deeply in deficit, owing to high recurrent expenditure on
subsidies and wages, but the shortfalls should be financed mostly by borrowing from domestic
banks, thus keeping the external debt stock in check, although some new borrowing is likely.
Currency risk
Stable. The current exchange‑rate system—a managed float—will remain in place. The Moroccan
dirham will strengthen against the troubled euro, causing exporters problems in their main market,
but the central bank has some capacity to intervene, although foreign‑exchange reserves are falling.
Banking sector risk
Stable. The banking sector has benefited from prudential regulation, relatively low levels of
non‑performing loans (although these are rising) and limited direct foreign exposure, but government
borrowing from the banks is a concern.
Political risk
The government will increase public spending in the short term to quell political and social protests
over unemployment and poverty. Tensions over the disputed territory of Western Sahara may also
lead to violent demonstrations.
Economic structure risk
Dependence on agriculture leaves economic performance vulnerable to weather conditions. The fiscal
and external deficits fluctuate in line with movements in international commodity prices but are
manageable.
FOREIGN EXCHANGE RATES
|
Currency |
Unit
|
Indian Rupees |
|
US Dollar |
1 |
Rs.54.55 |
|
|
1 |
Rs.85.48 |
|
Euro |
1 |
Rs.68.70 |
INFORMATION DETAILS
|
Report Prepared
by : |
PRL |
RATING EXPLANATIONS
|
RATING |
STATUS |
PROPOSED CREDIT LINE |
|
|
>86 |
Aaa |
Possesses an extremely sound financial base with the strongest
capability for timely payment of interest and principal sums |
Unlimited |
|
71-85 |
Aa |
Possesses adequate working capital. No caution needed for credit transaction.
It has above average (strong) capability for payment of interest and
principal sums |
Large |
|
56-70 |
A |
Financial & operational base are regarded healthy. General unfavourable
factors will not cause fatal effect. Satisfactory capability for payment of
interest and principal sums |
Fairly Large |
|
41-55 |
Ba |
Overall operation is considered normal. Capable to meet normal
commitments. |
Satisfactory |
|
26-40 |
B |
Capability to overcome financial difficulties seems comparatively
below average. |
Small |
|
11-25 |
Ca |
Adverse factors are apparent. Repayment of interest and principal sums
in default or expected to be in default upon maturity |
Limited with full
security |
|
<10 |
C |
Absolute credit risk exists. Caution needed to be exercised |
Credit not
recommended |
|
-- |
NB |
New Business |
-- |
This score serves as a reference to assess SC’s credit risk and
to set the amount of credit to be extended. It is calculated from a composite
of weighted scores obtained from each of the major sections of this report. The
assessed factors and their relative weights (as indicated through %) are as
follows:
Financial
condition (40%) Ownership
background (20%) Payment
record (10%)
Credit history
(10%) Market trend
(10%) Operational
size (10%)
This report is issued at your request without any
risk and responsibility on the part of MIRA INFORM PRIVATE LIMITED (MIPL)
or its officials.