MIRA
INFORM REPORT
|
Report Date : |
09.06.2012 |
IDENTIFICATION DETAILS
|
Name : |
|
|
|
|
|
Formerly Known As : |
HERCULES CHEMICAL SOLUTIONS PTE. LTD |
|
|
|
|
Registered Office : |
|
|
|
|
|
Country : |
|
|
|
|
|
Financials (as on) : |
30.09.2009 |
|
|
|
|
Date of Incorporation : |
02.04.2002 |
|
|
|
|
Com. Reg. No.: |
200202678c |
|
|
|
|
Legal Form : |
Limited Private Company |
|
|
|
|
Line of Business : |
Wholesale of chemicals and chemical products Other investment holding companies |
|
|
|
|
No. of Employees : |
Not Available |
RATING & COMMENTS
|
MIRA’s Rating : |
C |
|
RATING |
STATUS |
PROPOSED CREDIT LINE |
|
|
<10 |
C |
Absolute credit risk exists. Caution needed to be exercised |
Credit not
recommended |
|
Status : |
Poor |
|
|
|
|
Payment Behaviour : |
Slow |
|
|
|
|
Litigation : |
Exists |
NOTES:
Any query related to this report can be made
on e-mail: infodept@mirainform.com
while quoting report number, name and date.
ECGC Country Risk Classification List – March 31st, 2012
|
Country Name |
Previous Rating (31.12.2011) |
Current Rating (31.03.2012) |
|
|
A1 |
A1 |
|
Risk Category |
ECGC
Classification |
|
Insignificant |
A1 |
|
Low |
A2 |
|
Moderate |
B1 |
|
High |
B2 |
|
Very High |
C1 |
|
Restricted |
C2 |
|
Off-credit |
D |
|
Company Name: |
Registered Number: |
|
|
200202678C |
|
Date Incorporated: |
Registered Office: |
Telephone Number: |
|||
|
02/04/2002 |
|
6775 5366 |
|||
|
Age of Company: |
Website: |
Industry Type: |
|||
|
10 |
NA |
COMMERCE-WHOLESALE |
|||
|
|
|
Risk Dashboard |
|||
|
|
Days Beyond Terms |
Trend: |
No. of Litigation Counts: |
||
|
|
Company DTC: |
1 |
|||
|
|
22 |
||||
|
|
Worse off than
last month;last month the entity took 55 days to pay |
No. of Charges(s): |
|||
|
|
Industry DTC |
|
|||
|
25 |
|||||

|
Directors |
|
Corporate Structure |
||
|
Number of
Current Directors |
12 |
Holding Company: |
|
|
|
Number that are
shareholders |
1 |
No. of
Subsidiaries & Associated Companies: |
NA |
|
EXECUTIVE
SUMMARY
|
: |
|
|
|
Registration No |
: |
200202678C |
|
Date of Registration |
: |
02/04/2002 |
|
Former Name |
: |
1.HERCULES CHEMICALS
INTERNATIONAL ( 2.HERCULES CHEMICAL
SOLUTIONS PTE. LTD. Eff. Date : 30/04/2002 Eff. Date : 30/04/2002 |
|
Date of Change of Name |
: |
20/06/2011 |
|
Type of Company |
: |
LIMITED PRIVATE COMPANY |
|
Operating Address |
: |
200
Pandan Loop #07-01/02 Pantech 21, |
|
Registered Address |
: |
|
|
Date of Change of Address |
: |
01/10/2010 |
|
Contact No. |
: |
6775 5366 |
|
Fax No. |
: |
6774 2574 |
|
Website |
: |
NA |
|
Registered Activities |
: |
1. WHOLESALE OF CHEMICALS
AND CHEMICAL PRODUCTS NEC 2. OTHER INVESTMENT
HOLDING COMPANIES |
|
Issued Ordinary Capital* |
: |
$15,050,000.00 |
|
Issued Preference Capital |
: |
NA |
|
Paid-Up Ordinary Capital |
: |
$15,050,000.00 SINGAPORE,
DOLLARS |
|
Paid-Up Preference
Capital |
: |
NA |
|
* Number of Shares
includes number of Issued Treasury Shares |
||
|
Issued Treasury Capital |
: |
NA |
|
Paid-Up Treasury Capital |
: |
NA |
|
No. of Local Subsidiaries |
: |
NA |
|
No. of Local Associates |
: |
NA |
|
Auditor |
: |
PRICEWATERHOUSECOOPERS
LLP |
|
Bankers / Financiers |
: |
NA |
|
Turnover |
: |
SGD - SIN 6,149,328.00
(FY2009) |
|
Net Worth |
: |
SGD - SIN 6,329,227.00
(FY2009) |
|
No. of Bank Charges |
: |
NA |
|
No. of Litigation Suits |
: |
1 |
|
S1000
/ SME 1000 / FG50 Ranking |
: |
|
|
Compounded Annual Growth
Rate (CAGR) |
: |
NA |
SHAREHOLDER DETAILS
|
: |
ASHLAND HOLDINGS B.V. |
|
|
SHAREHOLDER ID |
: |
T09UF1554C |
|
NATIONALITY |
: |
NETHERLANDS |
|
ADDRESS |
: |
PESETASTRAAT 5 2991 XT BARENDRECHT, THE NETHERLANDS |
|
NO. OF ORD SHARES |
: |
15,050,000 |
|
% OF SHAREHOLDING |
: |
100% |
|
CURRENCY |
: |
SINGAPORE, DOLLARS |
OFFICER DETAILS
|
: |
LYNN
PANNELL FREEMAN |
|
|
ADDRESS |
: |
2321
SUMMERWOODS DRIVE HEBRON, KY 41048, U.S.A |
|
POSITION |
: |
DIRECTOR |
|
DATE OF APPT |
: |
21/02/2012 |
|
NATIONALITY |
: |
AMERICAN |
|
I/C PASSPORT |
: |
465587879 |
|
|
||
|
NAME |
: |
BRADLEY
EARL MILLWOOD |
|
ADDRESS |
: |
2 KIM
SENG WALK #33-12 SINGAPORE 239404 |
|
POSITION |
: |
DIRECTOR |
|
DATE OF APPT |
: |
29/04/2009 |
|
NATIONALITY |
: |
AMERICAN |
|
I/C PASSPORT |
: |
G6267206X |
|
|
||
|
NAME |
: |
ANTHONY
ANNE CATHARINE |
|
ADDRESS |
: |
8 LORONG
29 GEYLANG #07-06 SINGAPORE 388064 |
|
POSITION |
: |
SECRETARY |
|
DATE OF APPT |
: |
01/01/2005 |
|
NATIONALITY |
: |
SINGAPORE
CITIZEN |
|
I/C PASSPORT |
: |
S1347717E |
KEY
PERSONNEL PROFILE
|
BRADLEY EARL MILLWOOD |
|
|
NRIC Number: |
G6267206X |
|
Available Address: |
2 KIM SENG WALK #33-12 SINGAPORE 239404 |
Current Business Interest
|
No. |
Name |
Position |
Appt Date |
#of Share |
% |
|
ASHLAND SINGAPORE PTE. LTD. |
DIRECTOR |
29/04/2009 |
- |
- |
Previous Business
|
No. |
Name |
Status |
Position |
Appt Date |
Last Known Inactive Date |
|
|
|
|
|
||
Bankruptcy Record
|
Case
No. |
Year |
Date
of Filing |
Petitioner
Name |
Amount |
|
|
|
|
|
Litigation Search – Writ of Summons
|
Court |
Case No. |
Transfer |
Year |
Date
of Filing |
Amount |
Cause
Category |
|
|
|
|
|
|
|
SUBSIDIARIES AND ASSOCIATE COMPANIES
|
Company |
Shareholdings (%) |
|
|
|
|
|
|
BANKERS/ FINANCIERS
Subject enjoys a normal banking routine with its bankers. To
date, there are no bank charges registered against Subject by its bankers.
LITIGATION
there have been 1 litigation suits filed against Subject.
The details are as follows:
|
Court |
: |
Magistrate
Court |
|
|
|
Case
No. |
: |
19957 |
|
|
Transfer |
: |
- |
|
|
Date
of Filing |
: |
03/09/2007 |
|
|
Amount
|
: |
2,350.00 |
|
|
Cause |
: |
Tort
- Negligence (Professional Accidents
Without Death/ Injury) |
|
|
Case
Status |
: |
PENDING |
|
|
Plaintiff |
: |
WOO
KAW CHUAN |
|
|
Last
Update Date |
: |
22/12/2010 |
COMPLIANCE RECORDS
|
Date of Last AGM |
: |
|
|
Date of Last AR |
: |
06/05/2011 |
|
Date of A/C Laid At Last AGM |
: |
30/09/2009 |
COMPLIANCE RATING FOR ANNUAL FILING
Note:
Provided by ACRA (Accounting and Corporate Regulatory Authority), the
Compliance Rating for Annual Filing measures a company’s compliance with the provisions under S175, S197 or S201 of the Companies Act,
Cap. 50.
Applicable to all “Live” locally incorporated companies
except for the Limited Partnerships, Limited Liability Partnerships, Business
Entities, Foreign Companies and Public Accounting Firms, the rating provide
information on whether a company is up-to-date with the holding of its Annual
General Meeting (AGM) with up-to-date financial statements and filing of its
Annual Return (AR).
For more information: www.acra.gov.sg/compliance
FINANCIAL HIGHLIGHTS
|
Financial Figures |
||||||
|
|
SEP 2009 |
% Change |
DEC 2008 |
DEC 2007 |
DEC 2006 |
DEC 2005 |
|
Currency |
SGD - SIN |
|
SGD - SIN |
SGD - SIN |
SGD - SIN |
SGD - SIN |
|
Profit and Loss Key Figures |
|
|
|
|
|
|
|
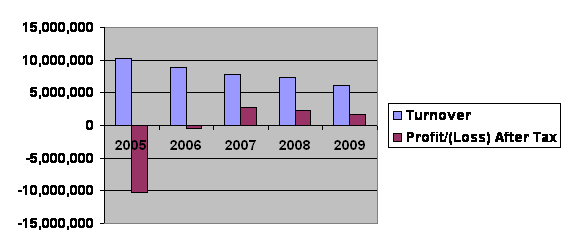
6,149,328 |
-16.46 |
7,361,226 |
7,739,743 |
8,890,607 |
10,322,076 |
|
|
Profit/(Loss) Before Tax |
1,926,380 |
-40.83 |
3,255,694 |
2,126,173 |
(415,862) |
(10,218,786) |
|
Profit After Tax attributable to
Shareholders |
1,656,805 |
-29.38 |
2,346,248 |
2,705,454 |
(415,862) |
(10,218,786) |
|
|
|
|
|
|
|
|
|
Balance Sheet Key Figures |
|
|
|
|
|
|
|
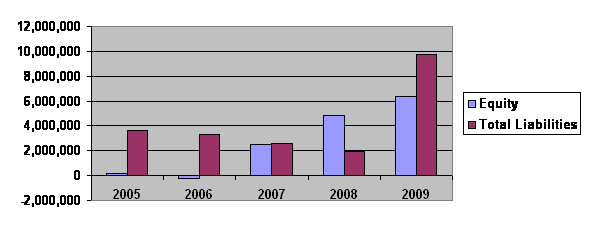
Total Assets |
16,063,392 |
135.78 |
6,813,012 |
5,056,801 |
3,072,532 |
3,834,691 |
|
Current Assets |
14,642,079 |
118.76 |
6,693,169 |
4,349,758 |
2,876,041 |
3,520,057 |
|
Non Current Assets |
1,421,313 |
1,085.98 |
119,843 |
707,043 |
196,491 |
314,634 |
|
|
|
|
|
|
|
|
|
Total Liabilities |
9,734,165 |
392.41 |
1,976,855 |
2,566,892 |
3,288,077 |
3,634,374 |
|
Current Liabilities |
9,674,308 |
389.38 |
1,976,855 |
2,566,892 |
3,288,077 |
3,634,374 |
|
Non Current Liabilities |
59,857 |
NA |
0 |
0 |
0 |
0 |
|
|
|
|
|
|
|
|
|
Shareholders' Funds |
6,329,227 |
30.87 |
4,836,157 |
2,489,909 |
(215,545) |
200,317 |
|
Share Capital |
15,050,000 |
0.00 |
15,050,000 |
15,050,000 |
15,050,000 |
15,050,000 |
|
Total Reserves |
(8,720,773) |
NA |
(10,213,843) |
(12,560,091) |
(15,265,545) |
(14,849,683) |
FINANCIAL RATIOS
|
|
|||||
|
|
SEP
2009 |
DEC
2008 |
DEC
2007 |
DEC
2006 |
DEC
2005 |
|
Growth % |
|
|
|
|
|
|
-16.46 |
-4.89 |
-12.94 |
-13.87 |
NA |
|
|
|
|
|
|
|
|
|
Profitability |
|
|
|
|
|
|
Profit Margin (%) |
26.94 |
31.87 |
34.96 |
-4.68 |
-99.00 |
|
Return on Equity (%) |
26.18 |
48.51 |
108.66 |
192.94 |
-5,101.31 |
|
Return on Assets (%) |
10.31 |
34.44 |
53.50 |
-13.53 |
-266.48 |
|
|
|
|
|
|
|
|
Leverage |
|
|
|
|
|
|
Total Debt/Equity (Times) |
1.54 |
0.41 |
1.03 |
-15.25 |
18.14 |
|
Current Debt/Equity (Times) |
1.53 |
0.41 |
1.03 |
0.00 |
18.14 |
|
Long Term Debt To Equity (Times) |
0.01 |
0.00 |
0.00 |
0.00 |
0.00 |
|
Total Asset To Total Equity (Times) |
2.54 |
1.41 |
2.03 |
-14.25 |
19.14 |
|
|
|
|
|
|
|
|
Asset Management |
|
|
|
|
|
|
Total Assets Turnover (Times) |
0.38 |
1.08 |
1.53 |
2.89 |
2.69 |
|
Fixed Assets Turnover (Times) |
4.33 |
61.42 |
10.95 |
45.25 |
32.81 |
|
|
|
|
|
|
|
|
Liquidity |
|
|
|
|
|
|
Current Ratio (Times) |
1.51 |
3.39 |
1.69 |
0.87 |
0.97 |
FINANCIAL COMMENTARY
Profitability
The company yielded a rate of
net profit on sales of 26.94 per cent in FY09 (FY08: 31.87 per cent). The
company is now able to book in SGD - SIN 0.27 of profit for every SGD - SIN of
sales in FY09, as compared with SGD - SIN 0.32 a year ago.
Liquidity
Current ratio stood at 1.51 times in FY09
(FY08: 3.39 times). This means that the company has SGD - SIN 1.51 of current
assets for every SGD - SIN of current liability incurred.
A minimum figure of 1.0 would be considered the lowest limit that this
figure should reach. Any business that has a current ratio near 1.0 may be
heading for liquidity problems, and would need to be closely monitored. A
figure greater than 2.0 would be more desirable, to act as a buffer against any
short-term liquidity problems, and give creditors/bank managers a degree of
comfort when granting credit/finance.
Leverage
Total debt-to-equity ratio notched 1.54 times in FY09, as
compared with 0.41 times in FY08. This means that the company requires
additional external financing of SGD - SIN 1.54 for every SGD - SIN injected
into its operations.
Generally, a total debt-to-equity ratio of less than 0.5
times is preferred. The ratio measures the proportion of the company's reliance
on external debt for financing, relative to the shareholder's fund. A lower
ratio would imply a greater financial safety and operating freedom for the
company.
Efficiency Ratio
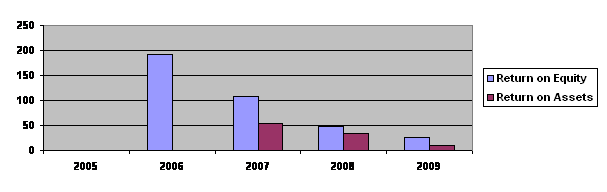
Return on equity was 26.18 per cent for Subject in the current financial
period, as compared to 48.51 per cent a year ago. The return on equity measures
the return earned on the owner's investment.
Generally, the higher this return, the better off the owner.
Return on assets stood at 10.31 per cent (FY08: 34.44 per cent). The
return on asset measures the overall effectiveness of management in generating
profit with its available assets.
Total assets turnover ratio logged at 0.38 times in FY09 (FY08: 1.08
times). This ratio measures the company's ability to make productive use of its
total assets to generate sales which reflects the efficiency of the management
in utilising its resources.
FOREIGN EXCHANGE RATES
|
Currency |
Unit
|
Indian Rupees |
|
US Dollar |
1 |
Rs.55.36 |
|
UK Pound |
1 |
Rs.85.64 |
|
Euro |
1 |
Rs.69.21 |
INFORMATION DETAILS
|
Report Prepared
by : |
MNL |
RATING EXPLANATIONS
|
RATING |
STATUS |
PROPOSED CREDIT LINE |
|
|
>86 |
Aaa |
Possesses an extremely sound financial base with the strongest
capability for timely payment of interest and principal sums |
Unlimited |
|
71-85 |
Aa |
Possesses adequate working capital. No caution needed for credit transaction.
It has above average (strong) capability for payment of interest and
principal sums |
Large |
|
56-70 |
A |
Financial & operational base are regarded healthy. General unfavourable
factors will not cause fatal effect. Satisfactory capability for payment of
interest and principal sums |
Fairly Large |
|
41-55 |
Ba |
Overall operation is considered normal. Capable to meet normal
commitments. |
Satisfactory |
|
26-40 |
B |
Capability to overcome financial difficulties seems comparatively
below average. |
Small |
|
11-25 |
Ca |
Adverse factors are apparent. Repayment of interest and principal sums
in default or expected to be in default upon maturity |
Limited with full
security |
|
<10 |
C |
Absolute credit risk exists. Caution needed to be exercised |
Credit not
recommended |
|
---- |
NB |
New Business |
---- |
This score serves as a reference to assess SC’s credit risk and
to set the amount of credit to be extended. It is calculated from a composite
of weighted scores obtained from each of the major sections of this report. The
assessed factors and their relative weights (as indicated through %) are as
follows:
Financial
condition (40%) Ownership
background (20%) Payment
record (10%)
Credit history
(10%) Market trend
(10%) Operational
size (10%)
This report is issued at your request without any
risk and responsibility on the part of MIRA INFORM PRIVATE LIMITED (MIPL)
or its officials.