MIRA
INFORM REPORT
|
Report Date : |
14.05.2012 |
IDENTIFICATION DETAILS
|
Name : |
C.P VIETNAM CORPORATION |
|
|
|
|
Formerly Known As : |
C.P VIETNAM LIVESTOCK CORPORATION |
|
|
|
|
Registered Office : |
No. 2, Road 2A, Bien Hoa 2 Industrial Zone, |
|
|
|
|
Country : |
|
|
|
|
|
Financials (as on) : |
31.12.2010 |
|
|
|
|
Year of Establishment : |
1993 |
|
|
|
|
Legal Form : |
Foreign Invested Company |
|
|
|
|
Line of Business : |
Manufacturing food and poultry cattle |
|
|
|
|
No. of Employees : |
7,500 |
RATING & COMMENTS
|
MIRA’s Rating : |
Ba |
|
RATING |
STATUS |
PROPOSED CREDIT LINE |
|
|
41-55 |
Ba |
Overall operation is considered normal. Capable to meet normal
commitments. |
Satisfactory |
|
Status : |
Good |
|
|
|
|
Payment Behaviour : |
No Complaints |
|
|
|
|
Litigation : |
Clear |
NOTES:
Any query related to this report can be made
on e-mail: infodept@mirainform.com
while quoting report number, name and date.
ECGC Country Risk Classification List – March 31st, 2012
|
Country Name |
Previous Rating (31.12.2011) |
Current Rating (31.03.2012) |
|
|
B1 |
B1 |
|
Risk Category |
ECGC
Classification |
|
Insignificant |
A1 |
|
Low |
A2 |
|
Moderate |
B1 |
|
High |
B2 |
|
Very High |
C1 |
|
Restricted |
C2 |
|
Off-credit |
D |
SUBJECT IDENTIFICATION &
LEGAL FORM
Current legal status
|
||
|
English Name |
|
C.P VIETNAM CORPORATION |
|
Vietnamese Name |
|
CONG TY CO PHAN CHAN NUOI C.P VIET |
|
Trade name |
|
C.P VIETNAM CORPORATION |
|
Short name |
|
CPV |
|
Type of Business |
|
Foreign invested company |
|
Year Established |
|
1993 |
|
Investment Certificate No |
|
472033000352 |
|
Date Of Issuance |
|
11 Jul 2008 |
|
Place of Issuance |
|
Dong Nai Industrial Zones Authority |
|
Registered Investment Capital |
|
USD 260,816,500 |
|
Chartered capital |
|
USD 113,838,907 |
|
Status |
|
Unlisted |
|
Tax code |
|
3600224423 |
|
Total Employees |
|
7,500 |
|
Size |
|
Large |
Historical
Identification & Legal form
|
List |
Changed Items |
Date of changes |
|
1 |
Subject has got former Registered English
Name: C.P VIETNAM LIVESTOCK CORPORATION Changed to: C.P VIETNAM CORPORATION |
05
Sep 2011 |
|
2 |
Subject has got former Registered English
Name: C.P VIETNAM LIVESTOCK CO., LTD Changed to: C.P VIETNAM LIVESTOCK
CORPORATION |
11
Jul 2008 |
|
3 |
Subject has got former Registered
Vietnamese Name: CONG TY TNHH CHAN NUOI C.P VIET Changed to: CONG TY CO PHAN CHAN NUOI C.P
VIET |
11
Jul 2008 |
|
4 |
Subject has got former Investment
Certificate No: 545A/GPDC 20 Issued on September 01st 2006 by Ministry of
Planning and Investment Changed to: 472033000352 by Dong Nai
Industrial Zones Authority |
11
Jul 2008 |
company ADDRESSES
|
Head Office |
||
|
Address |
|
No. 2, Road 2A, Bien Hoa 2 Industrial
Zone, Bien Hoa City, Dong Nai Province, Vietnam |
|
Telephone |
|
(84-61) 383 6251/ 383 6258 |
|
Fax |
|
(84-61) 383 6086 |
|
Email |
|
|
|
Website |
|
|
|
Occupied Area |
|
59,072 m2 |
|
Land-use Right |
|
Leased |
|
Note: In Bien Hoa 2 Industrial Zone, the
Subject has two other factories are Animal Raising Equipment Factory (KPI)
and Meat Processing Factory |
||
|
|
||
|
Factory Address |
||
|
Address |
|
Bau Xeo industrial zone Song Trau commune,
Trang Bom District, |
|
Telephone |
|
(84-61) 392 1502 |
|
Fax |
|
(84-61) 392 1514 |
|
|
||
|
Factory Address |
||
|
Address |
|
Bau Xeo industrial zone Song Trau commune,
Trang Bom District, |
|
Telephone |
|
(84-61) 392 1901/ 2/ 3 |
|
Fax |
|
(84-61) 392 1513 |
|
|
||
|
Factory Address |
||
|
Address |
|
|
|
Telephone |
|
(84-4) 3384 0501/2/3/4/5/6/7/8 |
|
Fax |
|
(84-4) 3384 0416 |
|
Email |
|
|
|
|
||
|
Factory Address |
||
|
Address |
|
No. 49/1 Phu Quy II Hamlet - La Nga
Comune, Dinh Quan District, Dong Nai Province, Vietnam |
|
Telephone |
|
(84-61) 385 3584 |
|
Fax |
|
(84-61) 385 3588 |
|
Email |
|
|
|
|
||
|
Factory Address |
||
|
Address |
|
No.11 lot 13 Road No.19A - Bien Hoa 2
Industrial Zone, |
|
Telephone |
|
(84-61) 399 1034/ 38 |
|
Fax |
|
(84-61) 399 1020 |
|
Email |
|
|
|
|
||
|
Transaction
office in Ho Chi Minh |
||
|
Address |
|
No. 602/43E |
|
Telephone |
|
(84-8) 3899 6321 |
|
Fax |
|
(84-8) 3840 1250 |
|
Note: Besides, the subject also has many
factories and branches in some other provinces and cities in |
||
DIRECTORS
|
1.
NAME |
|
Mr.
SOOKSUNT JIUMJAISWANGLERG |
|
Position |
|
General Director |
|
Date of Birth |
|
15 Oct 1952 |
|
ID Number/Passport |
|
I605504 |
|
ID Issue Date |
|
13 Oct 2005 |
|
|
|
Thailand |
|
Resident |
|
No. 171 Sukapiban 2
Bangkapi, Bangkok, Thailand |
|
Current resident |
|
|
|
Nationality |
|
Thai |
|
|
||
|
2.
NAME |
|
Mr.
CHAMNAN WANGAKKARANGKU |
|
Position |
|
Vice General Director |
|
Current resident |
|
|
|
Nationality |
|
Thai |
|
|
||
|
3.
NAME |
|
Mr.
JIRAWIT RACHATANAN |
|
Position |
|
Vice General Director |
|
Current resident |
|
|
|
Nationality |
|
Thai |
|
|
||
|
4.
NAME |
|
Mr.
ADISAK TORSAKUL |
|
Position |
|
Vice General Director |
|
Nationality |
|
Thai |
|
|
||
|
5.
NAME |
|
Mr.
SUWES WANGRUNGARUN |
|
Position |
|
Vice General Director |
|
Current resident |
|
|
|
Nationality |
|
Thai |
|
|
||
|
6.
NAME |
|
Mr.
DANAI WESANARAT |
|
Position |
|
Vice General Director |
|
ID Number/Passport |
|
U650476 |
|
Nationality |
|
Thai |
|
Tel/Mobil phone |
|
(84-4) 33840501 |
|
|
||
|
7.
NAME |
|
Mr.
KRAISAK PRASERIJING |
|
Position |
|
Vice General Director |
|
Nationality |
|
Thai |
|
|
||
|
8.
NAME |
|
Mr.
WIROJ WIPATHANASIRI |
|
Position |
|
Vice General Director |
|
Nationality |
|
Thai |
BUSINESS NATURE AND ACTIVITIES
|
The subject operates in many lines of business: ·
Animal
feed (pig, chicken, duck, bird and shrimp …) ·
Livestock
farming (Breeding hogs, broilers, chickens, shrimp …) ·
Processing
food from meat, frozen food from shrimp ·
Supply
many kinds of seed corn ·
Providing
for breeding farm about equipment, technical service... |
IMPORT & EXPORT ACTIVITIES
|
IMPORT: |
||
|
·
Types of products |
|
Materials, breeding animals |
|
·
Market |
|
Thailand, China, Taiwan, Singapore, India, Argentina,
Holland, United States, etc |
|
·
Mode of payment |
|
L/C, T/T |
|
|
||
|
EXPORT: |
||
|
·
Types of products |
|
Feed |
|
·
Market |
|
Japan, Thailand, New Zealand, Australia, Taiwan |
|
·
Ratio |
|
Small |
|
·
Mode of payment |
|
L/C, T/T |
BANKERS
|
1.
ANZ BANK |
||
|
Address |
|
No. 11 Me Linh Square, Ben Nghe Ward,, 1 District, Ho Chi Minh City,
Vietnam |
|
Telephone |
|
(84-8) 38299319 |
|
Fax |
|
(84-8) 38299316 |
|
|
||
|
2.
VIET NAM JOINT STOCK COMMERCIAL BANK FOR INDUSTRY AND TRADE BIEN HOA
INDUSTRIAL PARK |
||
|
Address |
|
Amata Industrial part Long Binh Ward, Bien Hoa City, Dong Nai
Province, Vietnam |
|
Telephone |
|
(84-61) 3831202 |
|
SWIFT Code |
|
ICBVVNVX682 |
|
|
||
|
3.
DONG A COMMERCIAL JOINT STOCK BANK BIEN HOA BRANCH |
||
|
Address |
|
No.16-17 Dong Khoi Street, Tan Hiep Ward, Bien Hoa City, Dong Nai
Province, Vietnam |
|
Telephone |
|
(84-61) 3857 991 |
|
Fax |
|
(84-61) 3857 992 |
|
|
||
|
4.
JOINT STOCK BANK FOR FOREIGN TRADE OF VIETNAM DONG NAI BRANCH |
||
|
Address |
|
No. 116 -118 April 30th Str - Quyet Thang Ward, Bien Hoa City, Dong
Nai Province, Vietnam |
|
Telephone |
|
(84-61) 382 2575 |
|
Fax |
|
(84-61) 394 6513 |
|
|
||
|
5.
CITI BANK - BRANCH IN HO CHI MINH CITY |
||
|
Address |
|
No. 115 Nguyen Hue Str, Ben Nghe Ward, 1 District, Ho Chi Minh City,
Vietnam |
|
Telephone |
|
(84-8) 38242118 |
|
Fax |
|
(84-8) 38242267 |
|
|
||
|
6.
VIET NAM BANK FOR AGRICULTURE AND RURAL DEVELOPMENT |
||
|
Address |
|
1A Bien Hoa industrial Zone, Binh Da ward, Bien Hoa City, Dong Nai
Province, Vietnam |
|
Telephone |
|
(84-61) 3839360 |
|
Fax |
|
(84-61) 3824934 |
|
|
||
|
7.
VIET NAM JOINT STOCK COMMERCIAL BANK FOR INDUSTRY AND TRADE |
||
|
Address |
|
No. 2 Pho Duc Chinh Street, 1 District, Ho Chi Minh City, Vietnam |
|
Telephone |
|
84-8) 39143183 |
|
Fax |
|
(84-8) 39143193 |
|
|
||
|
8.
BANGKOK BANK PUBLIC COMPANY LIMITED HOCHIMINH CITY BRANCH |
||
|
Address |
|
No. 35, Nguyen Hue Street, Ben Nghe Ward, District 1, Ho Chi Minh
City, Vietnam |
|
Telephone |
|
(84-8) 38214396 |
|
Fax |
|
(84-8) 38213772 |
SHAREHOLDERS
|
1.
NAME |
|
CHAROEN
POKPHAND GROUP COMPANY LIMITED |
|
Address |
|
C.P Tower Foorl 14,16, No. 313 Silom Road,
Bangrak, Bangkok 10500, Thailand |
|
Tel |
|
(66-2) 625 8000 |
|
Fax |
|
(66-2) 638 2741 |
|
Number of shares |
|
57,885,233 |
|
Percentage |
|
47.29% |
|
|
||
|
2.
NAME |
|
BANGKOK
FOOD PRODUCTS COMPANY LIMITED |
|
Address |
|
No. 97 Soi Yenchit, Yenchit kwaeng
Toongwatdon, Khet Sathorn Bangkok, Thailand |
|
Number of shares |
|
35,712,399 |
|
Percentage |
|
29.18% |
|
|
||
|
3.
NAME |
|
CHAROEN
POKPHAND ENTERPRISE COMPANY LIMITED |
|
Address |
|
No. 97 Yenchit Rd., Kwaeng, Toongwatdon,
Khet Sathorn, Bangkok , Thailand |
|
Number of shares |
|
1,173,129 |
|
Percentage |
|
1.45% |
|
|
||
|
4.
NAME |
|
BSI
HOLDING COMPANY LIMITED |
|
Address |
|
Omar Hodge Buiding Wickhms Cay I, P.O.Box
362 Road Town Tortola, British Virgin, Ireland |
|
Number of shares |
|
3,800,404 |
|
Percentage |
|
3.1% |
|
|
||
|
5.
NAME |
|
C.F.
ENTERPRISE LTD |
|
Address |
|
Offshore Incorporations Limited P.O. Box 957
Offshore Incorporations Center, Road Town, Tortola, British Virgin, Islands,
Ireland |
|
Number of shares |
|
1,581,437 |
|
Percentage |
|
1.29% |
|
|
||
|
6.
NAME |
|
WORTH
ACCESS TRANGDING LIMITED |
|
Address |
|
Offshore Incorporations Center, Road Town,
Tortola, British Virgin, Islands, Ireland |
|
Number of shares |
|
9,933,551 |
|
Percentage |
|
8.12% |
|
|
||
|
7.
NAME |
|
MODERN
STATE INVESTMENTS LIMITED |
|
Address |
|
P.O. Box 957 Offshore Incorporations Center,
Road Town, Tortola, British Virgin, Islands, Ireland |
|
Number of shares |
|
9,933,551 |
|
Percentage |
|
8.12% |
|
|
||
|
8.
NAME |
|
ADVANCE
PILARMA COMPANY LIMITED |
|
Address |
|
No. 90, Soi Chan 28, Chan Rd. Kwaeng
Toongwatdon, Khet Sathorn, Bangkok, Thailand |
|
Number of shares |
|
1,773,129 |
|
Percentage |
|
1.45% |
FINANCIAL DATA
|
BALANCE
SHEET |
|||
Unit: One VND
|
|||
|
Balance sheet
date |
31/12/2010 |
31/12/2009 |
31/12/2008 |
|
Number of weeks |
52 |
52 |
52 |
|
ASSETS |
|||
|
A – CURRENT
ASSETS |
7,227,079,268,274
|
5,605,697,710,738
|
3,250,508,000,000
|
|
I. Cash and cash
equivalents |
227,965,639,178
|
773,060,116,283
|
103,998,000,000
|
|
1. Cash |
218,365,639,178 |
177,060,116,283 |
103,998,000,000 |
|
2. Cash equivalents |
9,600,000,000 |
596,000,000,000 |
0 |
|
II. Short-term
investments |
4,700,000,000
|
9,300,000,000
|
9,300,000,000
|
|
1. Short-term investments |
4,700,000,000 |
9,300,000,000 |
9,300,000,000 |
|
2. Provisions for devaluation of short-term investments |
0 |
0 |
0 |
|
III. Accounts
receivable |
1,026,593,927,742
|
535,539,580,046
|
917,422,000,000
|
|
1. Receivable from customers |
689,420,012,345 |
481,984,693,451 |
632,269,000,000 |
|
2. Prepayments to suppliers |
204,883,143,367 |
57,465,731,210 |
298,472,000,000 |
|
3. Inter-company receivable |
0 |
0 |
0 |
|
4. Receivable according to the progress of construction |
0 |
0 |
0 |
|
5. Other receivable |
160,350,051,373 |
17,859,406,228 |
863,000,000 |
|
6. Provisions for bad debts |
-28,059,279,343 |
-21,770,250,843 |
-14,182,000,000 |
|
IV. Inventories |
5,516,097,861,817
|
3,917,640,700,356
|
2,117,256,000,000
|
|
1. Inventories |
5,528,753,443,237 |
3,941,708,396,201 |
2,117,256,000,000 |
|
2. Provisions for devaluation of inventories |
-12,655,581,420 |
-24,067,695,845 |
0 |
|
V. Other Current
Assets |
451,721,839,537
|
370,157,314,053
|
102,532,000,000
|
|
1. Short-term prepaid expenses |
72,632,047,184 |
51,177,774,444 |
32,502,000,000 |
|
2. VAT to be deducted |
113,450,055,888 |
138,486,623,146 |
32,987,000,000 |
|
3. Taxes and other accounts receivable from the State |
71,529,645 |
234,209,700 |
26,820,000,000 |
|
4. Other current assets |
265,568,206,820 |
180,258,706,763 |
10,223,000,000 |
|
B. LONG-TERM
ASSETS |
3,734,201,014,892
|
3,098,467,813,242
|
2,011,598,000,000
|
|
I. Long term
accounts receivable |
0 |
0 |
0 |
|
1. Long term account receivable from customers |
0 |
0 |
0 |
|
2. Working capital in affiliates |
0 |
0 |
0 |
|
3. Long-term inter-company receivable |
0 |
0 |
0 |
|
4. Other long-term receivable |
0 |
0 |
0 |
|
5. Provisions for bad debts from customers |
0 |
0 |
0 |
|
II. Fixed assets
|
3,002,109,464,449
|
2,655,266,114,112
|
1,875,012,000,000
|
|
1. Tangible assets |
2,568,079,216,567 |
1,640,603,120,913 |
1,072,045,000,000 |
|
- Historical costs |
4,034,904,590,328 |
2,953,102,686,955 |
1,944,260,000,000 |
|
- Accumulated depreciation |
-1,466,825,373,761 |
-1,312,499,566,042 |
-872,215,000,000 |
|
2. Financial leasehold assets |
0 |
0 |
0 |
|
- Historical costs |
0 |
0 |
0 |
|
- Accumulated depreciation |
0 |
0 |
0 |
|
3. Intangible assets |
38,737,793,247 |
23,756,978,434 |
24,059,000,000 |
|
- Initial costs |
61,372,711,677 |
36,099,739,828 |
26,992,000,000 |
|
- Accumulated amortization |
-22,634,918,430 |
-12,342,761,394 |
-2,933,000,000 |
|
4. Construction-in-progress |
395,292,454,635 |
990,906,014,765 |
778,908,000,000 |
|
III. Investment
property |
0 |
0 |
0 |
|
Historical costs |
0 |
0 |
0 |
|
Accumulated depreciation |
0 |
0 |
0 |
|
IV. Long-term
investments |
0 |
0 |
0 |
|
1. Investments in affiliates |
0 |
0 |
0 |
|
2. Investments in business concerns and joint ventures |
0 |
0 |
0 |
|
3. Other long-term investments |
0 |
0 |
0 |
|
4. Provisions for devaluation of long-term investments |
0 |
0 |
0 |
|
V. Other
long-term assets |
732,091,550,443
|
443,201,699,130
|
136,586,000,000
|
|
1. Long-term prepaid expenses |
160,126,361,481 |
85,082,972,286 |
129,916,000,000 |
|
2. Deferred income tax assets |
64,659,584,826 |
56,025,111,869 |
6,520,000,000 |
|
3. Other long-term assets |
507,305,604,136 |
302,093,614,975 |
150,000,000 |
|
VI. Goodwill |
0 |
0 |
0 |
|
1. Goodwill |
0 |
0 |
0 |
|
TOTAL ASSETS |
10,961,280,283,166
|
8,704,165,523,980
|
5,262,106,000,000
|
|
LIABILITIES |
|||
|
A- LIABILITIES |
7,482,380,735,073
|
5,200,902,599,679
|
3,314,305,000,000
|
|
I. Current
liabilities |
7,216,195,813,408
|
4,841,652,671,205
|
3,045,440,000,000
|
|
1. Short-term debts and loans |
5,571,149,982,882 |
3,134,962,234,416 |
2,505,959,000,000 |
|
2. Payable to suppliers |
1,027,732,986,205 |
1,173,225,361,587 |
306,820,000,000 |
|
3. Advances from customers |
106,729,096,114 |
46,750,180,197 |
158,943,000,000 |
|
4. Taxes and other obligations to the State Budget |
127,935,799,169 |
141,717,060,203 |
5,221,000,000 |
|
5. Payable to employees |
7,841,101,126 |
14,833,441,156 |
14,623,000,000 |
|
6. Accrued expenses |
373,065,198,169 |
327,009,748,450 |
51,304,000,000 |
|
7. Inter-company payable |
0 |
0 |
0 |
|
8. Payable according to the progress of construction contracts |
0 |
0 |
0 |
|
9. Other payable |
1,741,649,743 |
3,154,645,196 |
2,570,000,000 |
|
10. Provisions for short-term accounts payable |
0 |
0 |
0 |
|
II. Long-Term
Liabilities |
266,184,921,665
|
359,249,928,474
|
268,865,000,000
|
|
1. Long-term accounts payable to suppliers |
0 |
0 |
0 |
|
2. Long-term inter-company payable |
0 |
0 |
0 |
|
3. Other long-term payable |
10,814,896,267 |
5,846,622,272 |
3,084,000,000 |
|
4. Long-term debts and loans |
211,967,974,148 |
314,917,652,352 |
262,205,000,000 |
|
5. Deferred income tax payable |
0 |
0 |
0 |
|
6. Provisions for unemployment allowances |
43,402,051,250 |
38,485,653,850 |
3,576,000,000 |
|
7. Provisions for long-term accounts payable |
0 |
0 |
0 |
|
B- OWNER’S
EQUITY |
3,478,899,548,093
|
3,503,262,924,301
|
1,947,801,000,000
|
|
I. OWNER’S
EQUITY |
3,478,899,548,093
|
3,503,262,924,301
|
1,947,801,000,000
|
|
1. Capital |
1,741,792,500,000 |
1,223,928,330,000 |
892,810,000,000 |
|
2. Share premiums |
799,723,659,171 |
799,723,659,171 |
0 |
|
3. Other sources of capital |
0 |
0 |
0 |
|
4. Treasury stocks |
0 |
0 |
0 |
|
5. Differences on asset revaluation |
0 |
0 |
0 |
|
6. Foreign exchange differences |
0 |
0 |
0 |
|
7. Business promotion fund |
0 |
0 |
0 |
|
8. Financial reserved fund |
0 |
0 |
0 |
|
9. Other funds |
0 |
0 |
0 |
|
10. Retained earnings |
937,383,388,922 |
1,479,610,935,130 |
1,054,991,000,000 |
|
11. Construction investment fund |
0 |
0 |
0 |
|
II. Other
sources and funds |
0 |
0 |
0 |
|
1. Bonus and welfare funds |
0 |
0 |
0 |
|
2. Sources of expenditure |
0 |
0 |
0 |
|
3. Fund to form fixed assets |
0 |
0 |
0 |
|
MINORITY’S
INTEREST |
0 |
0 |
0 |
|
TOTAL
LIABILITIES AND OWNER’S EQUITY |
10,961,280,283,166
|
8,704,165,523,980
|
5,262,106,000,000
|
|
PROFIT
& LOSS STATEMENT |
|||
|
|
|||
|
Description |
FY2010 |
FY2009 |
FY2008 |
|
1. Total Sales |
20,791,349,465,641
|
13,627,562,252,363
|
10,793,570,000,000
|
|
2. Deduction item |
711,461,346,937 |
444,670,366,732 |
148,901,000,000 |
|
3. Net sale |
20,079,888,118,704
|
13,182,891,885,631
|
10,644,669,000,000
|
|
4. Costs of goods sold |
17,179,814,086,787 |
11,290,795,201,439 |
9,154,066,000,000 |
|
5. Gross profit |
2,900,074,031,917
|
1,892,096,684,192
|
1,490,603,000,000
|
|
6. Financial income |
128,621,348,021 |
58,539,288,437 |
55,753,000,000 |
|
7. Financial expenses |
699,747,549,044 |
396,356,782,927 |
490,549,000,000 |
|
- In which: Loan interest expenses |
485,328,882,604 |
231,542,723,237 |
317,332,000,000 |
|
8. Selling expenses |
256,229,149,006 |
247,434,899,051 |
207,046,000,000 |
|
9. Administrative overheads |
991,799,131,873 |
687,299,327,873 |
480,175,000,000 |
|
10. Net operating profit |
1,080,919,550,015
|
619,544,962,778
|
368,586,000,000
|
|
11. Other income |
24,482,659,681 |
15,631,885,018 |
16,873,000,000 |
|
12. Other expenses |
12,720,576,601 |
942,598,501 |
15,794,000,000 |
|
13. Other profit /(loss) |
11,762,083,080
|
14,689,286,517
|
1,079,000,000
|
|
14. Total accounting profit before tax |
1,092,681,633,095
|
634,234,249,295
|
369,665,000,000
|
|
15. Current corporate income tax |
203,760,844,742 |
122,569,132,757 |
56,926,000,000 |
|
16. Deferred corporate income tax |
8,634,472,937 |
18,242,176,509 |
1,866,000,000 |
|
17. Interest
from subsidiaries/related companies |
0 |
0 |
0 |
|
18. Profit after
tax |
897,555,261,290 |
529,907,293,047 |
314,605,000,000 |
|
FINANCIAL RATIOS
AND AVERAGE INDUSTRY RATIOS |
||||
|
|
||||
|
Description |
FY2010 |
FY2009 |
FY2008 |
Average
Industry |
|
Current
liquidity ratio |
1.00
|
1.16
|
1.07
|
1.32 |
|
Quick liquidity ratio |
0.24 |
0.35 |
0.37 |
0.69 |
|
Inventory circle |
3.11 |
2.88 |
4.83 |
4.18 |
|
Average receive period |
18.66 |
14.83 |
31.46 |
69.24 |
|
Utilizing asset performance |
1.83 |
1.51 |
2.02 |
1.47 |
|
Liability by total assets |
68.26 |
59.75 |
62.98 |
64.25 |
|
Liability by owner's equity |
215.08 |
148.46 |
170.16 |
263.88 |
|
Ebit / Total assets (ROA) |
14.40 |
9.95 |
13.06 |
9.37 |
|
Ebit / Owner's equity (ROE) |
45.36 |
24.71 |
35.27 |
32.97 |
|
Ebit / Total sale (NPM) |
7.59 |
6.35 |
6.36 |
6.94 |
|
Gross profit / Total sale (GPM) |
13.95 |
13.88 |
13.81 |
13.08 |
|
Note: The Average Industry was calculated by VietnamCredit based on our own statistical data |
||||
PAYMENT HISTORY & PERFORMANCE EXPERIENCES
|
Trade Morality |
|
Good |
|
Liquidity |
|
Low/Medium |
|
Payment status |
|
Normal |
|
Financial Situation |
|
Strong |
|
Development trend |
|
Stable |
|
Litigation data |
|
No Record |
|
Bankruptcy |
|
No Record |
|
Payment Methods |
|
L/C, T/T |
|
Sale Methods |
|
Retailer and Wholesaler |
|
Public opinion |
|
Good |
CREDIT
INQUIRY: USD 125,000 Against DA in terms
Acceptable!
INTERPRETATION ON THE SCORES
|
The
subject is 100% foreign owned company. It was established in 1993 as a
factory to manufacture foodstuff for cattle of Charoen Pokphand Group
(C.P.Group) in Thailand. The subject has changed type of business into a
joint stock company on July 11th 2008. The
subject operates in feed manufacturing industry, especially for pig, poultry
and shrimp. Moreover, C.P Vietnam also manufactures frozen food from shrimp;
these products are supplied for supermarket such as Co-op mart, KFC and
exported to overseas… with brand “FRESH MART”. The
premises, facilities, and management capacity of the subject are good. Its
management boards are from Thailand. The subject has received many supports
from its investors. The market share of the subject is large. It is
considered as the leading company in producing animal feed and livestock
farming in Vietnam. It has many branches and factories to manufacture shrimp
feed stuff, shrimp farms, animal farms, and poultry farms located in many
provinces in Vietnam. Its products hold a large market share. Managed
by CHAROEN POKPHAND GROUP, one of the biggest companies operates in the field
in Asia, the subject has gained much support including: technical assistants,
management experience, assistants of skilled experts certified by
classification societies. So C.P VIETNAM has achieved successful operations,
the business result of the subject is remarkable.
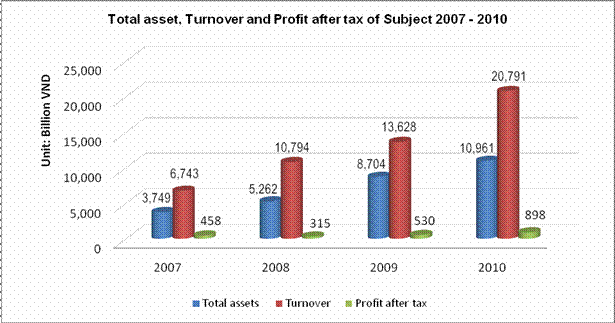
Financially,
looking at the map showed that total assets and turnover of subject had
increased continuously year by year. In 2010, subject's annual retained
earning accounts which are large, shows that it obtains the profit well. Debt
rate increased due to the increase in the liabilities. Its debt rate
increased from 59.75% to 68.26%. However, its self-financing and solvency
were still strong. Current liquidity ratio decreased because the growth of
current liabilities was higher the growth of current assets. Besides, as it
remained the large amount inventory, its quick liquidity ratio was low. Its
receivables turnover was high because the subject applied the tighter credit
policies for its customer. Its sales policy worked efficiently. Generally,
the subject is considered as a big scale company in the field, it has
capacity to meet normal financial commitments. |
APPENDIX
|
INDUSTRY DATA |
||||||
|
|
||||||
|
Industry code |
Growth speed by
price compared with 1994 (%) |
Total
enterprises 2009 |
Total employees
2010 (Thous.pers.) |
Annual average
capital of enterprises 2009 (billion dongs) |
||
|
2011 |
2010 |
|||||
|
Agriculture,
Forestry and Fishing |
4.00 |
2.78 |
8,749 |
23,896.3 |
81,559 |
|
|
Industry and
Construction |
5.53 |
7.70 |
85,115 |
10,630 |
2,751,975 |
|
|
Trade and
Services |
6.69 |
7.52 |
154,978 |
14,522 |
4,939,069 |
|
|
|
||||||
|
ECONOMIC
INDICATORS |
||||||
|
|
||||||
|
|
2011 |
2010 |
2009 |
|||
|
Population (Million person) |
87.84 |
86.93 |
86.02 |
|||
|
Gross Domestic Products (USD
billion) |
119 |
102.2 |
91 |
|||
|
GDP Growth (%) |
5.89 |
6.78 |
5.32 |
|||
|
GDP Per Capita
(USD/person/year) |
1,300 |
1,160 |
1,080 |
|||
|
Inflation (% Change in
Composite CPI) |
18.58 |
11.75 |
6.88 |
|||
|
State Budget Deficit compared
with GDP (%) |
4.9 |
5.8 |
6.9 |
|||
|
|
||||||
|
SERVICE TRADE
PERFORMANCE |
||||||
|
|
||||||
|
Billion USD |
2011 |
2010 |
2009 |
|||
|
Exports |
96.3 |
72.2 |
57.1 |
|||
|
Imports |
105.8 |
84.8 |
69.9 |
|||
|
Trade Balance |
-9.5 |
-12.6 |
-12.8 |
|||
Source: General
Statistics Office
FOREIGN EXCHANGE RATES
|
Currency |
Unit
|
Indian Rupees |
|
US Dollar |
1 |
Rs.53.64 |
|
UK Pound |
1 |
Rs.86.42 |
|
Euro |
1 |
Rs.69.29 |
INFORMATION DETAILS
|
Report Prepared
by : |
MNL |
RATING EXPLANATIONS
|
RATING |
STATUS |
PROPOSED CREDIT LINE |
|
|
>86 |
Aaa |
Possesses an extremely sound financial base with the strongest
capability for timely payment of interest and principal sums |
Unlimited |
|
71-85 |
Aa |
Possesses adequate working capital. No caution needed for credit
transaction. It has above average (strong) capability for payment of interest
and principal sums |
Large |
|
56-70 |
A |
Financial & operational base are regarded healthy. General
unfavourable factors will not cause fatal effect. Satisfactory capability for
payment of interest and principal sums |
Fairly Large |
|
41-55 |
Ba |
Overall operation is considered normal. Capable to meet normal
commitments. |
Satisfactory |
|
26-40 |
B |
Capability to overcome financial difficulties seems comparatively
below average. |
Small |
|
11-25 |
Ca |
Adverse factors are apparent. Repayment of interest and principal sums
in default or expected to be in default upon maturity |
Limited with
full security |
|
<10 |
C |
Absolute credit risk exists. Caution needed to be exercised |
Credit not
recommended |
|
---- |
NB |
New Business |
---- |
This score serves as a reference to assess SC’s credit risk
and to set the amount of credit to be extended. It is calculated from a
composite of weighted scores obtained from each of the major sections of this
report. The assessed factors and their relative weights (as indicated through
%) are as follows:
Financial
condition (40%) Ownership
background (20%) Payment
record (10%)
Credit history
(10%) Market trend
(10%) Operational
size (10%)
This report is issued at your request without any
risk and responsibility on the part of MIRA INFORM PRIVATE LIMITED (MIPL)
or its officials.