MIRA
INFORM REPORT
|
Report Date : |
16.05.2012 |
IDENTIFICATION DETAILS
|
Name : |
SABIC ASIA PACIFIC PTE LTD |
|
|
|
|
Formerly Known As : |
SABIC SOUTH EAST ASIA PTE LTD |
|
|
|
|
Registered Office : |
10 Collyer Quay #10-01 Ocean Financial Centre Singapore
049315 |
|
|
|
|
Country : |
|
|
|
|
|
Financials (as on) : |
December 2011 |
|
|
|
|
Date of Incorporation : |
30.11.1991 |
|
|
|
|
Com. Reg. No.: |
199106011H |
|
|
|
|
Legal Form : |
Limited Private Company |
|
|
|
|
Line of Business : |
Wholesale of chemicals and chemical products and trading of petrochemical and other related products |
|
|
|
|
No. of Employees : |
Not Available |
RATING & COMMENTS
|
MIRA’s Rating : |
Ba |
|
RATING |
STATUS |
PROPOSED CREDIT LINE |
|
|
41-55 |
Ba |
Overall operation is considered normal. Capable to meet normal commitments. |
Satisfactory |
|
Status : |
Good |
|
|
|
|
Payment Behaviour : |
No complaints |
|
|
|
|
Litigation : |
Clear |
NOTES:
Any query related to this report can be made
on e-mail: infodept@mirainform.com
while quoting report number, name and date.
ECGC Country Risk Classification List – March 31st, 2012
|
Country Name |
Previous Rating (31.12.2011) |
Current Rating (31.03.2012) |
|
Singapore |
A1 |
A1 |
|
Risk Category |
ECGC
Classification |
|
Insignificant |
A1 |
|
Low |
A2 |
|
Moderate |
B1 |
|
High |
B2 |
|
Very High |
C1 |
|
Restricted |
C2 |
|
Off-credit |
D |
|
Company Name: |
Registered Number: |
|
SABIC ASIA PACIFIC PTE LTD |
199106011H |
|
Date Incorporated: |
Registered Office: |
Telephone Number: |
|
30/11/1991 |
10
COLLYER QUAY #10-01 OCEAN FINANCIAL CENTRE |
6557
2555 |
|
Age of Company: |
Website: |
Industry Type: |
|
21 |
COMMERCE-WHOLESALE |
|
Credit
Assessment |
|
Risk
Dashboard |
||
|
Risk
& Rating |
Days
Beyond Terms |
Trend: |
No.
of Litigation Counts: |
|
|
Credit Limit: |
Company DTC: |
NA |
||
|
Small |
NA |
|||
|
|
The
entity is paying current to the creditors |
No.
of Charges(s): |
||
|
|
Industry DTC |
|
||
|
28 |
||||

|
Directors |
|
Corporate Structure |
||
|
Number
of Current Directors |
28 |
Holding
Company: |
SABIC HOLDING |
|
|
Number
that are shareholders |
1 |
No.
of Subsidiaries & Associated Companies: |
NA |
|
EXECUTIVE SUMMARY
SHAREHOLDER DETAILS
|
: |
SABIC HOLDING |
|
|
SHAREHOLDER
ID |
: |
T12UF1361F |
|
NATIONALITY |
: |
|
|
ADDRESS |
: |
EUROPABOULEVARD 1, 6135 LD SITTARD, THE |
|
NO. OF ORD SHARES |
: |
100,000 |
|
% OF
SHAREHOLDING |
: |
100% |
|
CURRENCY |
: |
|
OFFICER DETAILS
|
: |
MADELYN
KWANG YEIT LAM |
|
|
ADDRESS |
: |
|
|
POSITION |
: |
SECRETARY |
|
DATE OF APPT |
: |
26/07/2010 |
|
NATIONALITY |
: |
|
|
I/C PASSPORT |
: |
S1426198B |
|
NAME |
: |
AZLAN
NAGELI BIN ABDULLAH |
|
ADDRESS |
: |
|
|
POSITION |
: |
DIRECTOR |
|
DATE OF APPT |
: |
15/09/2011 |
|
NATIONALITY |
: |
|
|
I/C PASSPORT |
: |
S2664714B |
KEY PERSONNEL PROFILE
|
AZLAN NAGELI BIN
ABDULLAH |
|
|
NRIC Number: |
S2664714B |
|
Available Address: |
|
Current Business Interest
|
No. |
Name |
Position |
Appt
Date |
#of
Share |
% |
|
SABIC ASIA PACIFIC
PTE LTD |
DIRECTOR |
15/09/2011 |
- |
- |
|
|
2 |
SABIC INNOVATIVE
PLASTICS HOLDING |
DIRECTOR |
03/10/2007 |
- |
- |
Previous Business
|
No. |
Name |
Status |
Position |
Appt
Date |
Last Known Inactive Date |
|
GE MONOMER
(HOLDINGS) PTE. LTD. |
LIVE COMPANY |
DIRECTOR |
03/12/2006 |
15/02/2012 |
|
|
2 |
GE PLASTICS
PACIFIC PRIVATE LIMITED |
DISSOLVED -
MEMBERS' VOLUNTARY WINDING UP |
DIRECTOR |
02/01/1997 |
02/03/2011 |
|
3 |
GE/FITCH SINGAPORE
PTE LTD |
DISSOLVED -
MEMBERS' VOLUNTARY WINDING UP |
DIRECTOR |
21/09/1998 |
26/04/2006 |
|
4 |
MOMENTIVE
PERFORMANCE MATERIALS |
LIVE COMPANY |
DIRECTOR |
14/08/2002 |
06/03/2012 |
|
5 |
SABIC INNOVATIVE
PLASTICS |
LIVE COMPANY |
DIRECTOR |
02/01/1997 |
09/04/2012 |
Bankruptcy Record
(Status include petition filed, order made, discharge,
annulment, set aside, rescinded and withdrawn)
|
Case
No. |
Year |
Date
of Filing |
Petitioner
Name |
Amount |
|
|
|
|
|
Note: Please purchase case details to know the latest
status.
KEY PERSONNEL PROFILE
Litigation Search – Writ of Summons
|
Court |
Case No. |
Year |
Date
of Filing |
Amount |
Cause
Category |
|
|
|
|
|
|
SUBSIDIARIES AND ASSOCIATE
COMPANIES
|
Company |
Shareholdings (%) |
|
|
|
|
|
|
BANKERS/ FINANCIERS
Subject enjoys a normal banking routine with its bankers. To
date, there are no bank charges registered against Subject by its bankers.
COMPLIANCE
|
: |
||
|
Date of Last AR |
: |
20/02/2012 |
|
Date of A/C Laid At Last AGM |
: |
31/12/2011 |
COMPLIANCE RATING FOR ANNUAL
FILING
|
ANNUAL GENERAL MEETING,ANNUAL
RETURN AND ACCOUNTS UP-TO-DATE |
Note:
Provided by ACRA (Accounting and Corporate Regulatory
Authority), the Compliance Rating for Annual Filing measures a company’s
compliance with the provisions under S175, S197 or S201 of the Companies Act,
Cap. 50.
Applicable to all “Live” locally incorporated companies
except for the Limited Partnerships, Limited Liability Partnerships, Business
Entities, Foreign Companies and Public Accounting Firms, the rating provide
information on whether a company is up-to-date with the holding of its Annual
General Meeting (AGM) with up-to-date financial statements and filing of its
Annual Return (AR).
For more information: www.acra.gov.sg/compliance
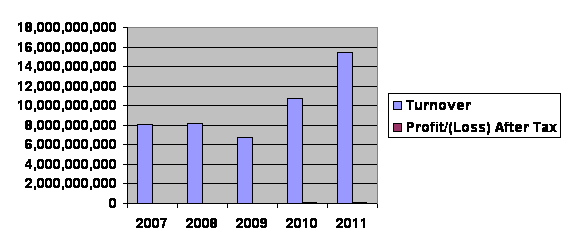
FINANCIAL HIGHLIGHTS
|
Financial Figures |
||||||
|
|
DEC
2011 |
%
Change |
DEC
2010 |
DEC
2009 |
DEC
2008 |
DEC
2007 |
|
Currency |
SGD
- SIN |
|
SGD
- SIN |
SGD
- SIN |
SGD
- SIN |
SGD
- SIN |
|
Profit and Loss Key Figures |
|
|
|
|
|
|
|
15,398,583,876 |
43.48 |
10,732,248,858 |
6,771,036,517 |
8,147,177,063 |
8,060,728,792 |
|
|
Profit/(Loss) Before Tax |
151,304,323 |
42.71 |
106,021,476 |
32,063,856 |
47,239,443 |
46,304,645 |
|
Profit After Tax attributable to Shareholders |
128,172,657 |
42.44 |
89,983,676 |
28,538,068 |
43,882,733 |
42,390,328 |
|
|
|
|
|
|
|
|
|
Balance Sheet Key Figures |
3,204,198,409 |
16.10 |
2,759,869,068 |
1,680,761,557 |
864,177,035 |
2,014,800,533 |
|
Total Assets |
3,172,773,240 |
15.79 |
2,740,056,548 |
1,678,602,140 |
862,212,958 |
2,012,838,115 |
|
Current Assets |
31,425,169 |
58.61 |
19,812,520 |
2,159,417 |
1,964,077 |
1,962,418 |
|
Non Current Assets |
|
|
|
|
|
|
|
|
3,085,680,162 |
18.06 |
2,613,584,362 |
1,623,096,092 |
835,967,414 |
1,955,427,628 |
|
Total Liabilities |
3,084,968,322 |
18.04 |
2,613,431,958 |
1,623,050,982 |
835,940,605 |
1,955,399,078 |
|
Current Liabilities |
711,840 |
367.07 |
152,404 |
45,110 |
26,809 |
28,550 |
|
Non Current Liabilities |
|
|
|
|
|
|
|
|
118,518,246 |
-18.98 |
146,284,707 |
57,665,466 |
28,209,623 |
59,372,906 |
|
Shareholders' Funds |
75,327 |
-7.74 |
81,645 |
87,308 |
84,659 |
90,157 |
|
Share Capital |
118,442,919 |
-18.99 |
146,203,062 |
57,578,158 |
28,124,964 |
59,282,749 |
|
Total Reserves |
|
|
|
|
|
|
FINANCIAL RATIOS
|
|
|||||
|
|
DEC
2011 |
DEC
2010 |
DEC
2009 |
DEC
2008 |
DEC
2007 |
|
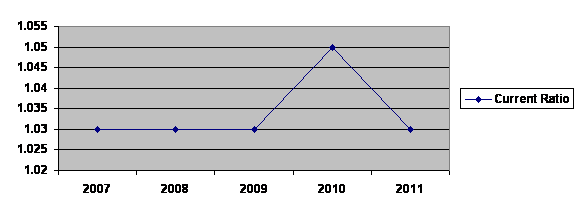
Growth % |
|
|
|
|
|
|
43.48 |
58.50 |
-16.89 |
1.07 |
NA |
|
|
|
|
|
|
|
|
|
Profitability |
|
|
|
|
|
|
Profit Margin (%) |
0.83 |
0.84 |
0.42 |
0.54 |
0.53 |
|
Return on Equity (%) |
108.15 |
61.51 |
49.49 |
155.56 |
71.40 |
|
Return on Assets (%) |
4.00 |
3.26 |
1.70 |
5.08 |
2.10 |
|
|
|
|
|
|
|
|
Leverage |
|
|
|
|
|
|
Total Debt/Equity (Times) |
26.04 |
17.87 |
28.15 |
29.63 |
32.93 |
|
Current Debt/Equity (Times) |
26.03 |
17.87 |
28.15 |
29.63 |
32.93 |
|
Long Term Debt To Equity (Times) |
0.01 |
0.00 |
0.00 |
0.00 |
0.00 |
|
Total Asset To Total Equity (Times) |
27.04 |
18.87 |
29.15 |
30.63 |
33.93 |
|
|
|
|
|
|
|
|
Asset Management |
|
|
|
|
|
|
Total Assets Turnover (Times) |
4.81 |
3.89 |
4.03 |
9.43 |
4.00 |
|
Fixed Assets Turnover (Times) |
490.01 |
541.69 |
3,135.59 |
4,148.09 |
4,107.55 |
|
|
|
|
|
|
|
|
Liquidity |
|
|
|
|
|
|
Current Ratio (Times) |
1.03 |
1.05 |
1.03 |
1.03 |
1.03 |
|
|
|
|
|
|
|
FINANCIAL
HIGHLIGHTS
|
Financial Figures |
|
|||||
|
|
DEC
2011 |
%
Change |
DEC
2010 |
DEC
2009 |
DEC
2008 |
DEC
2007 |
|
Currency |
SGD
- SIN |
|
SGD
- SIN |
SGD
- SIN |
SGD
- SIN |
SGD
- SIN |
|
Profit and Loss Key Figures |
|
|
|
|
|
|
|
13,072,300,309 |
45.27 |
8,998,471,017 |
6,565,074,082 |
7,949,922,758 |
7,770,157,224 |
|
|
Profit/(Loss) Before Tax |
76,632,668 |
55.98 |
49,129,879 |
30,041,221 |
46,498,681 |
50,725,345 |
|
Profit After Tax attributable to Shareholders |
71,512,943 |
57.28 |
45,468,101 |
27,532,571 |
43,300,001 |
47,520,263 |
|
|
|
|
|
|
|
|
|
Balance Sheet Key Figures |
|
|
|
|
|
|
|
Total Assets |
2,955,625,587 |
15.20 |
2,565,733,588 |
1,669,331,487 |
815,777,773 |
1,956,664,282 |
|
Current Assets |
2,895,582,435 |
14.35 |
2,532,113,537 |
1,651,219,447 |
810,201,599 |
1,950,491,531 |
|
Non Current Assets |
60,043,152 |
78.59 |
33,620,051 |
18,112,040 |
5,576,174 |
6,172,751 |
|
|
|
|
|
|
|
|
|
Total Liabilities |
2,949,156,252 |
19.26 |
2,472,942,683 |
1,618,726,328 |
793,405,353 |
1,902,317,630 |
|
Current Liabilities |
2,948,843,645 |
19.25 |
2,472,790,279 |
1,618,698,680 |
793,378,544 |
1,902,289,080 |
|
Non Current Liabilities |
312,607 |
105.12 |
152,404 |
27,648 |
26,809 |
28,550 |
|
|
|
|
|
|
|
|
|
Shareholders' Funds |
6,469,334 |
-93.03 |
92,790,903 |
50,605,160 |
22,372,420 |
54,346,652 |
|
Share Capital |
75,327 |
-7.74 |
81,645 |
87,308 |
84,659 |
90,157 |
|
Total Reserves |
6,394,007 |
-93.10 |
92,709,258 |
50,517,852 |
22,287,761 |
54,256,495 |
|
|
|
|
|
|
|
|
FINANCIAL RATIOS
|
|
|||||
|
|
DEC
2011 |
DEC
2010 |
DEC
2009 |
DEC
2008 |
DEC
2007 |
|
Growth % |
|
|
|
|
|
|
45.27 |
37.07 |
-17.42 |
2.31 |
NA |
|
|
|
|
|
|
|
|
|
Profitability |
|
|
|
|
|
|
Profit Margin (%) |
0.55 |
0.51 |
0.42 |
0.54 |
0.61 |
|
Return on Equity (%) |
1,105.41 |
49.00 |
54.41 |
193.54 |
87.44 |
|
Return on Assets (%) |
2.42 |
1.77 |
1.65 |
5.31 |
2.43 |
|
|
|
|
|
|
|
|
Leverage |
|
|
|
|
|
|
Total Debt/Equity (Times) |
455.87 |
26.65 |
31.99 |
35.46 |
35.00 |
|
Current Debt/Equity (Times) |
455.82 |
26.65 |
31.99 |
35.46 |
35.00 |
|
Long Term Debt To Equity (Times) |
0.05 |
0.00 |
0.00 |
0.00 |
0.00 |
|
Total Asset To Total Equity (Times) |
456.87 |
27.65 |
32.99 |
36.46 |
36.00 |
|
|
|
|
|
|
|
|
Asset Management |
|
|
|
|
|
|
Total Assets Turnover (Times) |
4.42 |
3.51 |
3.93 |
9.75 |
3.97 |
|
Fixed Assets Turnover (Times) |
217.72 |
267.65 |
362.47 |
1,425.69 |
1,258.78 |
|
|
|
|
|
|
|
|
Liquidity |
|
|
|
|
|
|
Current Ratio (Times) |
0.98 |
1.02 |
1.02 |
1.02 |
1.03 |
|
|
|
|
|
|
|
FINANCIAL COMMENTARY
Compound Annual Growth Rate
The company's CAGR is 17.56% (4 years).
CAGR is the year-over-year growth rate of a company over a
specified period. Instead of looking at the average growth rate, CAGR allow users
to look at the annualized growth rate of a company over a given period, a more
indicative measure of growth of a company’s performance over a given period.
Profitability
The group yielded a rate of net
profit on sales of 0.83 per cent in FY11 (FY10: 0.84 per cent). The group is
now able to book in SGD - SIN 0.01 of profit for every SGD - SIN of sales in
FY11, as compared with SGD - SIN 0.01 a year ago.
Liquidity
Current ratio stood at 1.03
times in FY11 (FY10: 1.05 times). This means that the group has SGD - SIN 1.03
of current assets for every SGD - SIN of current liability incurred.
A minimum figure of 1.0 would be considered the lowest limit
that this figure should reach. Any business that has a current ratio near 1.0
may be heading for liquidity problems, and would need to be closely monitored.
A figure greater than 2.0 would be more desirable, to act as a buffer against
any short-term liquidity problems, and give creditors/bank managers a degree of
comfort when granting credit/finance.
Leverage
Total debt-to-equity ratio
notched 26.04 times in FY11, as compared with 17.87 times in FY10. This means
that the group requires additional external financing of SGD - SIN 26.04 for
every SGD - SIN injected into its operations.
Generally, a total debt-to-equity ratio of less than 0.5
times is preferred. The ratio measures the proportion of the company's reliance
on external debt for financing, relative to the shareholder's fund. A lower
ratio would imply a greater financial safety and operating freedom for the
company.
Efficiency Ratio
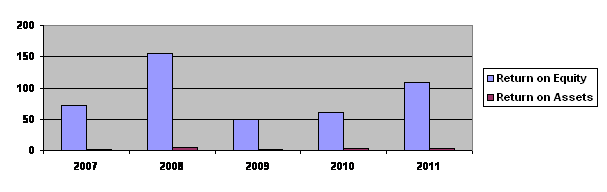
Return on equity was 108.15 per cent for Subject in the
current financial period, as compared to 61.51 per cent a year ago. The return
on equity measures the return earned on the owner's investment. Generally, the higher this return, the better
off the owner.
Return on assets stood at 4.00 per cent (FY10: 3.26 per
cent). The return on asset measures the overall effectiveness of management in
generating profit with its available assets.
Total assets turnover ratio logged at 4.81 times in FY11
(FY10: 3.89 times). This ratio measures the group's ability to make productive
use of its total assets to generate sales which reflects the efficiency of the
management in utilising its resources.
FOREIGN EXCHANGE RATES
|
Currency |
Unit
|
Indian Rupees |
|
US Dollar |
1 |
Rs.53.84 |
|
|
1 |
Rs.86.72 |
|
Euro |
1 |
Rs.69.17 |
INFORMATION DETAILS
|
Report Prepared
by : |
MNL |
RATING EXPLANATIONS
|
RATING |
STATUS |
PROPOSED CREDIT LINE |
|
|
>86 |
Aaa |
Possesses an extremely sound financial base with the strongest
capability for timely payment of interest and principal sums |
Unlimited |
|
71-85 |
Aa |
Possesses adequate working capital. No caution needed for credit
transaction. It has above average (strong) capability for payment of interest
and principal sums |
Large |
|
56-70 |
A |
Financial & operational base are regarded healthy. General
unfavourable factors will not cause fatal effect. Satisfactory capability for
payment of interest and principal sums |
Fairly Large |
|
41-55 |
Ba |
Overall operation is considered normal. Capable to meet normal
commitments. |
Satisfactory |
|
26-40 |
B |
Capability to overcome financial difficulties seems comparatively
below average. |
Small |
|
11-25 |
Ca |
Adverse factors are apparent. Repayment of interest and principal sums
in default or expected to be in default upon maturity |
Limited with
full security |
|
<10 |
C |
Absolute credit risk exists. Caution needed to be exercised |
Credit not recommended |
|
-- |
NB |
New Business |
-- |
This score serves as a reference to assess SC’s credit risk
and to set the amount of credit to be extended. It is calculated from a
composite of weighted scores obtained from each of the major sections of this
report. The assessed factors and their relative weights (as indicated through
%) are as follows:
Financial
condition (40%) Ownership
background (20%) Payment
record (10%)
Credit history
(10%) Market trend
(10%) Operational
size (10%)
This report is issued at your request without any
risk and responsibility on the part of MIRA INFORM PRIVATE LIMITED (MIPL)
or its officials.