MIRA
INFORM REPORT
|
Report Date : |
21.05.2012 |
IDENTIFICATION DETAILS
|
Name : |
STARCHIM |
|
|
|
|
Registered Office : |
20 Parc Industriel CFCIM de Bouskoura, |
|
|
|
|
Country : |
|
|
|
|
|
Financials (as on) : |
31.12.2010 |
|
|
|
|
Date of Incorporation : |
19.12.1996 |
|
|
|
|
Com. Reg. No.: |
86291 |
|
|
|
|
Legal Form : |
Societe A Responsibilite Limitee |
|
|
|
|
Line of Business : |
Wholesale of Chemical Products |
|
|
|
|
No. of Employees : |
12 |
RATING & COMMENTS
|
MIRA’s Rating : |
Ba |
|
RATING |
STATUS |
PROPOSED CREDIT LINE |
|
|
41-55 |
Ba |
Overall operation is considered normal. Capable to meet normal
commitments. |
Satisfactory |
|
Status : |
Satisfactory |
|
Payment Behaviour : |
No Complaints |
|
Litigation : |
Clear |
NOTES :
Any query related to this report can be made
on e-mail: infodept@mirainform.com
while quoting report number, name and date.
ECGC Country Risk Classification List – March 31st, 2012
|
Country Name |
Previous Rating (31.12.2011) |
Current Rating (31.03.2012) |
|
Morocco |
A2 |
A2 |
|
Risk Category |
ECGC
Classification |
|
Insignificant |
A1 |
|
Low |
A2 |
|
Moderate |
B1 |
|
High |
B2 |
|
Very High |
C1 |
|
Restricted |
C2 |
|
Off-credit |
D |
Company name
STARCHIM
Registration Briefing
Registration
Number: 86291
Registration
Date: 19/12/1996
Legal
Form: SOCIETE
A RESPONSIBILITE LIMITEE
Latest
Financials: December
31, 2010
Financial Briefing
Nominal
Capital: 1,000,000
Moroccan Dirham
Issued
Capital: N/A
Turnover: 29,172,393
Moroccan Dirham
Net
Profit: 2,342,478
Moroccan Dirham
Net
Worth: 10,387,111
Moroccan Dirham
Original Investigation Details
Company
Name: STARCHIM
Country: MO
Street
Name: NO.20,
PARC INDUSTRIAL CFCIM DE BOUSKOURA
City
Code: CASABLANCA
Post
Code: BP
202‑20180
Phone
Number: +212
522 592026
Comments: Please
provide the maximum credit limit & latest financials on
the
subject company
ALWAYS
INCLUDE FULL LINE OF BUSINESS ALONGWITH
NAMES
OF PRODUCTS MANUFACTURED / TRADED BY THE
SUBJECT
AS THIS IS REQUIRED BY OUR CLIENT
SPECIFICALLY.
Company Details
Company
Name: STARCHIM
Headquarter
Address: 20
Parc Industriel CFCIM de Bouskoura,
Casablanca,
Morocco
Postal
Address: P.O.Box
202,
Casablanca
20180
Telephone: +212522
592026
+212522
592027
+212522
592028
Fax: +212522
592039
E‑Mail: starchim@starchim.com
Company History
Former
Addresses Date
of Change
10
Boulevard Chefchaouni, 08/2004
Ain
Sebaa,
Casablanca
Company
was originally started on 1997
Registration & Legal Details
Current
Legal Form: SOCIETE
A RESPONSIBILITE LIMITEE
Registration
Address: 20 Parc
Industriel CFCIM de Bouskoura,
Casablanca
Registration
Number: 86291
Registration
Date: 19/12/1996
Year/Date
Company Established: 1997
Registration
Town: Casablanca
Tax
Registration Number: 01900727
Capital
Currency: Moroccan
Dirham
Authorized
Capital: 1,000,000
Paid
Up Capital: 1,000,000
Previous
Capital amount:
300,000
Capital
increase on 2005
Authorized Capital Breakdown
Number of Shares: 10,000 Type of Shares: None Selected
Issued Shares: 10,000 Value per share: MDH 100.00 Value of this type: 1,000,000.00
Shareholders / Owners
Shareholders:
Name/Other
Information Shares
Held % of Voting/Non‑Voting
capital
Mr.
Abdellah Malek, 5,650 56.50%
(VOTING)
Allée
des Calyptus N°11 ‑ Aïn Sebaa,
Casablanca,
Morocco
Mr.
Noureddine Ben Haiba, 4,350 43.50%
(VOTING)
Lot
Bouchra N° 64 ‑ Sidi Maarouf,
Casablanca,
Morocco
Principals
Name: Mr
Abdellah Malek
Position
within the company: Managing director
Date
of Birth: 1951
Country
of Birth: Morocco
Nationality: Moroccan
Can
fluently speak: Arabic
& French
Name: Mr
Noureddine Ben Haiba
Position
within the company: Joint
Managing director
Date
of Birth: 15/03/1957
Country
of Birth: Morocco
Nationality: Moroccan
Can
fluently speak: Arabic
& French
Name: Mr
Amine Malek
Position
within the company: Commercial
Manager
Country
of Birth: Morocco
Nationality: Moroccan
Can
fluently speak: Arabic,
French & English
Company Activities
NACE
Codes: 4675 Wholesale of chemical products ‑ 100%
Subject
is engaged in trade of chemical products for industry (Building, Plastics and
paint).
Subject imports 100% of chemicals from
Switzerland, Saudi Arabia, Germany, Belgium, Turkey, Taiwan, China & India.
Subject
distributes then to the local market mainly on a wholesale basis.
This
company does not export.
Local
Reporters consider the investigated company to be MEDIUM in their field of
concern.
Operations
Employees Company
Employs: 12
HQ Premises Operates
from: Rented Offices , Shop
Premises
Size: 1150 square meters
Location: Industrial Area
Imports
Import
% and type of product: 100% Finished
Goods
Imports
From: Switzerland,
Saudi Arabia, Germany, Belgium,
Turkey,
Taiwan, China, India
Importing
Terms: 90‑120
days credit, bank transfer
Additional
Information: Cash against
documents
Letters
of credit
Agencies:
HUNTSMAN
JANA
NIR
BASF
CHEMTURA
CIBA
Exports
Export
% and type of product: Subject does
not export
Trading & Selling
Territory: 100%
Nationally
Type
of Customer: Industrial
Companies
Number
of accounts: 100
Vehicles: Total
number of vehicles: 4
2
trucks
2
cars
Related Companies
Subsidiaries
Affiliates
Information
on Related Companies is not available/applicable
Bankers
Attijariwafa
Bank,
Branch:
Yacoub El Mansour
18
Boulevard Yacoub El Mansour,
Casablanca,
Morocco
Account
Number: 007
780 000000 3397 000 26091
Relationship
with Bank: is reported
to be good
Financial Information
Financial
Interview Date: 17/05/2012
Source: Companies
Registry
Figures
are: Official
Figures
Currency: Moroccan
Dirham
Months Sales Figures Sales Gross
Profit/Loss Net Profit/Loss
12 31/12/2010 29,172,393 3,382,077 2,342,478
12 31/12/2009 23,627,223 3,386,449 2,354,887
12 31/12/2008 27,470,363 4,530,844 3,157,120
12 31/12/2007 23,360,253 3,128,537 2,022,001
12 31/12/2006 15,121,361 1,289,337 836,699
12 31/12/2004 13,129,677 509,746 329,888
12 31/12/2003 13,550,519 1,007,256 650,007
Balance Sheet & Profit &
Loss
BALANCE
SHEET
|
|
As at: 31‑Dec‑2010 |
As at: 31‑Dec‑2009 |
As at: 31‑Dec‑2008 |
|
Fixed Assets |
|
|
|
|
Land & Buildings |
465,534 |
547,687 |
644,338 |
|
Plant & Machinery |
21,411 |
21,266 |
30,380 |
|
Furniture & Equipment |
313,874 |
410,295 |
492,309 |
|
Motor Vehicles |
207,321 |
|
|
|
Misc. Fixed Assets |
|
|
|
|
Total Fixed Assets |
1,008,140 |
979,248 |
1,167,027 |
|
|
|
|
|
|
Financial Assets |
|
|
|
|
Shares in Related Companies |
|
|
|
|
Loans to related companies |
|
|
|
|
Investments |
|
|
|
|
Deposits |
|
|
|
|
Misc. Financial Assets |
44,561 |
44,561 |
44,561 |
|
Total Financial Assets |
44,561 |
44,561 |
44,561 |
|
|
|
|
|
|
Intangibles |
|
|
|
|
Goodwill |
|
|
|
|
Organisational Expenses |
|
|
|
|
Patents |
62 |
125 |
250 |
|
Misc. Intangible Assets |
|
|
|
|
Total Intangible Assets |
62 |
125 |
250 |
|
|
|
|
|
|
Current Assets |
|
|
|
|
Stock |
7,865,054 |
4,443,823 |
3,748,054 |
|
Stock & Work in Progress |
|
|
|
|
Trade Debtors & receivables |
9,836,445 |
6,340,544 |
8,194,093 |
|
Provision for bad debs |
|
|
|
|
Other receivables |
61,389 |
73,689 |
69,659 |
|
Due from related companies |
|
|
|
|
Owed by shareholders |
|
|
|
|
Prepaid expenses |
|
|
|
|
Cash |
1,003,918 |
2,857,154 |
2,152,588 |
|
Tax recoverable |
2,147,624 |
1,943,162 |
1,643,702 |
|
Marketable Securities |
|
|
|
|
Misc. Current Assets |
109,621 |
16,373 |
|
|
Total Current Assets |
21,024,051 |
15,658,372 |
15,824,469 |
|
Total Assets |
22,076,814 |
16,682,306 |
17,036,307 |
|
Owner's Equity & Liabilities |
|
|
|
|
Issued and paid up capital |
1,000,000 |
1,000,000 |
1,000,000 |
|
Share premium account |
|
|
|
|
Retained earnings |
6,100,198 |
5,245,310 |
3,983,190 |
|
Net profit/Loss for the year |
2,342,478 |
2,354,887 |
3,157,120 |
|
Revaluation reserves |
|
|
|
|
Legal Reserves |
200,000 |
200,000 |
200,000 |
|
Other reserves |
744,435 |
744,435 |
744,435 |
|
Net Worth |
10,387,111 |
9,544,632 |
9,084,745 |
|
|
|
|
|
|
|
|
|
|
|
Deffered Taxation |
|
|
|
|
Provisions/allowances |
310,461 |
310,461 |
310,461 |
|
Mortgages/Loans |
|
|
|
|
Hire purchase |
|
|
|
|
Due to group of companies |
|
|
|
|
Minority interest |
|
|
|
|
Misc. deferred liabilities |
|
|
|
|
Total Long Term Liabilities |
310,461 |
310,461 |
310,461 |
|
|
|
|
|
|
Current Liabilities |
|
|
|
|
Creditors |
7,288,657 |
3,106,145 |
3,786,529 |
|
Other creditors |
3,216 |
3,210 |
3,211 |
|
Accruals |
|
|
|
|
Bank overdrafts/Loans |
54,952 |
54,952 |
54,952 |
|
Misc. Loans |
|
|
|
|
Directors accounts |
|
|
|
|
Owing to shareholders |
263,360 |
263,360 |
263,360 |
|
Owing to related companies |
|
|
|
|
Proposed dividend |
|
|
|
|
Long Term‑due 1 year |
|
|
|
|
Hire Purchase‑under 1 year |
|
|
|
|
Taxation |
3,223,411 |
3,006,698 |
3,158,944 |
|
Advance receipts |
|
|
|
|
Misc. Current Liabilities |
545,646 |
392,848 |
374,105 |
|
Total Current Liabilities |
11,379,242 |
6,827,213 |
7,641,101 |
|
Owner's Equity & Liabilities |
22,076,814 |
16,682,306 |
17,036,307 |
PROFIT & LOSS
|
|
Figures are: |
Figures are: |
Figures are: |
|
|
Fiscal Year |
Fiscal Year |
Fiscal Year |
|
|
|
|
|
|
|
01/01/2010 to 31/12/2010 |
01/01/2009 to 31/12/2009 |
01/01/2008 to 31/12/2008 |
|
Total Income/Turnover |
29,172,393 |
23,627,223 |
27,470,363 |
|
Cost of sales |
20,308,820 |
15,791,059 |
18,205,747 |
|
|
|
|
|
|
Gross Profit/(Loss) |
8,863,573 |
7,836,164 |
9,264,616 |
|
|
|
|
|
|
Admin/selling expenses |
244,875 |
107,170 |
86,651 |
|
Services |
1,566,107 |
1,192,240 |
1,384,057 |
|
Salaries |
3,510,191 |
2,974,749 |
2,577,266 |
|
Auditors Fee |
54,190 |
41,136 |
64,753 |
|
Stock Depreciation |
|
|
|
|
Depreciation |
1,172,546 |
1,459,669 |
1,649,137 |
|
Misc. Operating Expenses |
|
|
|
|
Misc. Operating Income |
1,194,542 |
1,290,253 |
1,170,903 |
|
Net Operating Profit/(Loss) |
3,510,206 |
3,351,453 |
4,673,655 |
|
|
|
|
|
|
Interest Receivable/Finance Income |
9,133 |
|
|
|
Group related income |
|
|
|
|
Misc. Financial Income |
195,758 |
134,909 |
134,653 |
|
Total Financial Income |
204,891 |
134,909 |
134,653 |
|
|
|
|
|
|
Interest Payable/Finance costs |
15,060 |
25,405 |
|
|
Misc. financial expenses |
317,960 |
99,913 |
252,059 |
|
Total Financial Expenses |
333,020 |
99,913 |
277,464 |
|
|
|
|
|
|
Profit/(Loss) before taxes |
3,382,077 |
3,386,449 |
4,530,844 |
|
|
|
|
|
|
Income Tax |
1,039,599 |
1,031,562 |
1,373,724 |
|
Other Tax |
|
|
|
|
Profit/(Loss) after taxes |
2,342,478 |
2,354,887 |
3,157,120 |
|
|
|
|
|
|
Extraordinary items |
|
|
|
|
Exceptional items |
|
|
|
|
Misc. Items |
|
|
|
|
|
|
|
|
|
Net Profit/(Loss) |
2,342,478 |
2,354,887 |
3,157,120 |
|
|
|
|
|
|
|
|
|
|
|
Previous years retained earnings |
|
|
|
|
Current years net income |
2,342,478 |
2,354,887 |
3,157,120 |
|
Misc. additions in current year |
|
|
|
|
Current years net loss |
|
|
|
|
Dividends in current year |
|
|
|
|
Withdrawals in current year |
|
|
|
|
Misc. deductions in current year |
|
|
|
|
|
|
|
|
|
Retained earnings at end of |
2,342,478 |
2,354,887 |
3,157,120 |
|
financial period |
|
|
|
|
|
|
|
|
|
Average employees |
|
|
|
|
|
|
|
|
|
Directors fee |
|
|
|
|
Earnings per share |
|
|
|
|
Earnings per share‑previous year |
|
|
|
|
|
|
|
|
|
|
|
|
|
|
Average employees |
|
|
|
|
|
|
|
|
|
Directors fee |
|
|
|
|
Earnings per share |
|
|
|
|
Earnings per share‑previous year |
|
|
|
Auditors Comments
Date
accounts obtained: 17/05/2012
Accounts
obtained from: Companies
registry
Auditors Opinion: The audited
financial statement gives a true and fair view of the state of affairs of the
subject
Financial
Statements have been prepared on an on‑going basis.
Assuming
support of: shareholders
FINANCIAL RATIOS / COMPARATIVE
DATA
Actual
Company Industrial Averages Actual Company Industrial Averages
Results
(2010) (2010) Results (2009) (2009)
Liquidity
Ratios
Current Ratio 1.85 1.49 2.29 1.51
Acid Test Ratio 1.16 0.94 1.64 0.97
Accounts 0.25 0.33 0.13 0.39
Payable/Sales
Ratio
Current Liabilities/Net 1.10 5.19 0.72 ‑13.23
Worth
Total Liabilities/Net 1.13 5.34 0.75 ‑13.01
Worth
Fixed Assets/Net 9.71 48.88 10.26 53.34
Worth (%)
Profitability
Ratios
Gross Profit Ratio (%) 30.38 27.13 33.17 26.11
Return on Capital 31.62 16.38 34.36 ‑88.85
Employed
(ROCE)(%)
Net Profit/Sales (%) 11.59 1.71 14.33 2.11
Return on Assets (%) 15.32 4.05 20.30 3.84
Efficiency
Ratios
Sales/Working Capital 3.02 11.01 2.68 0.53
Assets/Sales(%) 75.68 111.71 70.61 122.49
Shareholders 32.56 15.00 35.48 ‑87.70
Return(%)
Average Inventory 110.61 293.04 94.67 171.47
Period
Average Collection 101.20 149.59 112.27 138.27
Period
Leverage
Ratios
Capital Employed 2.81 7.54 2.48 12.92
Capital Structure (%) 2.90 18.68 3.15 26.67
Number of 602 602
Companies
within the
industry
(NACE G)
Statistics
based on Wholesale
and retail Wholesale
and retail
NACE(G) trade;repair
of motor trade;repair
of motor
vehicles
and vehicles
and
motorcycles motorcycles
The statistical Industrial Average results are
calculated against companies within the database for the specific country.
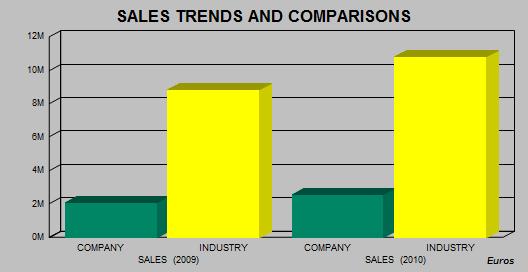
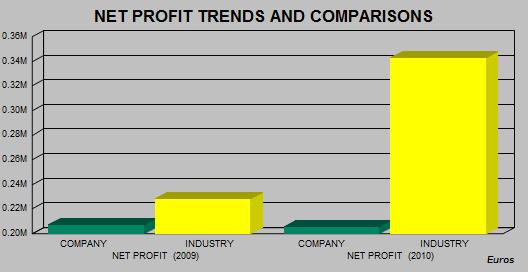
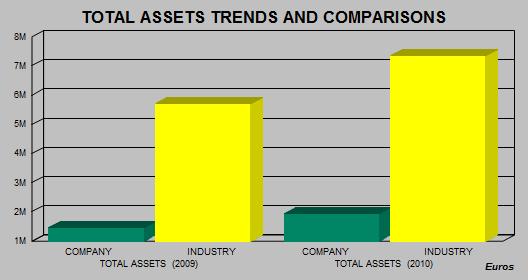
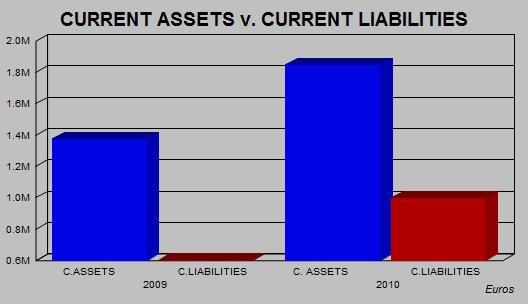
INDUSTRY SECTOR COMPARATIVE DATA
Elements Taken Result for specific RANKING Total Companies Used
company
DATE OF REGISTRATION 19/12/1996 572 1193
TOTAL EMPLOYEES 12 567 1071
SALES (2010) 2,564,837 153 372
SALES (2009) 2,077,305 227 563
NET PROFIT (2010) 205,951 58 312
NET PROFIT (2009) 207,042 90 579
TOTAL ASSETS (2010) 1,940,993 138 308
TOTAL ASSETS (2009) 1,466,708 260 579
Currency:
EUROS
Rankings
The results given below are calculated against
companies with the Database for the specific country.
Scale: 1 is the highest result found in our
database.
Example: Ranking 5: Total Companies used to
generate the Ranking : 20
This means that this company is the 5th largest
company out of 20 found in our database in the specific industry
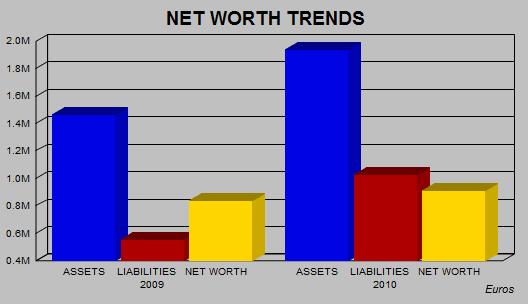
Charts of Financial Trends and
Industry Comparisons
PLEASE
NOTE THAT CHARTS ARE SHOWN IN EUROS FOR TREND AND COMPARISON PURPOSES
The statistical
Industrial Average results are calculated against companies within the database
for the
specific
country.
Payments
Subject's payments reported to be: NO COMPLAINTS
Representation
Other Comments
Other Comments: Patent N° : 32930321
Interview & Reporter Comments
Comment: Subject has confirmed the general details shown in the report.
Reporter Comment: All legal forms in Morocco are obliged by law to be registered with the Registry Office (OMPIC: Office Marocain de la Propriete Industrielle et Commerciale) which is publicly available.
Subject was found registered and Information obtained from above official source is as follows :
Registered name / registration number / date of registration / registered address / legal form / capital / main principals – administrators / shareholders / shareholders % / financial information.
According to the Morocco Commercial Law, all legal forms except for proprietorship entities are obliged to file their financial accounts to the OMPIC.
Any other data stated in the report was obtained directly from the subject company and/or other publicly available information. Therefore it should be used as a point of reference as it is not possible to verify such data with official sources.
Conclusions
Local Reputation :The company being investigated is considered by local reporters to be a Fair / Normal
Trade Risk.
General Conclusion: Local informants consider granting of credit to be a fair trade risk.
Owner/Shareholders Comments: All or most of the owners / shareholders have an active participation in the running of the business.
Financial Results Trend: Financial Information indicates that the business activities of the company are
showing an upward turn.
Age of Business: The company is long established in the local market.
Country Intelligence Information
Country: Morocco
Date: 26/04/2012 00:00:00
Source: Economist
Intelligence Unit
Economy: February
15th 2012
Trade deficit reaches a
record Dh186bn in 2011
Morocco's trade deficit
reached a record high of Dh186bn (US$23bn) in 2011, up by 25.2% year on
year. According to
preliminary figures from the Office des changes, Morocco's customs agency,
import costs rose to
Dh355bn, up from Dh298bn in 2010, and exports reached Dh169bn, up by
13.1%.
In 2011 the phosphates
sector strongly benefited from higher international prices. The price of
phosphates reached over
US$200/tonne in November 2011, 44.6% higher than at the end of 2010.
Raw phosphate exports
reached Dh12.5bn, up by 39% year on year. Phosphates derivatives rose by
29.3% to Dh34.8bn. The
Office chérifien des phosphates, the state‑owned phosphate miner, is
currently implementing
a sizeable investment programme (€6.3bn by 2020), which is aimed at raising
gross phosphate
production from 28m to 47m tonnes, with roughly 80% processed locally. In
December a new Dh2.7bn
phosphate‑fertiliser production unit in partnership with Bunge, a
US‑headquartered
company, was inaugurated at Jorf Lasfar.
The rise in import
costs was mainly down to higher prices for wheat and energy products. Morocco
has no hydrocarbons
resources and thus must meet its energy needs through imports, which weigh
heavily on the current
account. Overall energy imports increased by 32.7% in 2011. The import bill for
crude oil grew by 26.7%
to Dh31.8bn. The wheat import bill surged by 48.4% to Dh11bn, despite a
relatively strong
harvest last year.
Remittances from
Moroccans living abroad and tourism receipts expanded by 7.6% and 4%
respectively to around
Dh59bn each in 2011. These earnings have helped to offset only part of the
considerable trade
deficit as inflows from foreign direct investment (FDI) dropped by 26% to
Dh29bn.
The central bank's
international reserves stood at Dh177bn at the end of 2011, which is enough to
cover for five and a
half months of imports, one of the lowest levels in several years. In February
Morocco's finance
minister, Mr Baraka, said that the country may issue another Eurobond to help
cover its financing
requirement and also that facilities remain open from the EU or other
multilateral
lenders.
Risk: March 19th 2012
Sovereign risk
Stable. Morocco's fiscal
account will remain deeply in deficit, owing to high recurrent expenditure on
subsidies and wages,
but the shortfalls should be financed mostly by borrowing from domestic
banks, thus keeping the
external debt stock in check.
Currency risk
Stable. The current
exchange‑rate system—a managed float—will remain in place. The Moroccan
dirham will strengthen
against the euro, but the central bank has the capacity to intervene if
necessary to protect
exporters.
Banking sector risk
Stable. The banking
sector has benefited from prudential regulation, relatively low levels of
non‑performing
loans (although these are rising) and limited direct foreign exposure. The
government
is encouraging rural
Moroccans and expatriates to save in an effort to improve liquidity
Political risk
The government will
increase public spending in the short term to quell political and social
protests
over unemployment and
poverty. Tensions over the disputed territory of Western Sahara may also
lead to violent
demonstrations.
Economic structure risk
Dependence on
agriculture leaves economic performance vulnerable to weather conditions. The
fiscal
and external deficits
fluctuate in line with movements in international commodity prices but are
manageable.
FOREIGN EXCHANGE RATES
|
Currency |
Unit
|
Indian Rupees |
|
US Dollar |
1 |
Rs.54.87 |
|
|
1 |
Rs.86.46 |
|
Euro |
1 |
Rs.69.49 |
INFORMATION DETAILS
|
Report Prepared
by : |
PRL |
RATING EXPLANATIONS
|
RATING |
STATUS |
PROPOSED CREDIT LINE |
|
|
>86 |
Aaa |
Possesses an extremely sound financial base with the strongest
capability for timely payment of interest and principal sums |
Unlimited |
|
71-85 |
Aa |
Possesses adequate working capital. No caution needed for credit transaction.
It has above average (strong) capability for payment of interest and
principal sums |
Large |
|
56-70 |
A |
Financial & operational base are regarded healthy. General unfavourable
factors will not cause fatal effect. Satisfactory capability for payment of
interest and principal sums |
Fairly Large |
|
41-55 |
Ba |
Overall operation is considered normal. Capable to meet normal
commitments. |
Satisfactory |
|
26-40 |
B |
Capability to overcome financial difficulties seems comparatively
below average. |
Small |
|
11-25 |
Ca |
Adverse factors are apparent. Repayment of interest and principal sums
in default or expected to be in default upon maturity |
Limited with full
security |
|
<10 |
C |
Absolute credit risk exists. Caution needed to be exercised |
Credit not
recommended |
|
-- |
NB |
New Business |
-- |
This score serves as a reference to assess SC’s credit risk and
to set the amount of credit to be extended. It is calculated from a composite
of weighted scores obtained from each of the major sections of this report. The
assessed factors and their relative weights (as indicated through %) are as
follows:
Financial
condition (40%) Ownership
background (20%) Payment
record (10%)
Credit history
(10%) Market trend
(10%) Operational
size (10%)
This report is issued at your request without any
risk and responsibility on the part of MIRA INFORM PRIVATE LIMITED (MIPL) or
its officials.