MIRA
INFORM REPORT
|
Report Date : |
25.10.2012 |
IDENTIFICATION DETAILS
|
Name : |
QUANG MINH CORPORATION JOINT STOCK COMPANY |
|
|
|
|
|
|
Registered Office : |
M- Floor, Sofitel Plaza Ha Noi Hotel, No 1, Thanh Nien Street, Truc Bach Ward, Ba Dinh District, Ha Noi City |
|
|
|
|
|
|
Country : |
|
|
|
|
|
|
|
Financials (as on) : |
31.12.2011 |
|
|
|
|
|
|
Year of Establishment : |
2002 |
|
|
|
|
|
|
Com. Reg. No.: |
0101205275 |
|
|
|
|
|
|
Legal Form : |
Joint Stock Company |
|
|
|
|
|
|
Line of Business : |
Manufacturing and
trading animal feeds |
|
|
|
|
|
|
No. of Employees : |
1,000 |
|
RATING & COMMENTS
|
MIRA’s Rating : |
Ba |
|
RATING |
STATUS |
PROPOSED CREDIT LINE |
|
|
41-55 |
Ba |
Overall operation is considered normal. Capable to meet normal
commitments. |
Satisfactory |
|
Status : |
Satisfactory |
|
Payment Behaviour : |
No Complaints |
|
Litigation : |
Clear |
NOTES :
Any query related to this report can be made
on e-mail: infodept@mirainform.com
while quoting report number, name and date.
ECGC Country Risk Classification List – June 30th, 2012
|
Country Name |
Previous Rating (31.03.2011) |
Current Rating (30.06.2012) |
|
|
B1 |
B1 |
|
Risk Category |
ECGC
Classification |
|
Insignificant |
A1 |
|
Low |
A2 |
|
Moderate |
B1 |
|
High |
B2 |
|
Very High |
C1 |
|
Restricted |
C2 |
|
Off-credit |
D |
Source : CIA
SUBJECT IDENTIFICATION & LEGAL
FORM
|
||
|
|
||
Current legal status
|
||
|
English Name |
|
QUANG MINH CORPORATION JOINT STOCK COMPANY
|
|
Vietnamese Name |
|
CONG TY CO PHAN TAP DOAN QUANG MINH |
|
Short name |
|
QUANG MINH CORP., JSC |
|
Type of Business |
|
Joint stock company |
|
Year Established |
|
2002 |
|
Business Registration No. |
|
0101205275 |
|
The first Date of Registration |
|
19 May 2010 |
|
Place of Registration |
|
|
|
Chartered capital |
|
VND 989,000,000,000 |
|
Status |
|
Unlisted |
|
Tax code |
|
0101205275 |
|
Total Employees |
|
1,000 |
|
Size |
|
Large |
Historical Identification & Legal form
|
List |
Changed Items |
Date of changes |
|
1 |
Subject has got former Chartered capital:
VND 668,000,000,000 Changed to: VND 989,000,000,000 |
26
Oct 2011 |
|
2 |
Subject has got former Chartered capital:
VND 368,000,000,000 in May 2010 Changed to: VND 668,000,000,000 |
10
Mar 2011 |
|
3 |
Subject has got former Registered English
Name: QUANG MINH TECHNOLOGICAL DEVELOPMENT AND INVESTMENT COMPANY LIMITED |
19
May 2010 |
|
4 |
Subject has got former Abbreviated Name:
QUANG MINH CO., LTD Changed to: QUANG MINH CORP.,JSC |
19
May 2010 |
|
5 |
Subject has got former Type of Business:
Limited Liability Company Changed to: Joint Stock Company |
19
May 2010 |
|
6 |
Subject has got former Business
Registration No: 0102004382 issued on 21st Jan 2002 Changed to: 0101205275 |
19
May 2010 |
|
7 |
Subject has got former Registered
Vietnamese Name: CONG TY TNHH DAU TU VA PHAT TRIEN CONG NGHE QUANG MINH Changed to: CONG TY CO PHAN TAP DOAN QUANG
MINH |
19
May 2010 |
|
8 |
Subject has got former Address: No. 499
Tran Khat Chan Str., Thanh Nhan Ward, Hai Ba Trung Dist, Changed to: No. 434 Tran Khat Chan Str.,
Pho |
01
Jun 2009 |
|
9 |
Subject has got former Address: No. 434, Changed to: Room 01 & 02, M Floor,
Sofitel Plaza Ha Noi Hotel, No. 1, Thanh Nien Street, Truc Bach Ward, Ba Dinh
District, Ha Noi CIty, Viet Nam |
N/A |
|
|
||
ADDRESSES
|
||
|
|
||
|
Head Office |
||
|
Address |
|
M- Floor, Sofitel Plaza Ha Noi Hotel, No
1, Thanh Nien Street, Truc Bach Ward, Ba Dinh District, Ha Noi City, Vietnam |
|
Telephone |
|
(84-4)36225123 |
|
Fax |
|
(84-4)36241559 |
|
Email |
|
|
|
Website |
|
|
|
|
||
|
Brand in Dong
Nai |
||
|
Address |
|
Tam Phuoc, Long Thanh District, |
|
|
||
|
Brand in Quang
Ninh |
||
|
Address |
|
|
|
Telephone |
|
(84-33) 3515066 |
|
Fax |
|
(84-33) 3512438 |
|
|
||
SUBSIDIARIES AND RELATED
COMPANIES
|
||
|
|
||
|
1. QUANG MINH
VEGETABLE OIL JOINT STOCK COMPANY |
||
|
Business Registration |
|
0900269500 |
|
Date of Registration |
|
27 Jun 2011 |
|
Place of Registration |
|
Hung Yen Department of Planning and Investment |
|
Registered Capital |
|
VND 416,150,000,000 |
|
Tax code |
|
0900269500 |
|
Address |
|
Luong Hoi Hamlet, |
|
Tel |
|
(84-321) 3821 888 |
|
Fax |
|
(84-321) 3811 999 |
|
|
||
|
2. QUANG MINH
NUTRITION JOINT STOCK COMPANY |
||
|
Business Registration |
|
1000420278 |
|
Date of Registration |
|
16 May 2011 |
|
Place of Registration |
|
Thai Binh Department of Planning and Investment |
|
Registered Capital |
|
VND 60,000,000,000 |
|
Tax code |
|
1000420278 |
|
Address |
|
Lot DT, Nguyen Mau Kien Road, Phuc Khanh Industrial Park, Thai Binh
Province, Vietnam |
|
Tel |
|
(84-36) 3615 888 |
|
Fax |
|
(84-36) 3615 666 |
|
|
||
DIRECTORS
|
||
|
|
||
|
1.
NAME |
|
Mr.
TRAN THANH QUANG |
|
Position |
|
General Director |
|
Date of Birth |
|
14 Feb 1973 |
|
ID Number/Passport |
|
012491376 |
|
ID Issue Date |
|
06 May 2010 |
|
|
|
Ha noi Police Station
|
|
Resident |
|
No. 31-C2, Nam Thang
Long Urban, Phu Thuong Ward, Tay Ho District, Ha Noi City, Vietnam |
|
Current resident |
|
No. 31 - C2, |
|
Nationality |
|
Vietnamese |
|
|
||
|
2.
NAME |
|
Mr.
TRAN VAN TOAN |
|
Position |
|
Deputy General Director |
|
Date of Birth |
|
09 Jul 1978 |
|
ID Number/Passport |
|
013039761 |
|
ID Issue Date |
|
28 Feb 2008 |
|
|
|
Hanoi Police station |
|
Current resident |
|
Zoom 714 - Building 5 Phap Van – Tu Hiep
New Urban Area - Hoang Liet Ward, Hoang Mai District, Ha |
|
Nationality |
|
Vietnamese |
|
Tel/Mobile phone |
|
+84 983366577 |
|
|
||
|
3.
NAME |
|
Ms.
LUU THI HONG YEN |
|
Position |
|
Chief Accountant |
|
Nationality |
|
Vietnamese |
|
Tel/Mobile phone |
|
(84-4) 36225123 EXT 18 |
|
|
||
BUSINESS NATURE AND ACTIVITIES
|
|
|
|
The subject is operating in the following business
activities: |
|
|
IMPORT & EXPORT ACTIVITIES
|
||
|
|
||
|
IMPORT: |
||
|
·
Types of products |
|
Grain of wheat, soy bean, grain of corn and some agricultural
products. |
|
·
Market |
|
|
|
·
Ratio |
|
100% |
|
·
Mode of payment |
|
L/C, T/T, D/P |
|
|
||
|
EXPORT: |
||
|
·
Types of products |
|
Cooking oil |
|
·
Market |
|
|
|
|
||
BANKERS
|
||
|
|
||
|
1.
|
||
|
Address |
|
C3 Building, My Dinh Urban Area, Nguyen Co Thach Str, Tu Liem District,
Ha Noi City, Vietnam |
|
Telephone |
|
(84-4) 62871702/03/04 |
|
Fax |
|
(84-4) 62871976 |
|
|
||
|
2.
VIET NAM BANK FOR AGRICULTURE AND RURAL DEVELOPMENT BACH KHOA BRANCH |
||
|
Address |
|
92 Vo Thi Sau, Hai Ba Trung District, Ha |
|
Telephone |
|
(84-4) 6226956 |
|
|
||
SHAREHOLDERS
|
||
|
|
||
|
1.
NAME |
|
Mr.
TRAN THANH QUANG |
|
Position |
|
General Director |
|
Date of Birth |
|
14 Feb 1973 |
|
ID Number/Passport |
|
012491376 |
|
Issued on |
|
06 May 2010 |
|
Issued Place |
|
Ha noi Police Station |
|
Resident |
|
No. 31-C2, |
|
Current Resident |
|
No. 31 - C2, |
|
Nationality |
|
Vietnamese |
|
Number of Shares |
|
74,150,000 |
|
Value of shares |
|
VND 741,750,000,000 |
|
Percentage |
|
75% |
|
|
||
|
2.
NAME |
|
Mr.
TRAN THANH VINH |
|
ID Number/Passport |
|
151137056 |
|
Resident |
|
Song Tien Hamlet, Vu Tien Commune, Vu Thu
District, |
|
Nationality |
|
Vietnamese |
|
Number of Shares |
|
12,362,500 |
|
Value of shares |
|
VND 123,625,000,000 |
|
Percentage |
|
12.5% |
|
|
||
|
3.
NAME |
|
Mr.
TRAN VAN TOAN |
|
Date of Birth |
|
01 Jan 1978 |
|
ID Number/Passport |
|
013036761 |
|
Issued Place |
|
Police station of Ha Noi City |
|
Resident |
|
Hoang Liet Ward, Hoang Mai District, Ha |
|
Mobile phone |
|
++84 983 366 577 |
|
Nationality |
|
Vietnamese |
|
Number of Shares |
|
12,362,500 |
|
Value of shares |
|
VND 123,625,000,000 |
|
Percentage |
|
12.5% |
|
|
||
FINANCIAL DATA
|
|||
|
Note: The financial data of FY 2010 was audited and consolidated;
hence, it has some differences from the previous data. |
|||
|
BALANCE
SHEET |
|||
Unit: One VND
|
|||
|
Balance sheet
date |
31/12/2011 |
31/12/2010 |
31/12/2009 |
|
Number of weeks |
52 |
52 |
52 |
|
Status |
Audited &
Consolidated |
Audited &
Consolidated |
N/A |
ASSETS
|
|||
|
A – CURRENT
ASSETS |
2,718,433,644,406
|
1,313,964,392,161
|
410,642,108,204 |
|
I. Cash and cash
equivalents |
39,884,319,867 |
13,341,964,101 |
20,790,846,940 |
|
1. Cash |
39,884,319,867 |
13,341,964,101 |
20,790,846,940 |
|
2. Cash equivalents |
0 |
0 |
|
|
II. Short-term
investments |
152,000,000,000 |
0 |
|
|
1. Short-term investments |
152,000,000,000 |
0 |
|
|
2. Provisions for devaluation of short-term investments |
0 |
0 |
|
|
III. Accounts
receivable |
795,099,643,169 |
493,968,565,386 |
248,677,056,104 |
|
1. Receivable from customers |
652,874,457,434 |
399,446,166,825 |
126,044,587,731 |
|
2. Prepayments to suppliers |
142,225,185,735 |
81,522,398,561 |
122,371,285,607 |
|
3. Inter-company receivable |
0 |
0 |
|
|
4. Receivable according to the progress of construction |
0 |
0 |
|
|
5. Other receivable |
0 |
13,000,000,000 |
261,182,766 |
|
6. Provisions for bad debts |
0 |
0 |
|
|
IV. Inventories |
1,594,117,518,032
|
795,691,743,948 |
124,796,765,626 |
|
1. Inventories |
1,594,117,518,032 |
795,691,743,948 |
124,796,765,626 |
|
2. Provisions for devaluation of inventories |
0 |
0 |
|
|
V. Other Current
Assets |
137,332,163,338 |
10,962,118,726 |
16,377,439,534 |
|
1. Short-term prepaid expenses |
0 |
0 |
|
|
2. VAT to be deducted |
0 |
10,382,118,726 |
|
|
3. Taxes and other accounts receivable from the State |
0 |
0 |
|
|
4. Other current assets |
137,332,163,338 |
580,000,000 |
16,377,439,534 |
|
B. LONG-TERM
ASSETS |
832,641,266,260 |
647,718,879,498 |
80,484,396,594 |
|
I. Long term accounts
receivable |
0 |
0 |
|
|
1. Long term account receivable from customers |
0 |
0 |
|
|
2. Working capital in affiliates |
0 |
0 |
|
|
3. Long-term inter-company receivable |
0 |
0 |
|
|
4. Other long-term receivable |
0 |
0 |
|
|
5. Provisions for bad debts from customers |
0 |
0 |
|
|
II. Fixed assets
|
761,141,266,260 |
647,718,879,498 |
67,784,803,330 |
|
1. Tangible assets |
534,769,153,159 |
292,872,972,377 |
36,195,866,718 |
|
- Historical costs |
588,652,945,640 |
321,661,613,710 |
40,139,674,780 |
|
- Accumulated depreciation |
-53,883,792,481 |
-28,788,641,333 |
-3,943,808,062 |
|
2. Financial leasehold assets |
0 |
0 |
|
|
- Historical costs |
0 |
0 |
|
|
- Accumulated depreciation |
0 |
0 |
|
|
3. Intangible assets |
135,024,745,012 |
11,932,798,447 |
|
|
- Initial costs |
136,510,050,934 |
11,990,815,500 |
|
|
- Accumulated amortization |
-1,485,305,922 |
-58,017,053 |
|
|
4. Construction-in-progress |
91,347,368,089 |
342,913,108,674 |
31,588,936,612 |
|
III. Investment
property |
0 |
0 |
|
|
Historical costs |
0 |
0 |
|
|
Accumulated depreciation |
0 |
0 |
|
|
IV. Long-term
investments |
71,500,000,000 |
0 |
10,000,000,000 |
|
1. Investments in affiliates |
71,500,000,000 |
0 |
|
|
2. Investments in business concerns and joint ventures |
0 |
0 |
|
|
3. Other long-term investments |
0 |
0 |
10,000,000,000 |
|
4. Provisions for devaluation of long-term investments |
0 |
0 |
|
|
V. Other long-term
assets |
0 |
0 |
2,699,593,264 |
|
1. Long-term prepaid expenses |
0 |
0 |
648,168,342 |
|
2. Deferred income tax assets |
0 |
0 |
|
|
3. Other long-term assets |
0 |
0 |
2,051,424,922 |
|
VI. Goodwill |
0 |
0 |
|
|
1. Goodwill |
0 |
0 |
|
|
TOTAL ASSETS |
3,551,074,910,666
|
1,961,683,271,659
|
491,126,504,798 |
|
|
|||
LIABILITIES
|
|||
|
A- LIABILITIES |
2,265,642,521,523
|
1,389,520,748,057
|
312,972,508,196 |
|
I. Current
liabilities |
2,118,684,392,675
|
997,251,621,724 |
302,001,411,354 |
|
1. Short-term debts and loans |
1,062,871,526,747 |
732,686,868,157 |
274,898,865,070 |
|
2. Payable to suppliers |
1,018,596,823,719 |
238,762,833,195 |
22,081,835,326 |
|
3. Advances from customers |
5,762,237,695 |
21,764,764,395 |
1,663,841,808 |
|
4. Taxes and other obligations to the State Budget |
30,059,111,783 |
3,381,458,738 |
3,356,869,150 |
|
5. Payable to employees |
1,394,692,731 |
655,697,239 |
|
|
6. Accrued expenses |
0 |
0 |
|
|
7. Inter-company payable |
0 |
0 |
|
|
8. Payable according to the progress of construction contracts |
0 |
0 |
|
|
9. Other payable |
0 |
0 |
|
|
10. Provisions for short-term accounts payable |
0 |
0 |
|
|
II. Long-Term
Liabilities |
146,958,128,848 |
392,269,126,333 |
10,971,096,842 |
|
1. Long-term accounts payable to suppliers |
0 |
0 |
|
|
2. Long-term inter-company payable |
0 |
0 |
|
|
3. Other long-term payable |
0 |
41,800,000,000 |
|
|
4. Long-term debts and loans |
146,958,128,848 |
350,469,126,333 |
10,971,096,842 |
|
5. Deferred income tax payable |
0 |
0 |
|
|
6. Provisions for unemployment allowances |
0 |
0 |
|
|
7. Provisions for long-term accounts payable |
0 |
0 |
|
|
B- OWNER’S
EQUITY |
1,213,627,354,155
|
525,868,659,023 |
178,153,996,602 |
|
I. OWNER’S
EQUITY |
1,213,627,354,155
|
525,868,659,023 |
178,153,996,602 |
|
1. Capital |
989,000,000,000 |
368,000,000,000 |
180,000,000,000 |
|
2. Share premiums |
0 |
0 |
|
|
3. Other sources of capital |
0 |
61,651,292,123 |
|
|
4. Treasury stocks |
0 |
0 |
|
|
5. Differences on asset revaluation |
0 |
0 |
|
|
6. Foreign exchange differences |
0 |
0 |
|
|
7. Business promotion fund |
0 |
0 |
|
|
8. Financial reserved fund |
0 |
0 |
|
|
9. Other funds |
0 |
0 |
|
|
10. Retained earnings |
224,627,354,155 |
96,217,366,900 |
-1,846,003,398 |
|
11. Construction investment fund |
0 |
0 |
|
|
II. Other
sources and funds |
0 |
0 |
|
|
1. Bonus and welfare funds (Elder form) |
0 |
0 |
|
|
2. Sources of expenditure |
0 |
0 |
|
|
3. Fund to form fixed assets |
0 |
0 |
|
|
MINORITY’S
INTEREST |
71,805,034,988 |
46,293,864,579 |
|
|
TOTAL
LIABILITIES AND OWNER’S EQUITY |
3,551,074,910,666
|
1,961,683,271,659
|
491,126,504,798 |
|
|
|||
|
PROFIT
& LOSS STATEMENT |
|||
|
|
|||
|
Description |
FY2011 |
FY2010 |
FY2009 |
|
1. Total Sales |
6,610,579,537,325
|
2,661,564,199,592
|
815,029,493,234 |
|
2. Deduction item |
0 |
0 |
|
|
3. Net revenue |
6,610,579,537,325
|
2,661,564,199,592
|
815,029,493,234 |
|
4. Costs of goods sold |
5,928,455,400,619 |
2,365,744,439,966 |
780,599,530,245 |
|
5. Gross profit |
682,124,136,706 |
295,819,759,626 |
34,429,962,989 |
|
6. Financial income |
14,526,504,474 |
3,554,579,941 |
2,053,881,869 |
|
7. Financial expenses |
198,533,781,787 |
71,307,243,955 |
25,129,556,424 |
|
- In which: Loan interest expenses |
174,092,678,570 |
53,885,379,810 |
16,814,742,367 |
|
8. Selling expenses |
51,671,234,649 |
0 |
|
|
9. Administrative overheads |
144,008,920,685 |
83,905,666,844 |
13,699,761,342 |
|
10. Net operating profit |
302,436,704,059 |
144,161,428,768 |
-2,345,472,908 |
|
11. Other income |
9,298,975,736 |
12,035,886,997 |
3,437,729,273 |
|
12. Other expenses |
80,315,220 |
4,925,100,510 |
476,194,087 |
|
13. Other profit /(loss) |
9,218,660,516 |
7,110,786,487 |
2,961,535,186 |
|
14. Total accounting profit before tax |
311,655,364,575 |
151,272,215,255 |
616,062,278 |
|
15. Current corporate income tax |
77,520,975,431 |
37,818,053,814 |
107,810,899 |
|
16. Deferred corporate income tax |
0 |
0 |
|
|
17. Interest from subsidiaries/related companies |
0 |
0 |
|
|
18. Profit after tax |
234,134,389,144 |
113,454,161,441 |
508,251,379 |
|
|
||||
|
FINANCIAL RATIOS
AND AVERAGE INDUSTRY RATIOS |
||||
|
|
||||
|
Description |
FY2011 |
FY2010 |
FY2009 |
Average Industry |
|
Current liquidity ratio |
1.28 |
1.32 |
1.36 |
1.21 |
|
Quick liquidity ratio |
0.53 |
0.52 |
0.95 |
0.41 |
|
Inventory circle |
4.96 |
2.97 |
6.39 |
4.09 |
|
Average receive period |
43.90 |
67.74 |
111.37 |
35.22 |
|
Utilizing asset performance |
1.86 |
1.36 |
1.66 |
1.99 |
|
Liability by total assets |
63.80 |
70.83 |
63.73 |
64.75 |
|
Liability by owner's equity |
186.68 |
264.23 |
175.68 |
199.02 |
|
Ebit / Total assets (ROA) |
13.68 |
10.46 |
3.55 |
12.59 |
|
Ebit / Owner's equity (ROE) |
40.02 |
39.01 |
9.78 |
36.14 |
|
Ebit / Total revenue (NPM) |
7.35 |
7.71 |
2.14 |
6.48 |
|
Gross profit / Total revenue (GPM) |
10.32 |
11.11 |
4.22 |
12.11 |
|
Note: The Average Industry was calculated by VietnamCredit based on our own
statistical data |
||||
|
|
||||
PAYMENT HISTORY & PERFORMANCE EXPERIENCES
|
||
|
|
||
|
Trade Morality |
|
Fair |
|
Liquidity |
|
Medium |
|
Payment status |
|
Above Average |
|
Financial Situation |
|
Above Average |
|
Development trend |
|
Positive |
|
Litigation data |
|
No Record |
|
Bankruptcy |
|
No Record |
|
Payment Methods |
|
L/C, T/T, D/P |
|
|
|
Wholesaler |
|
Public opinion |
|
Good |
|
|
INTERPRETATION ON THE SCORES
|
|
|
|
The subject is founded
in 2002. Its precursor is Quang Minh Technological Development and Investment
Company Limited. In May, 2010, The subject changed type of business into
joint stock company. Since then, the subject has a new name "Quang Minh
Corporation Joint Stock Company". Currently, the subject has been
operating under the business registration No. 0101205275 (the same tax code),
granted by Department of Planning and Investment of Hanoi City. Its scales
are large with the chartered capital of VND 989 billion and the
employees of 1,000 people. The head office is located at Room 01 & 02, M floor,
Sofitel Plaza Hotel, At the beginning of
operation, the subject focuses on manufacturing and trading animal and
poultry feed, but now its main products are vegetable oils (brand name:
OilLa, Mr Bean, Soon Soon…) and agricultural products. In plant of 2012, the
company will manufacture 5,000 tons oil per month and 60,000 tons oil in this
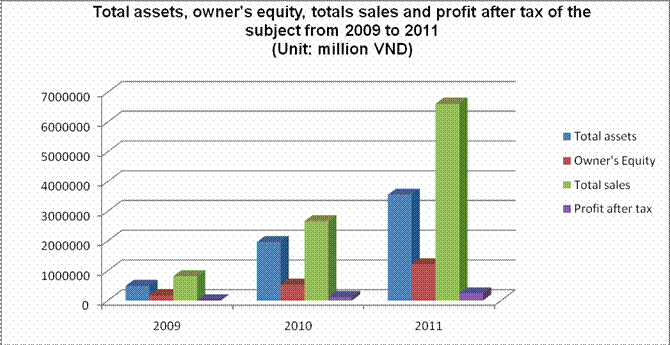
year, at the same time will export over 36,000 tons Financially, following is chart which shows total
sales, profit after tax, total assets and owner's equity of the subject from
2009 to 2011
The above chart shows that,
total assets, owner’s equity, total sales and profit after tax of the subject
increased strongly year by year. The total assets reached more than VND 3,551
billion in 2011 – up 81% in comparison with the year 2010. Specially, total sales of
subject reached VND 6,610 billion in 2011, increased strongly with 148%
against 2010. Profitability was good. Based on the financial ratios on recent year, we
see that, they were fairly good. The liquidity ratios have downtrend. But it
is still better than the average industry. In addition, inventories were high
to make the low quick liquidity ratio. Liability over total assets and
owner’s equity were improved, fell from 70.83% in 2010 to 63.8% in 2011 and
from 264.23% in 2010 to 186.68% in 2011. They were lower than average
industry ratios. Thus, its self financing and solvency are strongly. In 2011,
utilizing assets performance was very good, raised from 1.36 times in 2010 to
1.86 times in 2011 and better than other companies in this field. In general, the subject is a large sized company in the industry and the business activities are fairly good. It is capable for small and medium financial commitments. |
------------ APPENDIX ----------
INDUSTRY DATA
|
||||||
|
|
||||||
|
Industry code |
Growth speed by
price compared with 1994 (%) |
Total
enterprises 2010 |
Total employees
2011 (Thous.pers.) |
Annual average
capital of enterprises 2010 (billion dongs) |
||
|
2011 |
2010 |
|||||
|
Agriculture,
Forestry and Fishing |
4.00 |
2.78 |
8,887 |
24,362.9 |
95,227 |
|
|
Industry and
Construction |
5.53 |
7.70 |
95,217 |
10,718.9 |
3,641,376 |
|
|
Trade and
Services |
6.69 |
7.52 |
187,195 |
15,270.2 |
6,957,082 |
|
|
|
||||||
ECONOMIC INDICATORS
|
||||||
|
|
||||||
|
|
2011 |
2010 |
2009 |
|||
|
Population (Million person) |
87.84 |
86.93 |
86.02 |
|||
|
Gross Domestic Products (USD
billion) |
119 |
102.2 |
91 |
|||
|
GDP Growth (%) |
5.89 |
6.78 |
5.32 |
|||
|
GDP Per Capita
(USD/person/year) |
1,300 |
1,160 |
1,080 |
|||
|
Inflation (% Change in Composite
CPI) |
18.58 |
11.75 |
6.88 |
|||
|
State Budget Deficit compared
with GDP (%) |
4.9 |
5.8 |
6.9 |
|||
|
|
||||||
SERVICE TRADE PERFORMANCE
|
||||||
|
|
||||||
|
Billion USD |
2011 |
2010 |
2009 |
|||
|
Exports |
96.3 |
72.2 |
57.1 |
|||
|
Imports |
105.8 |
84.8 |
69.9 |
|||
|
Trade Balance |
-9.5 |
-12.6 |
-12.8 |
|||
Source: General
Statistics Office
FOREIGN EXCHANGE RATES
|
Currency |
Unit
|
Indian Rupees |
|
US Dollar |
1 |
Rs.53.59 |
|
|
1 |
Rs.85.81 |
|
Euro |
1 |
Rs.69.91 |
INFORMATION DETAILS
|
Report
Prepared by : |
PRL |
RATING EXPLANATIONS
|
RATING |
STATUS |
PROPOSED CREDIT LINE |
|
|
>86 |
Aaa |
Possesses an extremely sound financial base with the strongest capability
for timely payment of interest and principal sums |
Unlimited |
|
71-85 |
Aa |
Possesses adequate working capital. No caution needed for credit
transaction. It has above average (strong) capability for payment of interest
and principal sums |
Large |
|
56-70 |
A |
Financial & operational base are regarded healthy. General
unfavourable factors will not cause fatal effect. Satisfactory capability for
payment of interest and principal sums |
Fairly Large |
|
41-55 |
Ba |
Overall operation is considered normal. Capable to meet normal
commitments. |
Satisfactory |
|
26-40 |
B |
Capability to overcome financial difficulties seems comparatively
below average. |
Small |
|
11-25 |
Ca |
Adverse factors are apparent. Repayment of interest and principal sums
in default or expected to be in default upon maturity |
Limited with
full security |
|
<10 |
C |
Absolute credit risk exists. Caution needed to be exercised |
Credit not
recommended |
|
-- |
NB |
New Business |
-- |
This score serves as a reference to assess SC’s credit risk
and to set the amount of credit to be extended. It is calculated from a
composite of weighted scores obtained from each of the major sections of this report.
The assessed factors and their relative weights (as indicated through %) are as
follows:
Financial
condition (40%) Ownership
background (20%) Payment
record (10%)
Credit history
(10%) Market trend
(10%) Operational
size (10%)
This report is issued at your request without any risk
and responsibility on the part of MIRA INFORM PRIVATE LIMITED (MIPL) or its
officials.