MIRA
INFORM REPORT
|
Report Date : |
04.09.2012 |
IDENTIFICATION DETAILS
|
Name : |
ZI-TECHASIA SOLUTIONS
LTD. |
|
|
|
|
Registered Office : |
11th -12th Floor Ploenchit Center, 2 Sukhumvit Road, Klongtoey, Bangkok 10110 |
|
|
|
|
Country : |
Thailand |
|
|
|
|
Financials (as on) : |
31.12.2011 |
|
|
|
|
Date of Incorporation : |
1951 |
|
|
|
|
Com. Reg. No.: |
0105494000477 |
|
|
|
|
Legal Form : |
Private Limited Company |
|
|
|
|
Line of Business : |
Engaged in importing, distributing and servicing various kinds of industrial products, for various industries, such as paper, textile, wood, dairy etc. |
|
|
|
|
No. of Employees : |
90 |
RATING & COMMENTS
|
MIRA’s Rating : |
Ba |
|
RATING |
STATUS |
PROPOSED CREDIT LINE |
|
|
41-55 |
Ba |
Overall operation is considered normal. Capable to meet normal
commitments. |
Satisfactory |
|
Status : |
Satisfactory |
|
Payment Behaviour : |
No complaints |
|
Litigation : |
Clear |
NOTES :
Any query related to this report can be made
on e-mail: infodept@mirainform.com
while quoting report number, name and date.
ECGC Country Risk Classification List – March 31st, 2012
|
Country Name |
Previous Rating (31.12.2011) |
Current Rating (31.03.2012) |
|
Thailand |
B1 |
B1 |
|
Risk Category |
ECGC
Classification |
|
Insignificant |
A1 |
|
Low |
A2 |
|
Moderate |
B1 |
|
High |
B2 |
|
Very High |
C1 |
|
Restricted |
C2 |
|
Off-credit |
D |
-
ECONOMIC OVERVIEW
With a well-developed infrastructure, a free-enterprise economy,
generally pro-investment policies, and strong export industries, Thailand enjoyed
solid growth from 2000 to 2007 - averaging more than 4% per year - as it
recovered from the Asian financial crisis of 1997-98. Thai exports - mostly
machinery and electronic components, agricultural commodities, and jewelry -
continue to drive the economy, accounting for more than half of GDP. The global
financial crisis of 2008-09 severely cut Thailand's exports, with most sectors
experiencing double-digit drops. In 2009, the economy contracted 2.3%. In 2010,
Thailand's economy expanded 7.8%, its fastest pace since 1995, as exports
rebounded from their depressed 2009 level. Steady economic growth at just below
4% during the first three quarters of 2011 was interrupted by historic flooding
in October and November in the industrial areas north of Bangkok, crippling the
manufacturing sector and leading to a revised growth rate of only 0.1% for the
year. The industrial sector is poised to recover from the second quarter of
2012 onward, however, and the government anticipates the economy will probably
grow between 5.5 and 6.5% for 2012, while private sector forecasts range
between 3.8% and 5.7%.
Source
: CIA
Company name
ZI-TECHASIA
SOLUTIONS LTD.
[ FORMER
: F.E. ZUELLIG [BANGKOK]
LIMITED ]
SUMMARY
BUSINESS
ADDRESS : 11th -12th FLOOR PLOENCHIT
CENTER,
2 SUKHUMVIT
ROAD, KLONGTOEY,
BANGKOK 10110,
THAILAND
TELEPHONE : [66]
2656-8710-54
FAX : [66] 2656-8767-9,
2656-8704
E-MAIL
ADDRESS : mtinfo@zi-th.com
REGISTRATION
ADDRESS : SAME AS
BUSINESS ADDRESS
ESTABLISHED : 1951
REGISTRATION
NO. : 0105494000477
TAX
ID NO. : 3101068221
CAPITAL
REGISTERED : BHT.
82,000,000
CAPITAL
PAID-UP : BHT.
25,000,000
SHAREHOLDER’S PROPORTION : THAI : 0.02%
FOREIGN :
99.98%
FISCAL
YEAR CLOSING DATE : DECEMBER 31
LEGAL
STATUS : PRIVATE LIMITED
COMPANY
EXECUTIVE : MR. WILLIAM STUART
MCARTHUR, AMERICAN
CHIEF EXECUTIVE
OFFICER
NO.
OF STAFF : 90
LINES
OF BUSINESS : PERFORMING,
HOLDING AND MANAGEMENT
FUNCTIONS
FOR THE GROUP
AS WELL AS
IMPORTER AND DISTRIBUTOR
OF ZUELLIG INDUSTRIAL
PRODUCTS
CORPORATE PROFILE
OPERATING
TREND : STABLE
PRESENT
SITUATION : OPERATING
NORMALLY
REPUTATION
: GOOD
FOR NORMAL BUSINESS
ENGAGEMENT
MANAGEMENT
STANDARD : MANAGEMENT
WITH GOOD PERFORMANCE
HISTORY
The subject was
initially established on April
5, 1951 as
a private limited
company under the
name style F.E. ZUELLIG [BANGKOK]
LIMITED. It was
set up as
a part of the Zuellig
Group of Companies,
a diversified services,
trading and manufacturing
group with a
strong presence in
the Asia-Pacific region.
The Zuellig Group
traces its history
back to the
early years of
the century, when
Dr. Frederick E.
Zuellig became a
partner in a
Swiss trading house in
Manila. In Thailand,
Zuellig and its
affiliates employ over 1,000
people. The subject
is the local
operation of a
privately-owned Swiss company,
which has been in
Thailand since 1949.
The subject is
an independent unit
within the Zuellig
Group of Companies, performing
holding and management
functions for the Group and
has its own
operating units, Zuellig
Industrial and Zuellig
Agro.
In September 2001 the Zuellig Agro Division
was separated its operation
from the subject
and was setup
to be the
new company “Fezagro
Co., Ltd.”, therefore
the subject became
to operate as
the industrial products
business.
On March 1, 2005, the subject’s name was
changed to ZI-TECHASIA
SOLUTIONS LTD., as
well as becoming
a member of
the Interpacific group.
However, the subject
is currently a
subsidiary of Inter
Ocean Holdings Group [BVI]
Limited. It currently
employs approximate 90
staff.
The subject achieved
the standard ISO
9001 certification by
SGS [Thailand] Ltd.,
in September 1999.
The subject’s registered
address is 11th - 12th Floor,
Ploenchit Center, 2
Sukhumvit Rd., Klongtoey,
Bangkok 10110, and this
is the company’s current
operation address.
THE BOARD
OF DIRECTORS
|
Name |
|
Nationality |
Age |
|
|
|
|
|
|
Mr. Winyard Chindaprasert |
|
Thai |
59 |
|
Dr. Daniel Christian
Zuellig |
|
Filipino |
51 |
|
Mr. William Stuart
Mcarthur |
|
American |
61 |
|
Mr. Volker Braun |
|
German |
47 |
AUTHORIZED PERSON
Two of the above
directors can jointly sign
on behalf of the subject
with the company’s affixed.
MANAGEMENT
Mr. William Stuart
Mcarthur is the
Chief Executive Officer.
He is American
nationality with the
age of 61
years old.
Mr. Volker Braun is the General
Manager, Sales and
Marketing Director.
He is German
nationality with the
age of 47
years.
BUSINESS OPERATIONS
The subject is
engaged in importing,
distributing and servicing
various kinds of industrial
products, for various industries, such as paper, textile, wood, dairy, confectionery, bakery,
beverage, noodle, seafood,
snack foods and
etc. Its products
are divided into
5 product groups
as follows:
1. Machinery & Spare Parts: Brand: “HABASIT”
-
Power
transmission belt
-
Spindle
tapes
-
Polycord
round belts
-
Folder-gluer
belts
-
High
duty conveyor belts
-
Machine
tapes
-
Timing belts
-
PVC/ PU
conveyor belt
-
Slat
and conveyor chains
-
Tools
-
etc.
2. Tools:
Brands “PFERD”, “HELLER”,
“G-MAN” and “FELCO”
-
Cutting
and grinding wheels
-
Polifan
-
Files
-
Tungsten
carbide burrs
-
HSS
rotary cutters
-
Mounted
points
-
Fan grinders
-
Abrasive
bands and drum
sanders
-
Brushes
-
SDS-plus
hammer bits
-
Masonry bits
-
HSS
twist drill
-
SDS max hammer
bits
-
Handsaws
and saw blades
-
Hand tools
-
Locking
pliers
-
Gas welding
& cutting, pressure regulators
-
etc.
3. Industrial and
Specialty Chemicals:
-
Mild
surfactants, betaine, amphoacetate
-
Surfactants/Household products
-
Emollients/Emulsifiers
-
Active
Ingredients
-
Silicone
surfactants
-
Fragrances
-
Polyurethane
-
Preservatives
-
Phytosphingosine
-
UV absorber
-
Surfactant
blends
-
etc.
4.
Water
Technologies:
Treatment
Chemicals
-
Conductivity,
Resistivity Meter/Controller
-
Automatic control
of cooling tower
water treatment
-
Chemical
controlling systems
-
Cleaning
chemicals
-
Maintenance
chemicals
-
Treatment
chemicals
-
Boiler
treatment
-
Pump system
-
Membrane
-
5. Foods &
Fine Ingredients:
-
Flavours
-
Food
additives
-
Herbal
and fruit extracts
-
Tea & herbal
extracts
-
Emulsifiers
-
Enzymes
-
Cocoa powder
-
Specialty
fats
-
Caramel
color
-
Food color
-
Skim
milk powder
-
etc.
Subject also
provides installation and
maintenance services for
machinery and tools.
IMPORT [COUNTRIES]
Most of its
products are imported
from Switzerland, Germany,
Italy, France, United States of America,
Spain, Sweden, India,
Republic of China,
Japan, Taiwan, Malaysia
and etc.
MAJOR SUPPLIERS
|
Name |
Country |
|
|
|
|
- ABB Limited |
: United States of America |
|
- ABB [Thailand] Ltd. |
: Thailand |
|
- Firmenich |
: Switzerland |
|
- Habasit |
: Switzerland |
|
- Rueggerberg |
: Germany |
|
- Rockwell Automation |
: Germany |
|
- T.H. Goldschmidt AG. |
: Germany |
SALES [LOCAL]
100% of its
products is sold
locally to manufacturers, wholesalers
and end-users.
SUBSIDIARIES & AFFILIATED
COMPANY
The subject is
not found to
have any subsidiary
or affiliated company
here in Thailand.
ZI-Techasia Solutions Ltd. is
a member of the
Interpacific Group of Companies, operating in
the following countries:
Philippines Established in
1908
Switzerland ” ”
1924
United States of
America ” ” 1935
Singapore ” ”
1939
Malaysia ” ”
1939
Thailand ” ”
1949
Guam ” ”
1967
Indonesia ” ”
1971
Australia ” ”
1971
LITIGATION
Bankruptcy and Receivership
There are no
litigation on bankruptcy
and receivership cases
filed against the
subject found at
Legal Execution Department
for the past
five years.
Others
There are no
legal suits filed
against the subject
according the past
two years.
CREDIT
Local bills are paid by cash or
on the credits
term of 30-60
days.
Imports are by
L/C at sight
or T/T on
negotiated term.
Sales are by
cash or on
the credits term
of 30-60 days.
BANKING
Hongkong & Shanghai
Banking Corporation
[Bangkok Branch :
968 Rama 4
Rd., Silom, Bangrak,
Bangkok 10500]
Credit Agricole Corporate
and Investment Bank
[Bangkok Branch :
152 Wireless Rd.,
Lumpini, Pathumwan, Bangkok
10330]
Kasikornbank Public Co.,
Ltd.
[Head Office
: 1 Kasikorn
Lane, Rajburana Rd.,
Rajburana, Bangkok 10140]
EMPLOYMENT
The subject employs
approximately 90 staff
[office and sales staff].
LOCATION DETAILS
The premise is
rented for administrative office at
the heading address. Premise
is located in
commercial area.
Warehouse is
located in Minburi
district, Bangkok.
COMMENT
The company has
earned a distinguished
reputation for its
marketing, distribution and
manufacturing activities in
Thailand in catering
to the country’s
agricultural, healthcare and
industrial sectors for decades.
As well the company has contributed
towards the country’s economic program
and prosperity.
More than 60
years operations in Thailand
has enabled the
company to develop
a combination of world-class expertise and local experience fuels the
efficiency of Thailand’s industrial production plants, boosting their
productivity and strengthening their competitive positions in
both domestic and
international marketplace.
FINANCIAL INFORMATION
The capital was
initially registered at
Bht. 3,000,000 divided
into 3,000 shares
of Bht. 1,000 each
with fully paid.
On December 27, 1995,
the capital was
increased to Bht. 82,000,000 divided into
82,000 shares of
Bht. 1,000 each, with
the current capital
paid-up at Bht.
25,000,000.
THE SHAREHOLDERS LISTED WERE
[as at April
27, 2012] at Bht.
25,000,000 of capitalization.
|
NAME |
HOLDING |
% |
|
|
|
|
|
Inter Ocean Holdings
Group [BVI] Limited Nationality: BVI Address : Road
Town, Tortola, British
Virgin Islands |
81,974 |
99.96 |
|
Mr. William Stuart
Mcarthur Nationality: American Address : 60
Soi Langsuan, Lumpinee,
Pathumwan, Bangkok |
13 |
0.02 |
|
Mr. Winyard Chindaprasert Nationality: Thai Address : 6
Pattanakarn 54 Rd.,
Suanluang,
Suanluang, Bangkok |
13 |
0.02 |
Total Shareholders : 3
Share Structure [as
at April 27,
2012]
|
Nationality |
Shareholders |
No. of Share |
% Shares |
|
|
|
|
|
|
Thai |
1 |
13 |
0.02 |
|
Foreign |
2 |
81,987 |
99.98 |
|
Total |
3 |
82,000 |
100.00 |
NAME OF AUDITOR
& CERTIFIED PUBLIC
ACCOUNTANT NO.:
Ms. Suleeporn
Treeyaprasertporn No. 5236
BALANCE SHEET [BAHT]
The
latest financial figures
published for December
31, 2011 &
2010 were:
ASSETS
|
Current Assets |
2011 |
2010 |
|
|
|
|
|
Cash in Hand
& at Bank |
14,328,881 |
9,493,746 |
|
Trade Accounts Receivable |
200,286,067 |
202,325,102 |
|
Related Company Receivable |
1,886,717 |
1,489,119 |
|
Inventories |
158,150,323 |
133,757,584 |
|
Deferred Income |
2,058,951 |
1,777,218 |
|
Prepaid Expenses |
1,037,677 |
1,542,173 |
|
Other Current Assets
|
2,406,387 |
2,874,175 |
|
|
|
|
|
Total Current Assets
|
380,155,003 |
353,259,117 |
|
Investment in Other
Companies |
189,110 |
189,110 |
|
Building & Equipment
Improvement |
13,290,002 |
12,855,026 |
|
Intangible Assets |
1,984,925 |
18,793 |
|
Other Non-current Assets |
3,193,905 |
3,598,905 |
|
Total Assets |
398,812,945 |
369,920,951 |
LIABILITIES &
SHAREHOLDERS' EQUITY [BAHT]
|
Current
Liabilities |
2011 |
2010 |
|
|
|
|
|
Short-term Loan from
Financial Institution |
10,000,000 |
- |
|
Trade Accounts Payable |
121,454,195 |
128,636,519 |
|
Other Payable |
5,430,396 |
5,072,661 |
|
Related Company Payable |
15,894,884 |
2,494,904 |
|
Accrued Income Tax |
2,178,699 |
8,285,557 |
|
Accrued Expenses |
12,673,901 |
10,827,741 |
|
Other Current Liabilities |
785,188 |
3,487,823 |
|
|
|
|
|
Total Current Liabilities |
168,417,263 |
158,805,205 |
|
Obligation for Employees
Benefit |
14,419,494 |
11,459,722 |
|
Total Liabilities |
182,836,757 |
170,264,927 |
|
|
|
|
|
Shareholders' Equity |
|
|
|
|
|
|
|
Share capital : Baht 1,000
par value Authorized &
issued share capital
82,000 shares |
82,000,000 |
82,000,000 |
|
|
|
|
|
Capital Paid |
25,000,000 |
25,000,000 |
|
Retained Earning Appropriated for Statutory Reserve |
8,200,000 |
8,200,000 |
|
Unappropriated |
182,776,188 |
166,456,024 |
|
Total Shareholders' Equity |
215,976,188 |
199,656,024 |
|
Total Liabilities & Shareholders' Equity |
398,812,945 |
369,920,951 |
PROFIT & LOSS ACCOUNT
|
Revenue |
2011 |
2010 |
|
|
|
|
|
Sales & Service Income |
827,078,909 |
802,287,929 |
|
Other Income |
9,083,608 |
6,726,438 |
|
Total Revenues |
836,162,517 |
809,014,367 |
|
Expenses |
|
|
|
|
|
|
|
Cost of Goods
Sold & Service
|
629,770,257 |
607,937,156 |
|
Selling Expenses |
107,528,796 |
100,057,138 |
|
Administrative Expenses |
72,673,652 |
62,774,423 |
|
Total Expenses |
809,972,705 |
770,768,717 |
|
|
|
|
|
Profit before Financial
Cost & Income Tax |
26,189,812 |
38,245,650 |
|
Financial Cost |
[938,168] |
- |
|
Profit before Income Tax |
25,251,644 |
38,245,650 |
|
Income Tax |
[8,931,480] |
[11,478,471] |
|
|
|
|
|
Net Profit / [Loss] |
16,320,164 |
26,767,179 |
FINANCIAL ANALYSIS
|
ITEM |
UNIT |
2011 |
2010 |
|
|
|
|
|
|
LIQUIDITY RATIO |
|
|
|
|
CURRENT RATIO |
TIMES |
2.26 |
2.22 |
|
QUICK RATIO |
TIMES |
1.29 |
1.34 |
|
|
|
|
|
|
ACTIVITY RATIO |
|
|
|
|
FIXED ASSETS TURNOVER |
TIMES |
62.23 |
62.41 |
|
TOTAL ASSETS TURNOVER |
TIMES |
2.07 |
2.17 |
|
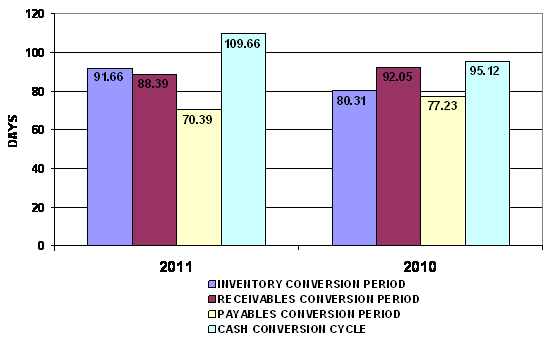
INVENTORY CONVERSION PERIOD |
DAYS |
91.66 |
80.31 |
|
INVENTORY TURNOVER |
TIMES |
3.98 |
4.55 |
|
RECEIVABLES CONVERSION PERIOD |
DAYS |
88.39 |
92.05 |
|
RECEIVABLES TURNOVER |
TIMES |
4.13 |
3.97 |
|
PAYABLES CONVERSION PERIOD |
DAYS |
70.39 |
77.23 |
|
CASH CONVERSION CYCLE |
DAYS |
109.66 |
95.12 |
|
|
|
|
|
|
PROFITABILITY
RATIO |
|
|
|
|
COST OF GOODS SOLD |
% |
76.14 |
75.78 |
|
SELLING & ADMINISTRATION |
% |
21.79 |
20.30 |
|
INTEREST |
% |
0.11 |
- |
|
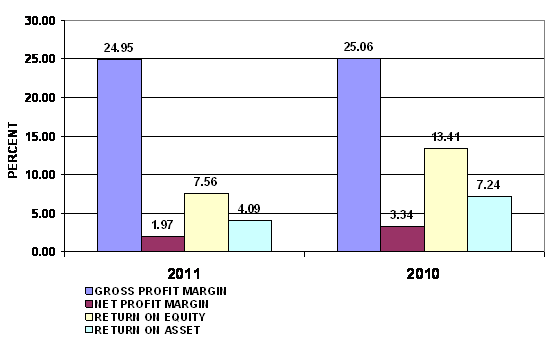
GROSS PROFIT MARGIN |
% |
24.95 |
25.06 |
|
NET PROFIT MARGIN BEFORE EX. ITEM |
% |
3.17 |
4.77 |
|
NET PROFIT MARGIN |
% |
1.97 |
3.34 |
|
RETURN ON EQUITY |
% |
7.56 |
13.41 |
|
RETURN ON ASSET |
% |
4.09 |
7.24 |
|
EARNING PER SHARE |
BAHT |
652.81 |
1,070.69 |
|
|
|
|
|
|
LEVERAGE RATIO |
|
|
|
|
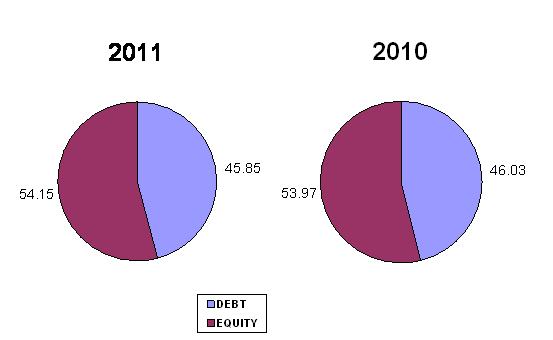
DEBT RATIO |
TIMES |
0.46 |
0.46 |
|
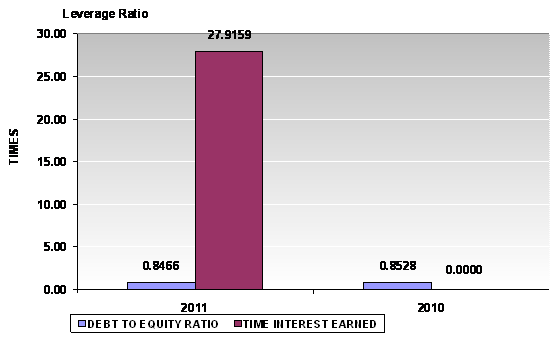
DEBT TO EQUITY RATIO |
TIMES |
0.85 |
0.85 |
|
TIME INTEREST EARNED |
TIMES |
27.92 |
- |
|
|
|
|
|
|
ANNUAL GROWTH |
|
|
|
|
SALES GROWTH |
% |
3.09 |
|
|
OPERATING PROFIT |
% |
(31.52) |
|
|
NET PROFIT |
% |
(39.03) |
|
|
FIXED ASSETS |
% |
3.38 |
|
|
TOTAL ASSETS |
% |
7.81 |
|
PROFITABILITY
RATIO
|
Gross Profit Margin |
24.95 |
Impressive |
Industrial Average |
19.71 |
|
Net Profit Margin |
1.97 |
Satisfactory |
Industrial
Average |
2.12 |
|
Return on Assets |
4.09 |
Impressive |
Industrial
Average |
3.30 |
|
Return on Equity |
7.56 |
Impressive |
Industrial
Average |
7.27 |
Gross Profit Margin used to assess a firm's financial health by
revealing the proportion of money left over from revenues after accounting for
the cost of goods sold. Gross profit margin serves as the source for paying
additional expenses and future savings. The
company’s figure is 24.95%. When
compared with the industry average, the ratio of the company was higher, this
indicated that company was more profitable than the same industry.
Net Profit Margin is the indicator of the company's efficiency in that
net profit takes into consideration all expenses of the company. A low profit
margin indicates a low margin of safety, higher risk that a decline in sales
will erase profits and result in a net loss. The company's figure is 1.97%.
When compared with the industry average, the ratio of the company was lower.
Return on Assets measures how efficiently profits are being generated
from the assets employed in the business when compared with the ratios of firms
in a similar business. A low ratio in comparison with industry averages
indicates an inefficient use of business assets. Return on Assets ratio is
4.09%, higher figure when compared with those of its average competitors in the
same industry, indicated that business was an efficient profit in a dominant position within its industry.
Return on Equity indicates how profitable a company is by comparing its
net income to its average shareholders' equity, ROE measures how much the
shareholders earned for their investment in the company. Return on Equity ratio
is 7.56%, higher figure when compared with those of its average competitors in
the same industry, indicated that business was an efficient profit in a dominant position within its industry.
Trend of the
average competitors in the same industry for last 5 years
Return on Assets Downtrend
Return on Equity Downtrend
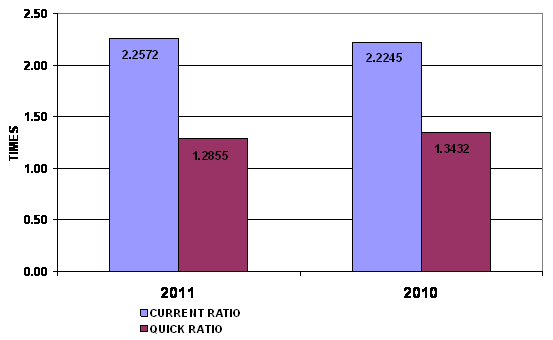
LIQUIDITY RATIO
|
Current Ratio |
2.26 |
Impressive |
Industrial
Average |
1.73 |
|
Quick Ratio |
1.29 |
|
|
|
|
Cash Conversion Cycle |
109.66 |
|
|
|
The Current Ratio is to ascertain whether a company's short-term assets
are readily available to pay off its short-term liabilities. The company's
figure is 2.26 times in 2011, increased from 2.22 times, then it is generally
considered to have good short-term financial strength. When compared with the
industry average, the ratio of the company was higher, indicated that company
was an efficient operator in a dominant position within its industry.
The Quick Ratio is a liquidity indicator that further refines the
current ratio by measuring the amount of the most liquid current assets there
are to cover current liabilities. The company's figure is 1.29 times in 2011,
decreased from 1.34 times, although excluding inventory so the company still
have good short-term financial strength.
The Cash Conversion Cycle measures the number of days a company's cash
is tied up in the production and sales process of its operations and the
benefit from payment terms from its creditors. It meant the company could
survive when no cash inflow was received from sale for 110 days.
Trend of the
average competitors in the same industry for last 5 years
Current Ratio Uptrend
LEVERAGE RATIO
|
Debt Ratio |
0.46 |
Impressive |
Industrial
Average |
0.54 |
|
Debt to Equity Ratio |
0.85 |
Impressive |
Industrial
Average |
1.22 |
|
Times Interest Earned |
27.92 |
Impressive |
Industrial
Average |
4.00 |
Debt to Equity Ratio a measurement of how much suppliers, lenders, creditors
and obligors have committed to the company versus what the shareholders have
committed. A lower the percentage means that the company is using less leverage
and has a stronger equity position.
Times Interest Earned measuring a company's ability to meet its debt
obligations. Ratio is 27.92 higher than 1, so the company can pay interest
expenses on outstanding debt.
Debt Ratio shows the proportion of a company's assets which are financed
through debt. The company's figure is 0.46 less than 0.5, most of the company's
assets are financed through equity.
Trend of the
average competitors in the same industry for last 5 years
Debt Ratio Downtrend
Times Interest Earned Uptrend
ACTIVITY RATIO
|
Fixed Assets Turnover |
62.23 |
Impressive |
Industrial
Average |
6.76 |
|
Total Assets Turnover |
2.07 |
Impressive |
Industrial
Average |
1.53 |
|
Inventory Conversion Period |
91.66 |
|
|
|
|
Inventory Turnover |
3.98 |
Impressive |
Industrial
Average |
3.48 |
|
Receivables Conversion Period |
88.39 |
|
|
|
|
Receivables Turnover |
4.13 |
Satisfactory |
Industrial
Average |
4.47 |
|
Payables Conversion Period |
70.39 |
|
|
|
Trend of the
average competitors in the same industry for last 5 years
Fixed Assets Turnover Downtrend
Total Assets Turnover Downtrend
Inventory Turnover Downtrend
Receivables Turnover Downtrend
FOREIGN EXCHANGE RATES
|
Currency |
Unit
|
Indian Rupees |
|
US Dollar |
1 |
Rs.55.45 |
|
|
1 |
Rs.87.98 |
|
Euro |
1 |
Rs.69.69 |
INFORMATION DETAILS
|
Report Prepared
by : |
PDT |
RATING EXPLANATIONS
|
RATING |
STATUS |
PROPOSED CREDIT LINE |
|
|
>86 |
Aaa |
Possesses an extremely sound financial base with the strongest capability
for timely payment of interest and principal sums |
Unlimited |
|
71-85 |
Aa |
Possesses adequate working capital. No caution needed for credit
transaction. It has above average (strong) capability for payment of interest
and principal sums |
Large |
|
56-70 |
A |
Financial & operational base are regarded healthy. General
unfavourable factors will not cause fatal effect. Satisfactory capability for
payment of interest and principal sums |
Fairly Large |
|
41-55 |
Ba |
Overall operation is considered normal. Capable to meet normal
commitments. |
Satisfactory |
|
26-40 |
B |
Capability to overcome financial difficulties seems comparatively
below average. |
Small |
|
11-25 |
Ca |
Adverse factors are apparent. Repayment of interest and principal sums
in default or expected to be in default upon maturity |
Limited with
full security |
|
<10 |
C |
Absolute credit risk exists. Caution needed to be exercised |
Credit not
recommended |
|
-- |
NB |
New Business |
-- |
This score serves as a reference to assess SC’s credit risk
and to set the amount of credit to be extended. It is calculated from a composite
of weighted scores obtained from each of the major sections of this report. The
assessed factors and their relative weights (as indicated through %) are as
follows:
Financial
condition (40%) Ownership
background (20%) Payment
record (10%)
Credit history
(10%) Market trend
(10%) Operational
size (10%)
This report is issued at your request without any
risk and responsibility on the part of MIRA INFORM PRIVATE LIMITED (MIPL)
or its officials.