MIRA
INFORM REPORT
|
Report Date : |
11.09.2012 |
IDENTIFICATION DETAILS
|
Name : |
MASTROTTO BRASIL SA |
|
|
|
|
Formerly Known As : |
MASTROTTO REICHERT S/A |
|
|
|
|
Registered Office : |
Rodovia Br 101, S/Nº. Km 201 – Capoeiruçú, Zip Code 44300-000 -
Cachoeira/Ba |
|
|
|
|
Country : |
Brazil |
|
|
|
|
Financials (as on) : |
31.12.2011 |
|
|
|
|
Date of Incorporation : |
24.06.1999 |
|
|
|
|
Com. Reg. No.: |
Not Available |
|
|
|
|
Legal Form : |
Privately Held Corporation |
|
|
|
|
Line of Business : |
Tanning and dressing of leather |
|
|
|
|
No. of Employees : |
550 employees |
RATING & COMMENTS
|
MIRA’s Rating : |
Ba |
|
RATING |
STATUS |
PROPOSED CREDIT LINE |
|
|
41-55 |
Ba |
Overall operation is considered normal. Capable to meet normal
commitments. |
Satisfactory |
|
Status : |
Satisfactory |
|
Payment Behaviour : |
No Complaints |
|
Litigation : |
Clear |
NOTES:
Any query related to this report can be made
on e-mail: infodept@mirainform.com
while quoting report number, name and date.
ECGC Country Risk Classification List – March 31st, 2012
|
Country Name |
Previous Rating (31.12.2011) |
Current Rating (31.03.2012) |
|
Brazil |
A2 |
A2 |
|
Risk Category |
ECGC
Classification |
|
Insignificant |
A1 |
|
Low |
A2 |
|
Moderate |
B1 |
|
High |
B2 |
|
Very High |
C1 |
|
Restricted |
C2 |
|
Off-credit |
D |
BRAZIL - ECONOMIC OVERVIEW
Characterized by large and well-developed agricultural, mining, manufacturing, and service sectors, Brazil's economy outweighs that of all other South American countries, and Brazil is expanding its presence in world markets. Since 2003, Brazil has steadily improved its macroeconomic stability, building up foreign reserves, and reducing its debt profile by shifting its debt burden toward real denominated and domestically held instruments. In 2008, Brazil became a net external creditor and two ratings agencies awarded investment grade status to its debt. After strong growth in 2007 and 2008, the onset of the global financial crisis hit Brazil in 2008. Brazil experienced two quarters of recession, as global demand for Brazil's commodity-based exports dwindled and external credit dried up. However, Brazil was one of the first emerging markets to begin a recovery. In 2010, consumer and investor confidence revived and GDP growth reached 7.5%, the highest growth rate in the past 25 years. Rising inflation led the authorities to take measures to cool the economy; these actions and the deteriorating international economic situation slowed growth to 2.7% for 2011 as a whole, though forecasts for 2012 growth are somewhat higher. Despite slower growth in 2011, Brazil overtook the United Kingdom as the world's seventh largest economy in terms of GDP. Urban unemployment is at the historic low of 4.7% (December 2011), and Brazil's traditionally high level of income equality has declined for each of the last 12 years. Brazil's high interest rates make it an attractive destination for foreign investors. Large capital inflows over the past several years have contributed to the appreciation of the currency, hurting the competitiveness of Brazilian manufacturing and leading the government to intervene in foreign exchanges markets and raise taxes on some foreign capital inflows. President Dilma ROUSSEFF has retained the previous administration's commitment to inflation targeting by the central bank, a floating exchange rate, and fiscal restraint.
|
Source : CIA |
Company name
MASTROTTO BRASIL
S/A
company ADDRESSES
|
MAIN ADDRESS: |
RODOVIA BR 101, S/Nº. KM 201 - CAPOEIRUÇÚ |
|
ZIP CODE/CITY: |
44300-000 - CACHOEIRA/BA |
|
|
|
|
PHONE: |
75 3425-8888 |
|
FAX: |
75 3425-8877 |
|
E-MAIL: |
|
|
WEB SITE: |
|
BRANCHES: |
|
NOT AVAILABLE |
LEGAL DATA
|
MAIN ACTIVITIES: |
|
TANNING AND DRESSING OF LEATHER |
|
LEGAL FORM: |
PRIVATELY
HELD CORPORATION |
|
|
|
|
INCORPORATION DATE: |
24/06/1999 |
|
REGISTER DATE: |
24/06/1999 |
|
BALANCE SHEET FILING DATE: |
31/12 |
|
TAX CONTRIBUTOR NUMBER(CNPJ): |
03.384.037/0001-59 |
|
STATE REGISTER: |
52.014.783 |
|
|
|
|
SHARE CAPITAL: |
R$ 73.500.000,00 |
|
LAST REGISTER OF CAPITAL: |
31/12/2006 |
|
BOARD OF
DIRECTORS: |
|
|
|
|
|
CESAR GUILHERME SCHIRMER |
DIRECTOR |
|
GRAZIANO MASTROTTO |
DIRECTOR |
|
SANTO MASTROTTO |
DIRECTOR |
|
BUENO MASTROTTO |
DIRECTOR |
|
CARLOS DONIVAM TEIXEIRA OLIVEIRA |
DIRECTOR |
AUTHORIZED USE OF SIGNATURE
|
THE DIRECTORS ARE AUTHORIZED TO SIGN ON BEHALF OF THE COMPANY. |
|
SHAREHOLDERS /
PARTNERS: |
|
|
|
|
|
CONCERIA MASTROTTO S.P.A. |
79,59% |
|
COMITALIA COMPAGNIA FIDUCIARIA SPA |
20,41% |
|
AFFILIATES /
SUBSIDIARIES: |
|
|
|
|
|
REICHERT AGROPECUARIA LTDA |
99,90% |
|
CALÇADOS REIFER LTDA |
92,20% |
|
FCC FORNECEDORA COMPONENTES QUIMICOS |
45,00% |
|
PARS PARTICIPAÇÕES LTDA |
25,00% |
|
INJECT IND. DE INJETADOS LTDA |
18,20% |
COMPANY'S BACKGROUND
|
THE SUBJECT WAS ESTABLISHED ON JUNE 24, 1999 AS MASTROTTO REICHERT S/A.
TO BE ENGAGED IN THE SAID LINE OF BUSINESS. ON OCTOBER 30, 2009 IT ADOPTED
THE ABOVE-MENTIONED NAME. TRADE NAME: "MASTROTTO BRASIL". FURTHER DETAILS ARE SO FAR NOT KNOWN. |
|
PUBLIC
INFORMATION: |
|
PROTESTS: |
|
4 PROTESTS,TOTAL AMOUNT R$ 10.708,00 |
|
DETAILS OF LATEST PROTESTS: |
|
NOTARY OFFICE: |
DATE: |
VALUE: |
|
1º CARTÓRIO DE BA-CACHOEIRA |
28/06/2012 |
R$ 4.436,00 |
|
1º CARTÓRIO DE BA-CACHOEIRA |
28/06/2012 |
R$ 836,00 |
|
1º CARTÓRIO DE BA-CACHOEIRA |
28/06/2012 |
R$ 4.436,00 |
|
1º CARTÓRIO DE BA-SÃO FELIX |
02/09/2011 |
R$ 1.000,00 |
FINANCIAL INFORMATION
|
GENERAL BALANCE SHEETS AS OF 31/12/2011, 31/12/2010 AND 31/12/2009. |
|
( FIGURES ARE IN THOUSANDS OF REAIS ). |
|
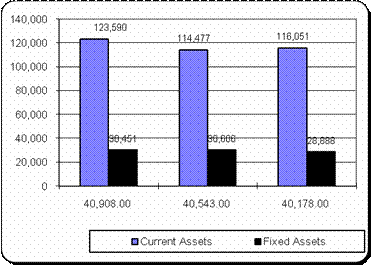
ASSETS |
|
|
|
|
CURRENT: |
31/12/2011 |
31/12/2010 |
31/12/2009 |
|
|
|
|
|
|
CASH AND BANKS |
2.998 |
21.227 |
28.032 |
|
CLIENTS |
28.339 |
13.018 |
15.543 |
|
INVENTORY |
58.526 |
51.644 |
53.396 |
|
RECOVERABLE TAXES |
23.251 |
19.962 |
13.908 |
|
DISCOUNTED EXPORT RECEIVABLES |
5.055 |
5.898 |
|
|
DEFERRED TAXES |
|
|
1.234 |
|
OTHER CREDITS |
5.421 |
2.728 |
3.938 |
|
|
---------------- |
---------------- |
---------------- |
|
TOTAL CURRENT ASSETS |
123.590 |
114.477 |
116.051 |
|
LONG-TERM
RECEIVABLES: |
|
|
|
|
|
|
|
|
|
RECOVERABLE TAXES |
27.844 |
15.136 |
24.782 |
|
DEFERRED TAXES |
830 |
2.282 |
1.091 |
|
OTHER CREDITS |
315 |
266 |
|
|
|
---------------- |
---------------- |
---------------- |
|
TOTAL LONG-TERM RECEIVABLES |
28.989 |
17.684 |
25.873 |
|
FIXED ASSETS: |
|
|
|
|
|
|
|
|
|
FIXED ASSETS |
30.244 |
30.463 |
28.786 |
|
INTANGIBLE |
207 |
143 |
102 |
|
|
---------------- |
---------------- |
---------------- |
|
TOTAL FIXED ASSETS |
30.451 |
30.606 |
28.888 |
|
|
================ |
================ |
================ |
|
TOTAL ASSETS |
183.030 |
162.767 |
170.812 |
|
LIABILITIES: |
|
|
|
|
CURRENT: |
31/12/2011 |
31/12/2010 |
31/12/2009 |
|
|
|
|
|
|
SUPPLIERS |
11.229 |
9.311 |
15.440 |
|
LOANS AND FINANCING |
25.073 |
6.752 |
15.793 |
|
TAXES & CONTRIBUTIONS |
741 |
62 |
358 |
|
DIVIDENDS |
13.573 |
25.496 |
22.145 |
|
COMMISSIONS DUE |
1.035 |
1.237 |
1.550 |
|
LABOR OBLIGATIONS |
1.934 |
1.480 |
1.405 |
|
OTHER DEBTS |
1.713 |
775 |
1.634 |
|
|
---------------- |
---------------- |
---------------- |
|
TOTAL CURRENT LIABILITIES |
55.298 |
45.113 |
58.325 |
|
LONG TERM
LIABILITIES: |
|
|
|
|
|
|
|
|
|
PROVISION FOR CONTINGENCIES |
498 |
399 |
326 |
|
TRIBUTARY OBLIGATIONS |
818 |
|
|
|
|
---------------- |
---------------- |
---------------- |
|
TOTAL LONG TERM LIABILITIES |
1.316 |
399 |
326 |
|
NET EQUITY: |
|
|
|
|
|
|
|
|
|
SHARE CAPITAL |
73.500 |
73.500 |
73.500 |
|
CAPITAL RESERVES |
9.756 |
9.756 |
9.756 |
|
PROFIT RESERVES |
43.160 |
33.999 |
28.905 |
|
|
---------------- |
---------------- |
---------------- |
|
TOTAL NET EQUITY |
126.416 |
117.255 |
112.161 |
|
|
================ |
================ |
================ |
|
TOTAL LIABILITIES |
183.030 |
162.767 |
170.812 |
|
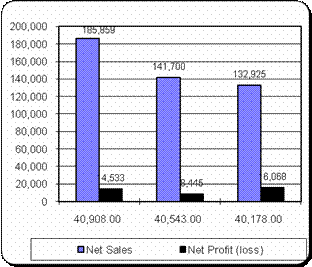
PROFIT AND LOSS ACCOUNTS AS OF 31/12/2011, 31/12/2010 AND 31/12/2009. |
|
( FIGURES ARE IN THOUSANDS OF REAIS ). |
|
|
31/12/2011 |
31/12/2010 |
31/12/2009 |
|
|
|
|
|
|
GROSS SALES |
|
|
134.779 |
|
(-) TAXES ON SALES |
|
|
1.854 |
|
|
---------------- |
---------------- |
---------------- |
|
NET SALES |
185.859 |
141.700 |
132.925 |
|
(-) COST OF SOLD GOODS |
156.900 |
111.801 |
101.605 |
|
|
---------------- |
---------------- |
---------------- |
|
GROSS PROFIT |
28.959 |
29.899 |
31.320 |
|
OPERATING REVENUE (EXPENSE) |
-9.652 |
-20.403 |
-6.857 |
|
FINANCIAL REVENUE(EXPENSE) |
-554 |
1.345 |
-5.263 |
|
|
---------------- |
---------------- |
---------------- |
|
OPERATIONAL PROFIT (LOSS) |
18.753 |
10.841 |
19.200 |
|
CONTRIBUTION/INCOME TAX |
-4.220 |
-2.396 |
-3.132 |
|
|
---------------- |
---------------- |
---------------- |
|
NET PROFIT (LOSS) |
14.533 |
8.445 |
16.068 |
|
RATIOS: |
31/12/2011 |
31/12/2010 |
31/12/2009 |
|
QUICK RATIO |
1,18 |
|
1,39 |
|
1,07 |
|
|
CURRENT RATIO |
2,24 |
|
2,54 |
|
1,99 |
|
|
ACCOUNTS RECEIVABLE TURNOVER |
6,56 |
TIMES |
10,88 |
TIMES |
8,55 |
TIMES |
|
DAYS' SALES IN RECEIVABLES |
54,89 |
DAYS |
33,07 |
DAYS |
42,10 |
DAYS |
|
INVENTORY TURNOVER |
2,68 |
TIMES |
2,16 |
TIMES |
1,90 |
TIMES |
|
ACCOUNTS PAYABLE PERIOD |
25,76 |
DAYS |
29,98 |
DAYS |
54,71 |
DAYS |
|
RETURN ON ASSETS |
1,02 |
TIMES |
,87 |
TIMES |
,78 |
TIMES |
|
SALES TURNOVER ON NET EQUITY |
1,47 |
TIMES |
1,21 |
TIMES |
1,19 |
TIMES |
|
NET WORTH TIE-UP |
,24 |
|
,26 |
|
,26 |
|
|
INDEBTEDNESS |
,45 |
|
,39 |
|
,52 |
|
|
EQUITY RATIO |
69,07 |
% |
72,04 |
% |
65,66 |
% |
|
WORKING CAPITAL RATIO |
123,50 |
% |
153,76 |
% |
98,97 |
% |
|
GENERAL SOLVENCY |
3,23 |
|
3,58 |
|
2,91 |
|
|
RETURN ON NET EQUITY |
11,50 |
% |
7,20 |
% |
14,33 |
% |
|
RETURN ON SALES (PROFIT MARGIN) |
7,82 |
% |
5,96 |
% |
12,09 |
% |
|
GROSS PROFIT MARGIN |
15,58 |
% |
21,10 |
% |
23,56 |
% |
|
OPERATIONAL RESULT |
10,09 |
% |
7,65 |
% |
14,44 |
% |
|
SALES TURNOVER ON LIABILITIES |
3,36 |
TIMES |
3,14 |
TIMES |
2,28 |
TIMES |
|
FOREIGN CURRENCY ON ASSETS |
|
|
|
|
|
|
|
FOREIGN CURRENCY ON LIABILITIES |
|
|
|
|
|
|
|
EXCHANGE RATE: |
|
|
US$ 1,00 = R$ 2,03 |
- OFFICIAL RATE ON 06/09/2012 |
|
US$ 1,00 = R$ 1,87 |
- OFFICIAL RATE ON 31/12/2011 |
|
US$ 1,00 = R$ 1,66 |
- OFFICIAL RATE ON 31/12/2010 |
|
US$ 1,00 = R$ 1,74 |
- OFFICIAL RATE ON 31/12/2009 |
|
COMMENTS ON THE
FINANCIAL INFORMATION: |
|
FOLLOWS ATTACHED WORKSHEET WITH MAIN FINANCIAL RATIOS THE FIGURES AVAILABLE SHOW A GOOD FINANCIAL STANDING. IT IS NOTED GOOD
LIQUIDITY RATIOS AND IMPORTANT WORKING CAPITAL, AS WELL AS LOW LEVEL OF
INDEBTEDNESS. IN ADDITION, IT IS NOTED GROWING SALES AND MADE PROFIT. |
|
REAL ESTATE: |
OWNED PREMISES ARE VALUED AT R$ 13.913.000,00
|
VEHICLES: |
OWNED VEHICLES ARE VALUED AT R$ 333.000,00
|
MACHINES: |
OWNED MACHINES AND EQUIPMENTS ARE VALUED AT R$ 11.278.000,00
INSURANCE
|
COVERAGE: |
FIRE / RAY / EXPLOSION |
|
VALUE: |
R$ 47.000.000,00 |
|
|
|
|
COVERAGE: |
EXPORT CREDIT |
|
VALUE: |
R$ 38.000.000,00 |
BANKING REFERENCES
|
|
BRANCH/PHONE: |
CITY: |
|
BANCO BRADESCO S/A |
2864 / 71 3355-6467 |
SALVADOR/BA |
|
BANCO DO BRASIL S/A |
0040-X / 75 3425-2611 |
SALVADOR/BA |
|
REMARKS: IN BRAZIL THE BANKS ARE PROHIBITED BY LAW TO PROVIDE
INFORMATION OR ANY KIND OF COMMENTS ABOUT THEIR CLIENTS. DUE TO THIS LAW
PROHIBITION WE ARE UNABLE TO PROVIDE ANY BANKING DETAILS. ACCORDING TO THE CENTRAL BANK OF BRAZIL OFFICIAL REPORT, THE COMPANY
HAS NO RETURNED CHECKS UP TO DATE. (IN THE TERMS OF "CIRCULAR 1682
BRAZILIAN CENTRAL BANK"). |
ACTIVITIES COMMENTS
|
TANNING AND OTHER LEATHER PREPARATIONS. |
|
IMPORT AND
EXPORT: |
IMPORTS FROM:
|
NOT AVAILABLE |
EXPORTS TO:
|
HOLLAND, CANADA, TAIWAN AND HONG KONG. |
|
MAIN CLIENTS: |
|
|
|
|
|
|
|
DOMESTIC
CLIENTS: |
|
PHONE: |
|
ITALSOFA BAHIA LTDA |
|
71 3594-3100 |
|
FOREIGN CLIENTS: |
COUNTRY: |
|
|
AD HULST VOF |
HOLLAND |
|
|
CTL LEATHER INC |
CANADA |
|
|
GRADE A LEATHER CO LTD |
TAIWAN |
|
|
NOBLE FURNISHING CO. LTD |
HONG KONG |
|
|
STAFF: |
|
|
|
THE COMPANY HAS: 550 EMPLOYEE(S) |
CONCEPT AND FULFILMENT
|
SUBJECT IS A WELL-ESTABLISHED COMPANY, OPERATING SINCE 1999. SO FAR IT
HAS A CLEAR TRADE HISTORY AND GOOD PAYMENT BEHAVIOR. THE COMPANY HAS TRADE RELATIONS WITH SEVERAL SUPPLIERS IN BRAZIL. THE SUPPLIERS
EXTEND CREDIT FACILITIES TO THE SUBJECT IN TERMS AND AMOUNTS ACCORDING TO THE
COMPANY'S NEEDS AND SO FAR NO PAYMENT PROBLEMS ARE NOTED. THE PROTEST FOUND IS CONSIDERED IRRELEVANT. |
|
MAIN SUPPLIERS: |
|
|
|
|
|
|
|
DOMESTIC
SUPPLIERS: |
|
PHONE: |
|
BERTIN LTDA |
|
14 3533-2033 |
|
COUROADA COMÉRCIO E REPRESENTAÇÕES LTDA |
|
18 3522-1135 |
|
GREMIA REDUTORES LTDA |
|
54 2105-3271 |
|
INDEPENDÊNCIA ALIMENTOS LTDA |
|
11 4447-7000 |
|
INDUSPAN - INDÚSTRIA E COMÉRCIO DE COUROS PANTANAL |
|
67 3373-4242 |
|
TFL DO BRASIL INDÚSTRIA QUÍMICA LTDA |
|
51 3589-1999 |
|
PAYMENT HISTORY: |
|
06 SUPPLIERS REPORTED PAYMENTS: |
|
TOTAL AMOUNT: R$ 364.976,00 |
|
|
|
AMOUNT OF INVOICES PAID: 46 |
|
TOTAL OF PROMPT PAYMENTS: 99,7% |
|
TOTAL OF DELAYED PAYMENTS: 0,3% |
|
|
|
HIGHEST INVOICE: R$ 35.441,00 |
|
HIGHEST CREDIT: R$ 35.441,00 |
|
|
|
OUTSTANDING
INVOICES DUE WITHIN THE NEXT 30 DAYS: |
|
--------------------------- |
SUPPLIERS: |
INVOICES: |
TOTAL AMOUNT: |
|
DUE WITHIN 30 DAYS |
1 |
8 |
R$ 4.439,79 |
FINAL OPINION
|
THE SUBJECT IS A WELL-ESTABLISHED COMPANY IN BUSINESS FOR SEVERAL
YEARS. UP TO DATE IT HAS GOOD FINANCIAL STANDING, A CLEAR TRADE HISTORY AND
VERY GOOD PAYMENT BEHAVIOUR. BASED ON THE GENERAL INFORMATION AVAILABLE IT IS BELIEVED THAT GOOD
TRADE RELATIONS MAY BE ESTABLISHED. CREDIT FACILITIES MAY BE EXTENDED WITHIN
TERMS AND AMOUNTS ADEQUATE TO THE COMPANY'S FINANCIAL STRENGTH. |
|
|
|
|
|
|
|
|
|
BALANCE SHEET ANALYSIS |
FIGURES ARE IN THOUSANDS
OF REAIS |
|
|
|
||
|
|
31/12/2011 |
|
31/12/2010 |
|
31/12/2009 |
|
|
ASSETS |
|
% |
|
% |
|
% |
|
Current Assets |
67.52 |
$ 114,477 |
70.33 |
$
116,051 |
67.94 |
|
|
Fixed Assets |
$ 30,451 |
16.64 |
$ 30,606 |
18.80 |
$ 28,888 |
16.91 |
|
TOTAL ASSETS |
$ 183,030 |
100.00 |
$ 162,767 |
100.00 |
$
170,812 |
100.00 |
|
LIABILITIES |
|
|
|
|
|
|
|
Current Liabilities |
$ 55,298 |
30.21 |
$ 45,113 |
27.72 |
$ 58,325 |
34.15 |
|
Long-Term Liabilities |
$
1,316 |
0.72 |
$ 399 |
0.25 |
$ 326 |
0.19 |
|
TOTAL LIABILITIES |
$ 56,614 |
30.93 |
$ 45,512 |
27.96 |
$ 58,651 |
34.34 |
|
Deferred Income |
$ - |
0.00 |
$ - |
0.00 |
$ - |
0.00 |
|
Net Equity |
$ 126,416 |
69.07 |
$ 117,255 |
72.04 |
$
112,161 |
65.66 |
|
TOTAL LIABILITIES + NET EQUITY |
$ 183,030 |
100.00 |
$ 162,767 |
100.00 |
$
170,812 |
100.00 |
|
PROFIT AND LOSS ACCOUNTS |
|
|
|
|
|
|
|
Net Sales |
$ 185,859 |
100.00 |
$ 141,700 |
100.00 |
$
132,925 |
100.00 |
|
Costs |
$ 156,900 |
84.42 |
$ 111,801 |
78.90 |
$
101,605 |
76.44 |
|
Gross Profit |
$ 28,959 |
15.58 |
$ 29,899 |
21.10 |
$ 31,320 |
23.56 |
|
Operating expenses |
$ (9,652) |
-5.19 |
$ (20,403) |
-14.40 |
$ (6,857) |
-5.16 |
|
operational Result |
$ 18,753 |
10.09 |
$ 10,841 |
7.65 |
$ 19,200 |
14.44 |
|
Net Profit (loss) |
$ 14,533 |
7.82 |
$ 8,445 |
5.96 |
$ 16,068 |
12.09 |
|
COMPLEMENTARY DATA |
|
|
|
|
|
|
|
Inventory |
$ 58,526 |
|
$ 51,644 |
|
$ 53,396 |
|
|
Accounts receivable |
$ 28,339 |
|
$ 13,018 |
|
$ 15,543 |
|
|
Accounts Payable |
$ 11,229 |
|
$ 9,311 |
|
$ 15,440 |
|
|
Property, plant and equipment |
$ 30,244 |
|
$ 30,463 |
|
$ 28,786 |
|
|
Purchases |
$ 30,451 |
|
$ 30,606 |
|
$ 28,888 |
|
|
Financial Expenses |
$ (554) |
|
$ 1,345 |
|
$ (5,263) |
|
|
Foreign Currency Assets |
|
|
|
|
|
|
|
Foreign Currency Liabilities |
|
|
|
|
|
|
|
Working Capital |
$ 68,292 |
|
$ 69,364 |
|
$ 57,726 |
|
|
RATIOS: |
|
|
|
|
|
|
|
QUICK RATIO |
1.18 |
|
1.39 |
|
1.07 |
|
|
CURRENT RATIO |
2.23 |
|
2.54 |
|
1.99 |
|
|
ACCOUNTS RECEIVABLE TURNOVER |
6.56 |
times |
10.88 |
times |
8.55 |
times |
|
DAYS' SALES IN RECEIVABLES |
54.89 |
days |
33.07 |
days |
42.10 |
days |
|
INVENTORY TURNOVER |
2.68 |
times |
2.16 |
times |
1.90 |
times |
|
25.76 |
days |
29.98 |
days |
54.71 |
days |
|
|
RETURN ON ASSETS |
1.02 |
times |
0.87 |
times |
0.78 |
times |
|
SALES TURNOVER ON NET EQUIY |
1.47 |
times |
1.21 |
times |
1.19 |
times |
|
NET WORTH TIE-UP |
0.24 |
|
0.26 |
|
0.26 |
|
|
ENDEBTEDNESS |
0.45 |
|
0.39 |
|
0.52 |
|
|
EQUITY RATIO |
69.07 |
% |
72.04 |
% |
65.66 |
% |
|
WORKING CAPITAL RATIO |
123.50 |
% |
153.76 |
% |
98.97 |
% |
|
GENERAL SOLVENCY |
3.23 |
|
3.58 |
|
2.91 |
|
|
RETURN ON NET EQUITY |
11.50 |
% |
7.20 |
% |
14.33 |
% |
|
RETURN ON SALES (PROFIT MARGIN) |
7.82 |
% |
5.96 |
% |
12.09 |
% |
|
GROSS PROFIT MARGIN |
15.58 |
% |
21.10 |
% |
23.56 |
% |
|
OPERATIONAL RESULT |
10.09 |
% |
7.65 |
% |
14.44 |
% |
|
SALES TURNOVER ON LIABILITIES |
3.36 |
times |
3.14 |
times |
2.28 |
times |
|
FOREIGN CURRENCY ON ASSETS |
- |
% |
- |
% |
- |
% |
|
FOREIGN CURRENCY ON LIABILITIES |
- |
% |
- |
% |
- |
% |
FOREIGN EXCHANGE RATES
|
Currency |
Unit
|
Indian Rupees |
|
US Dollar |
1 |
Rs.55.34 |
|
UK Pound |
1 |
Rs.88.50 |
|
Euro |
1 |
Rs.70.74 |
INFORMATION DETAILS
|
Report Prepared
by : |
MNL |
RATING EXPLANATIONS
|
RATING |
STATUS |
PROPOSED CREDIT LINE |
|
|
>86 |
Aaa |
Possesses an extremely sound financial base with the strongest capability
for timely payment of interest and principal sums |
Unlimited |
|
71-85 |
Aa |
Possesses adequate working capital. No caution needed for credit
transaction. It has above average (strong) capability for payment of interest
and principal sums |
Large |
|
56-70 |
A |
Financial & operational base are regarded healthy. General
unfavourable factors will not cause fatal effect. Satisfactory capability for
payment of interest and principal sums |
Fairly Large |
|
41-55 |
Ba |
Overall operation is considered normal. Capable to meet normal
commitments. |
Satisfactory |
|
26-40 |
B |
Capability to overcome financial difficulties seems comparatively
below average. |
Small |
|
11-25 |
Ca |
Adverse factors are apparent. Repayment of interest and principal sums
in default or expected to be in default upon maturity |
Limited with
full security |
|
<10 |
C |
Absolute credit risk exists. Caution needed to be exercised |
Credit not
recommended |
|
---- |
NB |
New Business |
---- |
This score serves as a reference to assess SC’s credit risk
and to set the amount of credit to be extended. It is calculated from a
composite of weighted scores obtained from each of the major sections of this report.
The assessed factors and their relative weights (as indicated through %) are as
follows:
Financial
condition (40%) Ownership
background (20%) Payment
record (10%)
Credit history
(10%) Market trend
(10%) Operational
size (10%)
This report is issued at your request without any
risk and responsibility on the part of MIRA INFORM PRIVATE LIMITED (MIPL)
or its officials.