MIRA INFORM REPORT
|
Report Date : |
24.09.2012 |
|
|
|
IDENTIFICATION DETAILS
|
Name : |
AMC GRUPO ALIMENTACION FRESCO Y ZUMOS
SOCIEDAD ANONIMA |
|
|
|
|
Registered Office : |
|
|
|
|
|
Country : |
|
|
|
|
|
Financials (as on) : |
31.08.2010 |
|
|
|
|
Date of Incorporation : |
28.12.1950 |
|
|
|
|
Legal Form : |
Joint Stock Company |
|
|
|
|
line of business
: |
Manufacturing of fruit and vegetable juice |
|
|
|
|
No. of Employees : |
RATING & COMMENTS
|
MIRA’s Rating : |
Ba |
|
RATING |
STATUS |
PROPOSED CREDIT LINE |
|
|
41-55 |
Ba |
Overall operation is considered normal. Capable to meet normal
commitments. |
Satisfactory |
|
Status : |
Good |
|
Payment Behaviour : |
No Complaints |
|
Litigation : |
Clear |
NOTES:
Any query related to this report can be made
on e-mail: infodept@mirainform.com
while quoting report number, name and date.
ECGC Country Risk Classification List – March 31st, 2012
|
Country Name |
Previous Rating (31.12.2011) |
Current Rating (31.03.2012) |
|
Spain |
A2 |
A2 |
|
Risk Category |
ECGC
Classification |
|
Insignificant |
A1 |
|
Low |
A2 |
|
Moderate |
B1 |
|
High |
B2 |
|
Very High |
C1 |
|
Restricted |
C2 |
|
Off-credit |
D |
SPAIN - ECONOMIC OVERVIEW
spain's mixed capitalist economy is the 13th largest in the
world, and its per capita income roughly matches that of Germany and France.
However, after almost 15 years of above average GDP growth, the Spanish economy
began to slow in late 2007 and entered into a recession in the second quarter
of 2008. GDP contracted by 3.7% in 2009, ending a 16-year growth trend, and by
another 0.1% in 2010, before turning positive in 2011, making Spain the last
major economy to emerge from the global recession. The reversal in Spain''s
economic growth reflected a significant decline in construction amid an
oversupply of housing and falling consumer spending, while exports actually
have begun to grow. Government efforts to boost the economy through stimulus
spending, extended unemployment benefits, and loan guarantees did not prevent a
sharp rise in the unemployment rate, which rose from a low of about 8% in 2007
to over 20% in 2011. The government budget deficit worsened from 3.8% of GDP in
2008 to 9.2% of GDP in 2010, more than three times the euro-zone limit. Madrid
cut the deficit to 8.5% of GDP in 2011, a larger deficit than the 6% target
negotiated between Spain and the EU. Spain''s large budget deficit and poor
economic growth prospects have made it vulnerable to financial contagion from
other highly-indebted euro zone members despite the government''s efforts to
cut spending, privatize industries, and boost competitiveness through labor
market reforms. Spanish banks'' high exposure to the collapsed domestic
construction and real estate market also poses a continued risk for the sector.
The government oversaw a restructuring of the savings bank sector in 2010, and
provided some $15 billion in capital to various institutions. Investors remain
concerned that Madrid may need to bail out more troubled banks. The Bank of
Spain, however, is seeking to boost confidence in the financial sector by
pressuring banks to come clean about their losses and consolidate into stronger
groups.
|
Source
: CIA |
COMPANY NAME
AMC GRUPO ALIMENTACION FRESCO Y ZUMOS SOCIEDAD ANONIMA
CIF/NIF: A30009146
Company situation: Active
EXECUTIVE
SUMMARY
Identification
Current Business Name: AMC GRUPO ALIMENTACION FRESCO Y ZUMOS
SOCIEDAD ANONIMA
Other names: YES
Current Address: CARRETERA DE MADRID, KM 390
Branches: 12
Telephone number: 968278200 Fax: 968278210
URL: www.amcgrupo.eu
Corporate e-mail: amunoz@amunoz.com
Trade Risk
Credit appraisal: 3.155.000,00 €
Incidents: YES
R.A.I.: NO
EXPERIAN BUREAU EMPRESARIAL Bank and Multi - sectorial Defaults of
Payment: NO
Financial Information
Balance sheet latest sales (2010): 178.817.716,00 € (Mercantile Register)
Result: 6.160.430 €
Total Assets: 199.474.236 €
Share capital: 3.952.926,66 €
Employees: 1.640
Listed on a Stock Exchange: NO
Commercial Information
Incorporation date: 28/12/1950
Activity: Mfg. of fruit & vegetable juice
NACE 2009 CODE: 1032
International Operations: Imports and
Exports
Corporate Structure
President:
Participations: 15
Other Complementary Information
Latest filed accounts in the Mercantile Register: 2010
Latest act published in BORME: 07/08/2012 Re-elections
Latest press article: 17/06/2011 EL PAIS (LEGAL ANNOUNCEMENTS)
Bank Entities: There are
The date when this report was last updated is 21/09/2012.
The information contained in this report has been investigated and
contrasted on 12/09/2012
TRADE RISK
Financial situation
|
Exercise:2010 |
Evolution |
|||
|
Treasury |
|
Very good |
|
|
|
Indebtedness |
|
Average |
|
|
|
Profitability |
|
Average |
|
|
|
Balance |
|
Excellent |
|
|
Performance
|
Incidents |
|
None or Negligible |
|
Business Trajectory |
|
Excellent |
Rating Explanation
Financial situation
The company’s financial situation is normal.
The company’s financial situation evolution has been positive.
The sales evolution and results has been positive.
The auditor’s opinion about the latest accounts has
been favourable.
Company Structure
The company’s capitalization degree determines that its structure
is sound.
The company’s size is big depending on its sales volume.
The employees evolution has been positive.
Performance and Incidences
The available information indicates that the company does not have
payment incidences.
He have detected no recent legal actions or claims from the
Administration against this company.
Accounts Filing
The company files regularly its accounts.
Reasons of the last outstanding calculation in the note
|
DATE |
CHANGE |
RESULTING NOTE |
EVENT |
|
13/09/2012 |
Equal |
15 |
There has been a variation in the affected parties of the company’s
non-payments information. |
|
04/09/2012 |
Equal |
15 |
There has been a variation in the affected parties of the company’s
non-payments information. |
|
01/08/2012 |
Reduction |
15 |
New information has been loaded on our systems. |
|
28/05/2012 |
Increase |
16 |
New information has been loaded on our systems. |
|
21/05/2012 |
Equal |
14 |
New financial statements have been uploaded. |
Summary
LEGAL ACTIONS: No legal actions registered
ADMINISTRATIVE CLAIMS: 1 ( Last:10/11/2010 )
|
|
|
|
|
With the Social Security: |
0 |
|
|
With the Tax Authorities: |
0 |
|
|
With Other Official bodies: |
1 |
|
AFFECTED BY: No significant element.
Latest Administrative Claims
figures expressed in €
WITH OTHER OFFICIAL BODIES.
Notifications
|
DATE |
ORGANIZATION |
AMOUNT |
|
10/11/2010 |
DEPARTAMENTO DE OBRAS PUBLICAS TRANSPORTES Y COMUNICACIONES |
1.501,00 |
Detail of the Latest Administrative Claims
figures expressed in €
Notifications
WITH OTHER OFFICIAL BODIES.
Phase: DEBTS WITH OFFICIAL BODIES
Organization: UNDETERMINED AGENCY DEPARTAMENTO DE OBRAS
PUBLICAS TRANSPORTES Y COMUNICACIONES
Concept: Sanction
Date of the claim: 10/11/2010
Source: Published in the Gazette of NAVARRA, on 26/11/2010, page 15.637
Amount: 1.501
EXPERIAN BUREAU EMPRESARIAL BANK AND MULTI - SECTORIAL DEFAULTS OF PAYMENT ![]()
Summary
COMPANY NOT INCLUDED IN EXPERIAN BUREAU EMPRESARIAL BANK AND MULTI -
SECTORIAL DEFAULTS OF PAYMENT
There is no information related to the nif/cif consulted in the in the
EXPERIAN BUREAU EMPRESARIAL BANK AND MULTI - SECTORIAL DEFAULTS OF PAYMENT file
This information comes from Experian Bureau Empresarial Service,
property of Experian Bureau de Crédito S.A. It could just be used for
businessmen or professionals and for the own aims of the business, and could
not be transferred or transmitted to third parties, copied, duplicate or
reproduce, nor incorporate to any owned or external database, or reuse it in
any direct or indirect way. Experian Bureau de Crédito S.A. may file you for
damages it may suffer in case of breaching any of the afore mentioned
obligations. Experian would not be responsible of the lack of accuracy in the
supplied information when it coincides with the one supplied by the creditor
entities.
R.A.I.
COMPANY NOT REGISTERED IN THE R.A.I.
This company is not registered in the Disputed Bills register (R.A.I.)
DATE AND TIME OF THE CONSULTATION
21/09/2012 08:09:56
Information from the Registro de Aceptaciones Impagados (RAI)- Disputed
Bills register.
It can only be used for information legitimate needs of the consulting
party, in accordance with its social or business activity, in order to grant a
credit or the monitoring or control of the already granted credits and can not
be transmitted or communicated to thirds, nor copied, duplicated, reproduced
nor implemented to any database , owned or external, or reused it in anyway,
direct or indirectly.
FINANCIAL ELEMENTS AND SECTORIAL
COMPARATIVE
FINANCIAL ELEMENTS
The shaded amounts in the following financial statements have been
converted to the norms established in the PGC2007 derived from RD 1514/2007 and
1515/2007, this way comparatives could be shown with the amounts of exercises
initiated from 1/01/08.
Figures given in €
|
|
31/08/2010 (12) BALANCE SHEET |
% ASSETS |
31/08/2009 (12) BALANCE SHEET |
% ASSETS |
31/08/2008 (12) BALANCE SHEET |
% ASSETS |
|
ASSETS |
|
|
|
|
|
|
|
A) NON CURRENT ASSETS |
57.018.753,00 |
28,58 |
55.997.677,79 |
28,98 |
57.819.932,22 |
33,36 |
|
B) CURRENT ASSETS |
142.455.483,00 |
71,42 |
137.261.747,87 |
71,02 |
115.517.168,41 |
66,64 |
|
LIABILITIES |
|
|
|
|
|
|
|
A) NET WORTH |
73.411.837,00 |
36,80 |
67.425.774,75 |
34,89 |
63.918.766,51 |
36,88 |
|
B) NON CURRENT LIABILITIES |
15.400.783,00 |
7,72 |
15.939.383,96 |
8,25 |
13.708.278,88 |
7,91 |
|
C) CURRENT LIABILITIES |
110.661.616,00 |
55,48 |
109.894.266,95 |
56,86 |
95.710.055,24 |
55,22 |
Profit and loss account analysis ![]()
Figures given in €
|
|
31/08/2010 (12) BALANCE SHEET |
% NET TURNOVER |
31/08/2009 (12) BALANCE SHEET |
% NET TURNOVER |
31/08/2008 (12) BALANCE SHEET |
% NET TURNOVER |
|
SALES |
178.817.716,00 |
|
165.662.484,54 |
|
158.429.640,40 |
|
|
GROSS MARGIN |
74.577.542,00 |
41,71 |
78.910.859,64 |
47,63 |
67.697.741,99 |
42,73 |
|
EBITDA |
12.230.267,00 |
6,84 |
9.755.756,50 |
5,89 |
12.343.519,19 |
7,79 |
|
EBIT |
7.592.147,00 |
4,25 |
5.441.028,84 |
3,28 |
8.282.598,23 |
5,23 |
|
NET RESULT |
6.160.430,00 |
3,45 |
3.656.559,75 |
2,21 |
2.831.335,56 |
1,79 |
|
EFFECTIVE TAX RATE (%) |
-34,62 |
0,00 |
-2,54 |
0,00 |
26,03 |
0,00 |
COMPARATIVE SECTOR ANALYSIS
Values table
Figures expressed in %
|
|
COMPANY (2010) |
SECTOR |
DIFFERENCE |
|
|
|
|
|
BALANCE SHEET ANALYSIS: % on the total assets |
|
|
|
|
|
|
|
|
ASSETS |
|
|
|
|
|||
|
A) NON CURRENT ASSETS |
28,58 |
53,40 |
-24,81 |
|
|
|
|
|
A) CURRENT ASSETS |
71,42 |
46,60 |
24,81 |
|
|
|
|
|
LIABILITIES |
|
|
|
|
|||
|
A) NET WORTH |
36,80 |
37,21 |
-0,41 |
|
|
|
|
|
B) NON CURRENT LIABILITIES |
7,72 |
25,19 |
-17,47 |
|
|
|
|
|
C) CURRENT LIABILITIES |
55,48 |
37,60 |
17,88 |
|
|
|
|
|
|
|
|
|
|
|
|
|
|
|
COMPANY (2010) |
SECTOR |
DIFFERENCE |
|
|
|
|
|
PROFIT AND LOSS ACCOUNT ANALYSIS: % on the total operating income |
|
|
|
|
|
|
|
|
SALES |
95,30 |
97,56 |
-2,26 |
|
|
|
|
|
GROSS MARGIN |
39,74 |
44,14 |
-4,40 |
|
|
|
|
|
EBITDA |
6,52 |
9,49 |
-2,98 |
|
|
|
|
|
EBIT |
4,05 |
4,42 |
-0,38 |
|
|
|
|
|
NET RESULT |
3,28 |
2,13 |
1,16 |
|
|
|
|
Sector Composition
Compared sector (NACE 2009): 1032
Number of companies: 22
Size (sales figure): > 7,000,000.00 Euros
OTHER DATA FROM THE ANNUAL FINANCIAL REPORT
Results Distribution
Source: annual financial report 2010
Figures given in €
|
DISTRIBUTION BASE |
APPLICATION A |
||
|
Profit and Loss Account Balance |
6.160.430,00 |
Legal Reserve |
0,00 |
|
Carry over |
0,00 |
Goodwill reserve |
0,00 |
|
Voluntary reserves |
0,00 |
Special reserves |
0,00 |
|
Other reserves disposable at will |
0,00 |
Voluntary reserves |
6.160.430,00 |
|
Total of Amounts to be distributed |
6.160.430,00 |
Dividends |
0,00 |
|
|
|
Carry over and others |
0,00 |
|
|
|
Compensation of previous exercises losses |
0,00 |
|
|
|
Application total |
6.160.430,00 |
Auditing
Source: filing of annual financial statement 2010
Auditors’ opinion: FAVOURABLE
Auditor: ABANTOS AUDITORES Y ASESORES S.L.
Auditing fees: 91.000,00 €
Facts subsequent to the closing
Source: Annual financial report 2010
Tres accionistas minoritarios de la Sociedad dominante tienen
presentados ante los juzgados mercantiles de Murcia tres procedimientos
ordinarios, dos de ellos, que están pendientes de celebración de juicio, por
impugnación de los acuerdos de la Junta de Accionistas celebrada el 15 de julio
de 2008 y por ejercicio de la acción social de responsabilidad, y el tercero,
con fallo favorable a la sociedad en los juzgados de lo mercantil y recurrido
ante la Audiencia Provincial de Murcia, por impugnación de los acuerdos de la
Junta de Accionistas celebrada el 11 de junio de 2009. Actualmente se está en
negociaciones con estos accionistas para la compra de su participación en el
capital social y existe un principio de acuerdo, lo que supondría la retirada
de los procedimientos judiciales.
ADDRESSES
Current Legal Seat Address:
CARRETERA DE MADRID, KM 390
ESPINARDO 30100 MURCIA
Previous Seat Address:
CALLE MONTESA 1
28006 MADRID
Characteristics of the current address
Type of establishment: office
Local Situation: secondary
|
STREET |
POSTAL CODE |
TOWN |
PROVINCE |
|
AVENIDA ESTACION, S/N |
03300 |
ORIHUELA |
Alicante |
|
CARRETERA DE RONDA, 151 |
04008 |
ALMERIA |
Almería |
|
RONDA, 263 |
04008 |
ALMERIA |
Almería |
|
CARRETERA DE AYAMONTE |
21540 |
VILLANUEVA DE LOS CASTILLEJOS |
Huelva |
|
FINCA LAS BODEGAS |
21510 |
SAN BARTOLOME DE LA TORRE |
Huelva |
|
PARQUE GARDENY, 23 |
25003 |
LLEIDA |
Lérida |
|
CALLE CALVARIO, 18 |
30600 |
ARCHENA |
Murcia |
|
CALLE MAGNO, 10 |
30506 |
MOLINA DE SEGURA |
Murcia |
|
CALLE LLOSA DE RANES (S-N), S/N |
46021 |
VALENCIA |
Valencia |
|
CALLE LLOSA DE RANES |
46294 |
CARCER |
Valencia |
There are 12 branches registered
|
STREET |
POSTAL CODE |
TOWN |
PROVINCE |
|
CALLE MADRID (ESPINARDO) |
30100 |
MURCIA |
Murcia |
|
CALLE CARME, 16 |
08001 |
BARCELONA |
Barcelona |
|
CALLE CABALLERO DE GRACIA, 8 |
28013 |
MADRID |
Madrid |
|
CALLE CASP, 30 |
08010 |
BARCELONA |
Barcelona |
|
CALLE FUENTES, 12 |
28013 |
MADRID |
Madrid |
There are 7 former branches registered
CORPORATE STRUCTURE
ADMINISTRATIVE LINKS
|
|
|
|
|
|
Distribution of the administration board |
|
|
Governing body : 9 members (latest change:
27/07/2012) Other Positions : 5 (latest change: 23/02/2011) Auditor : 1 (latest change: 18/11/2010) Operative Board Members : 4 (latest change: 17/05/2010) Non-current positions : 19 (latest change: 18/11/2010) |
|
|

Main Board members, Directors and Auditor ![]()
Governing body
|
POSITION |
NAME AND SURNAME |
DATE APPOINTMENT |
|
PRESIDENT |
MUÑOZ ARMERO, ANTONIO |
29/10/2008 |
|
VICE-PRESIDENT |
MUÑOZ BERAZA, ALVARO |
29/10/2008 |
|
MANAGING DIRECTOR |
MUÑOZ BERAZA, ANTONIO |
27/07/2012 |
|
|
|
|
Auditor
|
POSITION |
NAME AND SURNAME |
DATE APPOINTMENT |
|
AUDITOR |
ABANTOS AUDITORES Y ASESORES SL |
18/11/2010 |
registered Board members remuneration
Source: Annual financial report 2008
Board members
remuneration: 776.567,86 €
|
POSITION |
NAME AND SURNAME |
|
General Manager |
MUNOZ BERAZA, ANTONIO |
|
Financial Manager |
CILLER DEL GEA, SALVADOR |
|
Purchases Director |
GONZALEZ GALLEGO, DAVID |
|
Operations Director |
ALCOLEA JOSE, MARIA |
FINANCIAL LINKS
|
|
BUSINESS NAME |
TAX NUMBER/COUNTRY |
% |
SOURCE |
DATE REP. |
|
|
MUNOZ BERAZA ANTONIO |
|
37,00 |
OWN SOURCES |
24/05/2011 |
|
|
MUNOZ BERAZA ALVARO |
|
37,00 |
OWN SOURCES |
24/05/2011 |
|
|
MUNOZ FERNANDEZ MANUEL |
|
11,00 |
OWN SOURCES |
24/05/2011 |
|
|
BUSINESS NAME |
TAX NUMBER/COUNTRY |
% |
SOURCE |
DATE REP. |
|
|
MUNOZ AIZPURU JUAN MANUEL |
|
20,00 |
OWN SOURCES |
26/01/2009 |
|
|
MUNOZ BERAZA CARLOS |
|
20,00 |
OWN SOURCES |
26/01/2009 |
|
|
MUNOZ ARMERO ANTONIO |
|
Indef. |
OWN SOURCES |
24/05/2010 |
|
|
BUSINESS NAME |
TAX NUMBER/COUNTRY |
% |
SOURCE |
DATE REP. |
|
|
INTERCAMBIO COMERCIAL MERCADOS EXTERIORES, SL U |
B28094928 |
100,00 |
B.O.R.M.E. |
26/10/2011 |
|
|
PRODUCCIONES AGRICOLAS ESPECIALES CB |
E30463483 |
100,00 |
OWN SOURCES |
13/04/2011 |
|
|
SPECIAL NEWFRUIT LICENSING MEDITERRANEO S.L. |
B73219958 |
100,00 |
OWN SOURCES |
13/04/2011 |
|
|
ANTONIO MUNOZ VALENCIA CITRICOS SL. |
B73253395 |
100,00 |
OWN SOURCES |
13/04/2011 |
|
|
AMC HUELVA CITRICOS SL. |
B73253379 |
100,00 |
OWN SOURCES |
13/04/2011 |
|
|
SUPERIOR FRUTICOLA SA |
A78002383 |
100,00 |
OWN SOURCES |
13/04/2011 |
|
|
MM IBERIA FRESH AND NATURAL FOOD S.L. |
B73219966 |
100,00 |
OWN SOURCES |
13/04/2011 |
|
|
MUNOZ MEHADRIN LTD |
UNITED KINGDOM |
100,00 |
OWN SOURCES |
13/04/2011 |
|
|
AMC DIRECT LTD |
UNITED KINGDOM |
100,00 |
OWN SOURCES |
13/04/2011 |
|
|
AGRI COMMERCE SA |
FRANCE |
99,90 |
OWN SOURCES |
13/04/2011 |
![]() Company with rating inferior to 7
Company with rating inferior to 7
|
|
BUSINESS NAME |
TAX NUMBER/COUNTRY |
% |
SOURCE |
DATE REP. |
|
|
CANADA DE BEAS SL. (EXTINGUIDA) |
B73256075 |
100,00 |
B.O.R.M.E. |
20/08/2007 |
|
|
EXPLOTACIONES AGRICOLAS CARRASCOY SOCIEDAD LIMITADA. (EXTINGUIDA) |
B73256059 |
100,00 |
B.O.R.M.E. |
20/08/2007 |
|
|
ALBERT FISHER PRODUCCIONES ESPECIALES SA (EXTINGUIDA) |
A81137572 |
100,00 |
B.O.R.M.E. |
20/08/2007 |
![]() Company with rating inferior to 7
Company with rating inferior to 7
BUSINESS INFORMATION
Incorporation date: 28/12/1950
Establishment date: 01/01/1950
Founder’s Name: LA TITULAR
Code: 1415200
Activity: Mfg. of fruit & vegetable juice
NACE 2009 CODE: 1032
NACE 2009 Activity: Manufacture of fruit and vegetable juice
Business: PRODUCTION AND SALES
OF AGRICULTURAL PRODUCTS MAINLY FOR FOREIGN
MARKET MAKING AND
DERIVATIVES OF CITRUS
Activity description: Production and handling of fruits as well as manufacture and sale of juices.
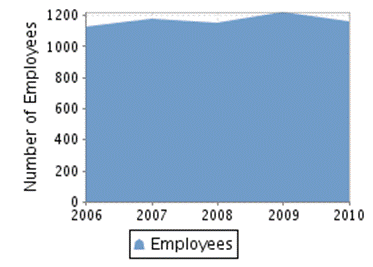
Latest employees figure: 1.640 (2012)
% of fixed employees: 100,00%
% of men: 68,08%
% of women: 31,92%
Employees evolution
|
|
|
|
Source: Annual financial report 2010
|
CATEGORY |
AVERAGE NUMBER OF EMPLOYEES |
MEN |
WOMEN |
|
Distribution by sexes |
|
578 |
271 |
COMMERCIAL OPERATIONS
PURCHASES
Import Percentage: 38%
Imports from: UE Y OTROS PAISES
National Distribution: 62%
SALES
Export Percentage: 69%
Exports to: UE Y OTROS PAISES
National Distribution: 31%
SUPPLIERS
|
BUSINESS NAME |
INTERNATIONAL |
|
AMC DIRECT INC (FILIAL EN CANADÁ) |
YES |
|
AMC DIRECT LTD (FILIAL EN REINO UNIDO) |
YES |
|
SPECIAL NEW FRUIT LICESNSIGN LTD (FILIAL EN REINO UNIDO) |
YES |
|
AGRI COMMERCE SA (FILIAL EN FRANCIA). |
YES |
|
MM UK LTD (FILIAL REINO UNIDO) |
YES |
|
AMGAT CITRUS PRODUCTS SA(FILIAL EN ESPAÑA) |
NO |
CLIENTS
|
BUSINESS NAME |
INTERNATIONAL |
|
SPECIAL NEW FRUIT LICENSING LTD |
YES |
|
AMC DIRECT INC |
YES |
|
MM UK LTD |
YES |
|
AGRIL COMMERCE SA |
YES |
|
AMGAT CITRUS PRODUCTS S.A |
NO |
El 69,97% de su cifra de negocio corresponde a zumos y resto.
El 30,03% de su cifra de negocio corresponde a fruta.
|
ENTITY |
BRANCH |
ADDRESS |
TOWN OR CITY |
PROVINCE |
|
BANCO SANTANDER, S.A. |
6660 |
TRAPERIA, 72 ENTRESUELO |
MURCIA |
Murcia |
|
BANCO DE VALENCIA, S.A. |
1400 |
TRAPERIA, 7 Y 9 |
MURCIA |
Murcia |
|
BANCO DE SABADELL, S.A. |
5089 |
RD LEVANTE (MURCIA) 000012 |
MURCIA |
Murcia |
|
BANCO CAM, S.A. |
0342 |
SALZILLO, 7 |
MURCIA |
Murcia |
|
BANKINTER, S.A. |
9463 |
AV DE LA LIBERTAD, 6 - 1. |
MURCIA |
Murcia |
Discount facilities: 1
Credit policy: 1
Mortgage loan: 0
Loans with no real security: 0
|
|
|
|
Debt type: Discount
facilities |
Granted limit:30.450.000,00 € Used limit:13.775.432,00
€ Available limit:16.674.568,00
€ Source: Filed
Accounts (2010) |
|
|
|
|
Debt type: Credit policy |
Granted limit:51.230.060,00 € Used limit:32.396.869,00
€ Available limit:18.833.191,00
€ Source: Filed
Accounts (2010) |
|
|
|
Figures given in €
|
ENTITY |
ASSERTS INVOLVED IN THE ACTIVITY |
UP TO 1 YEAR |
FROM 1 TO 5 YEARS |
MORE THAN 5 YEARS |
|
|
construcciones, maquinaria, utillaje, instalaciones tecnicas y otro
inmobilizado material. |
1.307.547,00 |
924.996,00 |
0,00 |
Grants
|
|
|
|
Body-entity: M.INDUSTRIA Y ENERGIA Grant type: Financial
(capital, interests, etc) |
Nominal amount: 96.521,38 € Amount received in the
exercise: 2.735,00 € Amount pending collection:
3.032,00 € Source: Filed
Accounts (2010) |
|
|
|
|
Body-entity: INSTITUTO DE FOMENTO DE LA REG.MURCIA Grant type: Financial
(capital, interests, etc) |
Nominal amount: 24.040,48 € Amount received in the
exercise: 2.100,00 € Amount pending collection:
613,00 € Source: Filed
Accounts (2010) |
|
|
|
|
Body-entity: COMUNIDAD DE MURCIA Grant type: Financial
(capital, interests, etc) |
Nominal amount: 3.538,82 € Amount received in the
exercise: 322,00 € Amount pending collection:
1.071,00 € Source: Filed
Accounts (2010) |
|
|
|
FORMER NAMES:
ANTONIO MUNOZ Y CIA SA
Brand name: WESQUEEZE (Valid)
Type: DENOMINATIVE Scope: COMMUNITARY
Date: 29/06/2012
Brand name: CORA (Valid)
Type: DENOMINATIVE Scope: NATIONAL
Date: 03/04/1996
Brand name: CITROSOL (Valid)
Type: DENOMINATIVE Scope: NATIONAL
Date: 16/06/1995
Brand name: SOL D’ORO (Valid)
Type: DENOMINATIVE Scope: NATIONAL
Date: 09/06/1995
Brand name: COMTESSE WESPAGNE (Valid)
Type: DENOMINATIVE Scope: NATIONAL
Date: 19/10/1994
LEGAL STRUCTURE
Constitution Data
Register Date: 28/12/1950
Legal form: Joint-stock Company
Share capital: 3.952.926,66 €
Obligation to fill in Financial Statements: YES
Chamber census: YES (2010)
B.O.R.M.E. (OFFICIAL GAZETTE OF THE MERCANTILE REGISTER)
![]()
Acts on activity: 0
Acts on administrators: 43 (Last: 07/08/2012, first:
16/05/1990)
Acts on capital: 4 (Last: 17/06/2011, first:
09/01/1997)
Acts on creation: 0
Acts on filed accounts: 30 (Last: 08/09/2011, first:
12/02/1993)
Acts on identification: 1 (Last: 16/03/2007)
Acts on Information: 5 (Last: 26/07/2010, first:
11/01/1993)
Acts on proceedings: 6 (Last: 20/08/2007, first:
30/01/1996)
Latest acts in B.O.R.M.E.
Other acts
|
ACT |
DATE |
NOTICE NUM. |
MERCANTILE REGISTER |
|
Re-elections |
07/08/2012 |
331621 |
Murcia |
|
Annual Filed Accounts (2009) |
08/09/2011 |
460401 |
Murcia |
|
Annual Filed Accounts (2009) consolidated |
08/09/2011 |
460186 |
Murcia |
|
Capital reduction (II) |
17/06/2011 |
23380 |
|
|
Appointments |
23/02/2011 |
82954 |
Murcia |
|
Appointments |
18/11/2010 |
426155 |
Murcia |
|
Meeting notification |
26/07/2010 |
24625 |
|
|
Annual Filed Accounts (2008) consolidated |
13/07/2010 |
237330 |
Murcia |
|
Annual Filed Accounts (2008) |
08/06/2010 |
198278 |
Murcia |
|
Appointments |
16/03/2010 |
110873 |
Murcia |
PRESS ARTICLES 
Press summary by type of information (last five years) ![]()
Legal notices: 3 (Last: 17/06/2011, first: 16/02/2007)
Structural Data: 0
Informative data: 2 (Last: 11/06/2009, first: 11/12/2007)
Financial Information: 1 (Last: 20/05/2010)
Negative information: 0
Business lines: 0
Historical press releases: 15 (Last: 24/02/2003, first:
26/05/1995)
Latest press article published ![]()
17/06/2011 EL PAIS (Page 14) LEGAL
ANNOUNCEMENTS
The Extraordinary Shareholders' General Meeting of
this co., Gathered last 27-05-2011, agreed to reduce its share capital in the
amount of EUR 306,532.01. As a result of the reduction of capital is fixed at
the same amount of 3,952,926.66 euros.
20/05/2010 THE TRUTH - FINANCIAL DATA
POWER COMPANY AND JUICE ANTONIO MUNOZ (AMC), headquartered in ESPINARDO,
expected to grow 20% in 2010 AND BILL 500 MM, 431 AFTER BAGGAGE IN 2009. THE
CIA., Which currently employs 2,200 people, has production facilities in
Murcia, Valencia, and has investments in plantations of South Africa and South
America.
EXPANSION 11/06/2009 - GENERAL INFORMATION
AMC COMPANY CELEBRATES citrus MURCIANA a shareholders 11/06/09. AMC IS LEADER
IN SPAIN in marketing and citrus processing. THE SDAD. About 135 MM INVOICE.
EUROS, BUT THE CONSOLIDATED exceeds 300 MM. The shareholders' meeting should
approve the accounts for the year 2008 (which ended on 8/31/08), although the
existence of differences between the partners could create complications.
EMMTWO FIRM (owned by majority shareholders AMC) TRANSFER IN 2007 TREASURY
SHARES OF SIGNATURE GREEN POLARIS GROUP, A AMC.
FIVE DAYS 11/12/2007 - GENERAL INFORMATION
AMC MURCIANA COMPANY BEFORE Antonio Muñoz y Cia., Exports more than 100,000
tonnes of oranges, clementines and lemons to the 27 European countries, in
addition to other 54 points, mainly the United States and China. AMC HAS
subsidiaries in France, England, America and Canada, and has increased its
volume of production to achieve a turnover of 300 MM. Euros, including foreign
subsidiaries. 3 years ago opened the market in Japan and expected soon enter
China and India.
26/03/2007 THE TRUTH - LEGAL ANNOUNCEMENTS
ON BOARD GRAL. FRESH FOOD GROUP AMC AND JUICES SA (SDAD. ABSORBENT) AND THE
SOCIO UNICO SDADES. THE SAURINES SA; ALBERT FISHER SPECIALS SA; SAN MIGUEL
MUNOZ SL, SL Carrascoy AGRICULTURAL HOLDINGS, SL GLEN BEAS SPECIAL AGRICULTURAL
PRODUCTION AND GLEN AMC SL (SDADES. absorbed) HELD ON 2/28/07 agreed to the
merger by absorption of the BY THE LAST ONE.
Complementary Information
Financial Information
Por causas ajenas a nuestra voluntad el deposito de cuentas del
ejercicio 2002 , se ha recibido erroneamente
Current situation
Según BORME (SECCION SEGUNDA) del 28/03/2007 la sociedad esta en proceso
de absorber a LOS SAURINES SA NIF A30026330, ALBERT FISHER PROCUCCIONES
ESPECIALES SA NIF A81137572, MUNOZ SAN MIGUEL SL NIF B73014995, EXPLOTACIONES
AGRICOLAS CARRASCOY SL NIF B73256059, CANADA DE BEASSL NIF B73256075 Y AMC
PRODUCCIONES AGRICOLAS ESPECIALES CANADA SL NIFB73256067.
FINANCIAL INFORMATION
The information on the last Individual Filed Accounts contained in this
report is extracted from the Mercantile Register file of the legal address of
the Company and dated 09/02/2012.
The shaded amounts in the following financial statements have been
converted to the norms established in the PGC2007 derived from RD 1514/2007 and
1515/2007, this way comparatives could be shown with the amounts of exercises
initiated from 1/01/08.
This theoretical conversion
exercise has been carried out from the financial statements contained in the
accounting information presented on the Mercantile Register, and elaborated
under the accounting norms and principles collected in PGC90 derived from RD
1643/1990, not taking into account any other type of information; for this
reason the conversion exercise could include certain inaccuracies.
SITUATION BALANCE-SHEET
Assets
Figures given in €
|
|
31/08/2010 (12) |
% ASSETS |
31/08/2009 (12) |
% ASSETS |
31/08/2008 (12) |
% ASSETS |
|
A) NON CURRENT ASSETS |
57.018.753,00 |
28,58 |
55.997.677,79 |
28,98 |
57.819.932,22 |
33,36 |
|
I. Intangible assets |
927.256,00 |
0,46 |
768.239,84 |
0,40 |
8.079.510,51 |
4,66 |
|
3. Patents, licences , trademarks and similars |
|
|
3.679,97 |
0,00 |
|
|
|
5. Software |
879.185,00 |
0,44 |
723.852,16 |
0,37 |
|
|
|
6. Investigation |
48.071,00 |
0,02 |
40.707,71 |
0,02 |
|
|
|
II. Tangible fixed assets |
32.165.506,00 |
16,13 |
32.490.463,49 |
16,81 |
30.162.237,14 |
17,40 |
|
1. Property, plant and equipment |
10.808.010,00 |
5,42 |
9.640.354,89 |
4,99 |
|
|
|
2. Technical fittings and other tangible assets |
18.805.802,00 |
9,43 |
17.551.244,10 |
9,08 |
|
|
|
3. Fixed assets in progress and advances |
2.551.694,00 |
1,28 |
5.298.864,50 |
2,74 |
|
|
|
III. Real-estate investments |
6.037.391,00 |
3,03 |
6.135.337,30 |
3,17 |
|
|
|
1. Lands |
1.199.425,00 |
0,60 |
1.195.711,50 |
0,62 |
|
|
|
2. Buildings |
4.837.966,00 |
2,43 |
4.939.625,80 |
2,56 |
|
|
|
IV. Long term investments in associated and affiliated companies |
13.943.582,00 |
6,99 |
14.560.104,66 |
7,53 |
14.560.094,66 |
8,40 |
|
1. Net worth instruments |
13.943.582,00 |
6,99 |
12.026.225,49 |
6,22 |
12.026.215,49 |
6,94 |
|
2. Credits to companies |
|
|
2.533.879,17 |
1,31 |
2.533.879,17 |
1,46 |
|
V. Long Term Financial Investments |
698.308,00 |
0,35 |
534.515,54 |
0,28 |
3.664.240,91 |
2,11 |
|
1. Net worth instruments |
468.865,00 |
0,24 |
505.166,38 |
0,26 |
3.646.098,93 |
2,10 |
|
2. Credits to third parties |
201.694,00 |
0,10 |
1.600,00 |
0,00 |
|
|
|
5. Other financial assets |
|
|
27.749,16 |
0,01 |
18.141,98 |
0,01 |
|
6. Other investments |
27.749,00 |
0,01 |
|
|
|
|
|
VI. Assets by deferred taxes |
3.246.710,00 |
1,63 |
1.509.016,96 |
0,78 |
1.353.849,00 |
0,78 |
|
VII. Non current commercial debts |
|
|
|
|
|
|
|
B) CURRENT ASSETS |
142.455.483,00 |
71,42 |
137.261.747,87 |
71,02 |
115.517.168,41 |
66,64 |
|
I. Non-current assets maintained for sale |
|
|
|
|
|
|
|
II. Stocks |
36.586.606,00 |
18,34 |
37.531.560,03 |
19,42 |
35.131.450,63 |
20,27 |
|
1. Goods available for sale |
908.940,00 |
0,46 |
407.174,00 |
0,21 |
|
|
|
2. Raw material inventory |
27.444.739,00 |
13,76 |
27.973.651,81 |
14,47 |
|
|
|
3. Work in Progress |
190.100,00 |
0,10 |
|
|
|
|
|
b) Short production cycle |
190.100,00 |
0,10 |
|
|
|
|
|
4. Finished goods |
6.160.784,00 |
3,09 |
7.144.238,60 |
3,70 |
|
|
|
b) Short production cycle |
6.160.784,00 |
3,09 |
7.144.238,60 |
3,70 |
|
|
|
6. Pre-payments to suppliers |
1.882.043,00 |
0,94 |
2.006.495,62 |
1,04 |
|
|
|
III. Trade Debtors and other receivable accounts |
49.921.426,00 |
25,03 |
56.382.636,79 |
29,17 |
75.123.672,42 |
43,34 |
|
1. Clients |
31.173.953,00 |
15,63 |
33.506.540,39 |
17,34 |
33.286.523,55 |
19,20 |
|
b) Clients for sales and short term services
rendering |
31.173.953,00 |
15,63 |
33.506.540,39 |
17,34 |
|
|
|
2. Clients group and associated companies |
16.521.212,00 |
8,28 |
19.371.824,14 |
10,02 |
22.617.990,37 |
13,05 |
|
3. Other debts |
265.721,00 |
0,13 |
321.951,08 |
0,17 |
17.661.243,22 |
10,19 |
|
4. Staff |
31.866,00 |
0,02 |
36.682,47 |
0,02 |
33.409,69 |
0,02 |
|
5. Assets by current taxes |
62.997,00 |
0,03 |
|
|
|
|
|
6. Other credits with the Public Administrations |
1.865.677,00 |
0,94 |
3.145.638,71 |
1,63 |
1.524.505,59 |
0,88 |
|
IV. Short term investments in associated and affiliated companies |
24.700.421,00 |
12,38 |
23.184.026,71 |
12,00 |
|
|
|
5. Other financial assets |
24.700.421,00 |
12,38 |
23.184.026,71 |
12,00 |
|
|
|
V. Short term financial investments |
19.655.868,00 |
9,85 |
18.033.771,68 |
9,33 |
3.698.309,79 |
2,13 |
|
1. Net worth instruments |
396.103,00 |
0,20 |
530.297,32 |
0,27 |
3.050.768,35 |
1,76 |
|
2. Credits to companies |
535.000,00 |
0,27 |
535.000,00 |
0,28 |
560.406,66 |
0,32 |
|
5. Other financial assets |
18.724.765,00 |
9,39 |
16.968.474,36 |
8,78 |
87.134,78 |
0,05 |
|
VI. Short term periodifications |
223.553,00 |
0,11 |
245.106,15 |
0,13 |
188.165,68 |
0,11 |
|
VII. Cash and equivalents |
11.367.609,00 |
5,70 |
1.884.646,51 |
0,98 |
1.375.569,89 |
0,79 |
|
1. Treasury |
11.367.609,00 |
5,70 |
1.884.646,51 |
0,98 |
1.375.569,89 |
0,79 |
|
TOTAL ASSETS (A + B) |
199.474.236,00 |
100,00 |
193.259.425,66 |
100,00 |
173.337.100,63 |
100,00 |
Alerts associated to the conversion to PGC2007
![]() In the conversion process
the amount of goods obtained through leasing, that under PGC90 reaches %1 of
the expenses, has been maintained in the item “Intangible Assets”, as it is not
possible to estimate in a precise way its accumulated amortization, as,
according to they nature, they should be registered in the Tangible Assets.
In the conversion process
the amount of goods obtained through leasing, that under PGC90 reaches %1 of
the expenses, has been maintained in the item “Intangible Assets”, as it is not
possible to estimate in a precise way its accumulated amortization, as,
according to they nature, they should be registered in the Tangible Assets.
![]() In the conversion process
part of the item “Property, plant and equipment” that under PGC2007 should be
classified within the item “Real-estate Investments” that in the subsequent
exercise presents a balance of %1.
In the conversion process
part of the item “Property, plant and equipment” that under PGC2007 should be
classified within the item “Real-estate Investments” that in the subsequent
exercise presents a balance of %1.
![]() The valuation norms
applicable to financial instruments has changed substantially and, for this
reason the conversion of financial statements from PGC90 to PGC2007 could
include notable inaccuracy.
The valuation norms
applicable to financial instruments has changed substantially and, for this
reason the conversion of financial statements from PGC90 to PGC2007 could
include notable inaccuracy.
![]() In the conversion process
there could not be identified and, this way reclassify “Assets by deferred
taxes” within the Non current assets that under PGC90 were, generally,
classified in the short term, in accordance with its reversion foreseen date,
and it is collected in the item 11600 “Assets by deferred taxes”, whose amount
reaches %1 in the financial statements prepared under PGC90, classified under
the item “Long term Public Administrations”.
In the conversion process
there could not be identified and, this way reclassify “Assets by deferred
taxes” within the Non current assets that under PGC90 were, generally,
classified in the short term, in accordance with its reversion foreseen date,
and it is collected in the item 11600 “Assets by deferred taxes”, whose amount
reaches %1 in the financial statements prepared under PGC90, classified under
the item “Long term Public Administrations”.
![]() In the conversion process
there has been estimated that the total item 143070 “Provisions on debtors”
according to PGC90, for %1, is associated to “Clients for sales and services
rendering”.
In the conversion process
there has been estimated that the total item 143070 “Provisions on debtors”
according to PGC90, for %1, is associated to “Clients for sales and services
rendering”.
Net Worth and Liabilities
Figures given in €
|
|
31/08/2010 (12) |
% ASSETS |
31/08/2009 (12) |
% ASSETS |
31/08/2008 (12) |
% ASSETS |
|
A) NET WORTH |
73.411.837,00 |
36,80 |
67.425.774,75 |
34,89 |
63.918.766,51 |
36,88 |
|
A-1) Equity |
72.917.845,00 |
36,56 |
66.757.414,68 |
34,54 |
61.893.803,52 |
35,71 |
|
I. Capital |
4.259.459,00 |
2,14 |
4.259.458,67 |
2,20 |
4.259.458,67 |
2,46 |
|
1. Authorized capital |
4.259.459,00 |
2,14 |
4.259.458,67 |
2,20 |
4.259.458,67 |
2,46 |
|
II. Issue premium |
|
|
|
|
|
|
|
III. Reserves |
62.497.956,00 |
31,33 |
58.841.396,26 |
30,45 |
54.803.009,29 |
31,62 |
|
1. Legal and statutory |
946.159,00 |
0,47 |
946.159,44 |
0,49 |
946.159,44 |
0,55 |
|
2. Other funds |
61.551.797,00 |
30,86 |
57.895.236,82 |
29,96 |
53.856.849,85 |
31,07 |
|
IV. (Net worth own shares and participations) |
|
|
|
|
|
|
|
V. Results from previous years |
|
|
|
|
|
|
|
VI. Other loans from partners |
|
|
|
|
|
|
|
VII. Exercise Result |
6.160.430,00 |
3,09 |
3.656.559,75 |
1,89 |
2.831.335,56 |
1,63 |
|
VIII. (Interim dividend) |
|
|
|
|
|
|
|
IX. Other net worth instruments |
|
|
|
|
|
|
|
A-2) Value changes adjustments |
|
|
|
|
1.207.051,41 |
0,70 |
|
I. Financial assets available for sale |
|
|
|
|
|
|
|
II. Coverage operations |
|
|
|
|
|
|
|
III. Non-current assets and related liabilities, maintained for sale |
|
|
|
|
|
|
|
IV. Conversion differences |
|
|
|
|
1.207.051,41 |
0,70 |
|
V. Other |
|
|
|
|
|
|
|
A-3) Received legacies, grants and subventions |
493.992,00 |
0,25 |
668.360,07 |
0,35 |
817.911,58 |
0,47 |
|
B) NON CURRENT LIABILITIES |
15.400.783,00 |
7,72 |
15.939.383,96 |
8,25 |
13.708.278,88 |
7,91 |
|
I. Long term provisions |
|
|
|
|
|
|
|
II. Long term debts |
14.205.433,00 |
7,12 |
14.575.514,91 |
7,54 |
12.294.809,56 |
7,09 |
|
2. Debts with bank entities |
13.032.275,00 |
6,53 |
12.604.623,66 |
6,52 |
9.098.455,32 |
5,25 |
|
3. Financial leasing creditors |
1.107.797,00 |
0,56 |
1.828.296,26 |
0,95 |
2.712.222,67 |
1,56 |
|
5. Other financial liabilities |
65.361,00 |
0,03 |
142.594,99 |
0,07 |
484.131,57 |
0,28 |
|
III. Long term debts with associated and affiliated companies |
|
|
|
|
|
|
|
IV. Liabilities by deferred taxes |
1.195.350,00 |
0,60 |
1.363.869,05 |
0,71 |
1.413.469,32 |
0,82 |
|
V. Long term periodifications |
|
|
|
|
|
|
|
VI. Non current trade creditors |
|
|
|
|
|
|
|
VII. Long term debts with special characteristics |
|
|
|
|
|
|
|
C) CURRENT LIABILITIES |
110.661.616,00 |
55,48 |
109.894.266,95 |
56,86 |
95.710.055,24 |
55,22 |
|
I. Liabilities related with non-current assets maintained for sale |
|
|
|
|
|
|
|
II. Short term provisions |
|
|
636.336,46 |
0,33 |
|
|
|
III. Short term debts |
56.295.134,00 |
28,22 |
52.749.699,04 |
27,29 |
51.714.464,11 |
29,83 |
|
2. Debts with bank entities |
54.986.892,00 |
27,57 |
50.824.699,60 |
26,30 |
49.392.073,28 |
28,49 |
|
3. Financial leasing creditors |
1.307.547,00 |
0,66 |
1.918.370,62 |
0,99 |
2.322.390,83 |
1,34 |
|
5. Other financial liabilities |
695,00 |
0,00 |
6.628,82 |
0,00 |
|
|
|
IV. Short term debts with associated and affiliated companies |
|
|
|
|
|
|
|
V. Trade creditors and other payable accounts |
54.366.482,00 |
27,25 |
56.508.231,45 |
29,24 |
43.995.591,13 |
25,38 |
|
1. Suppliers |
44.020.277,00 |
22,07 |
43.928.669,23 |
22,73 |
30.362.945,03 |
17,52 |
|
b) Short term suppliers |
44.020.277,00 |
22,07 |
43.928.669,23 |
22,73 |
|
|
|
2. Suppliers group and associated companies |
8.303.522,00 |
4,16 |
9.484.747,07 |
4,91 |
10.612.995,44 |
6,12 |
|
3. Different creditors |
84.171,00 |
0,04 |
707.301,84 |
0,37 |
|
|
|
4. Staff (pending remunerations) |
851.956,00 |
0,43 |
648.052,00 |
0,34 |
630.224,17 |
0,36 |
|
5. Liabilities by current taxes |
335.263,00 |
0,17 |
897.910,54 |
0,46 |
|
|
|
6. Other debts with Public Administrations |
771.293,00 |
0,39 |
841.550,77 |
0,44 |
2.389.426,49 |
1,38 |
|
VI. Short term periodifications |
|
|
|
|
|
|
|
VII. Short term debts with special characteristics |
|
|
|
|
|
|
|
TOTAL NET WORTH AND LIABILITIES (A + B + C) |
199.474.236,00 |
100,00 |
193.259.425,66 |
100,00 |
173.337.100,63 |
100,00 |
Alerts associated to the conversion to PGC2007
![]() In the conversion process
there has been made the assumption that the creditors balance with the group
and associated companies have a financial and not commercial character.
In the conversion process
there has been made the assumption that the creditors balance with the group
and associated companies have a financial and not commercial character.
![]() In the conversion process
there has been made the assumption that the creditors balance with the group
and associated companies have a commercial and not financial character.
In the conversion process
there has been made the assumption that the creditors balance with the group
and associated companies have a commercial and not financial character.
![]() In the conversion process it
has not been possible to breakdown the composition of liabilities originated by
debts with the public administrations; for this reason the mentioned amounts
are presented fully aggregated in the item “other debts with the public
administrations”
In the conversion process it
has not been possible to breakdown the composition of liabilities originated by
debts with the public administrations; for this reason the mentioned amounts
are presented fully aggregated in the item “other debts with the public
administrations”
PROFIT AND LOSS ACCOUNT
Figures given in €
|
|
31/08/2010 (12) |
%OPERATING INCOME |
31/08/2009 (12) |
%OPERATING INCOME |
31/08/2008 (12) |
%OPERATING INCOME |
|
A) CONTINUED OPERATIONS |
|
|
|
|
|
|
|
1. Net Turnover |
178.817.716,00 |
95,30 |
165.662.484,54 |
94,92 |
158.429.640,40 |
95,43 |
|
A) Sales |
178.817.716,00 |
95,30 |
165.662.484,54 |
94,92 |
158.429.640,40 |
95,43 |
|
2. Variation in stocks of finished goods and work in progress |
-793.354,00 |
-0,42 |
1.242.209,57 |
0,71 |
1.180.574,21 |
0,71 |
|
3. Works for its own assets |
1.003.838,00 |
0,53 |
930.056,02 |
0,53 |
664.271,82 |
0,40 |
|
4. Supplies |
-112.274.695,00 |
-59,83 |
-96.852.083,29 |
-55,50 |
-99.507.835,83 |
-59,94 |
|
a) Material consumed |
-26.820.579,00 |
-14,29 |
-22.164.146,10 |
-12,70 |
-73.463.090,17 |
-44,25 |
|
b) Raw materials consumed |
-81.587.018,00 |
-43,48 |
-72.410.393,23 |
-41,49 |
-26.044.745,66 |
-15,69 |
|
c) Works carried out for other companies |
-3.867.098,00 |
-2,06 |
-2.277.543,96 |
-1,31 |
|
|
|
5. Other operating income |
7.824.037,00 |
4,17 |
7.928.192,80 |
4,54 |
6.931.091,39 |
4,17 |
|
a) Other incomes |
7.657.642,00 |
4,08 |
7.802.075,96 |
4,47 |
6.609.054,10 |
3,98 |
|
b) Operating grants included in the exercise result |
166.395,00 |
0,09 |
126.116,84 |
0,07 |
322.037,29 |
0,19 |
|
6. Labour cost |
-27.667.377,00 |
-14,74 |
-30.131.185,43 |
-17,27 |
-26.994.218,42 |
-16,26 |
|
a) Wages and similar expenses |
-22.223.224,00 |
-11,84 |
-24.395.747,70 |
-13,98 |
|
|
|
b) Social costs |
-5.444.153,00 |
-2,90 |
-5.735.437,73 |
-3,29 |
|
|
|
7. Other operating costs |
-36.499.930,00 |
-19,45 |
-39.495.551,08 |
-22,63 |
-36.693.193,04 |
-22,10 |
|
a) External services |
-36.122.843,00 |
-19,25 |
-39.077.472,20 |
-22,39 |
-34.386.720,67 |
-20,71 |
|
b) Taxes |
-127.832,00 |
-0,07 |
-244.672,07 |
-0,14 |
-158.421,14 |
-0,10 |
|
c) Losses, deterioration and variation on business operations
provisions |
-249.255,00 |
-0,13 |
-171.289,82 |
-0,10 |
-108.848,89 |
-0,07 |
|
d) Other day to day expenses |
|
|
-2.116,99 |
0,00 |
-2.039.202,34 |
-1,23 |
|
8. Amortization of fixed assets |
-4.388.865,00 |
-2,34 |
-4.143.437,84 |
-2,37 |
-3.952.072,07 |
-2,38 |
|
9. Allocation of subventions on non financial investments and other |
249.098,00 |
0,13 |
255.645,06 |
0,15 |
|
|
|
10. Provisions excess |
|
|
|
|
|
|
|
11. Deterioration and result for fixed assets disposal |
2.340.864,00 |
1,25 |
-46.278,86 |
-0,03 |
8.224.339,77 |
4,95 |
|
b) Results for disposals and others |
2.340.864,00 |
1,25 |
-46.278,86 |
-0,03 |
8.224.339,77 |
4,95 |
|
12. Negative difference of business combinations |
|
|
|
|
|
|
|
13. Other results |
-1.019.185,00 |
-0,54 |
90.977,35 |
0,05 |
|
|
|
A.1) OPERATING RESULT (1 + 2 + 3 + 4 + 5 + 6 + 7 + 8 + 9 + 10 + 11 +
12 + 13) |
7.592.147,00 |
4,05 |
5.441.028,84 |
3,12 |
8.282.598,23 |
4,99 |
|
14. Financial income |
985.773,00 |
0,53 |
2.368.729,19 |
1,36 |
1.986.726,28 |
1,20 |
|
a) From net worth instruments participations |
649.138,00 |
0,35 |
1.659.959,35 |
0,95 |
948.318,82 |
0,57 |
|
a 1) On group and associated companies |
619.070,00 |
0,33 |
1.650.000,00 |
0,95 |
948.318,82 |
0,57 |
|
a 2) On third parties |
30.068,00 |
0,02 |
9.959,35 |
0,01 |
|
|
|
b) From negotiable values and other financial instruments |
336.635,00 |
0,18 |
708.769,84 |
0,41 |
786.766,98 |
0,47 |
|
b 2) From third parties |
336.635,00 |
0,18 |
708.769,84 |
0,41 |
786.766,98 |
0,47 |
|
c) Allocation of financial legacies, grants and subventions |
|
|
|
|
251.640,48 |
0,15 |
|
15. Financial expenses |
-3.492.023,00 |
-1,86 |
-3.987.572,59 |
-2,28 |
-4.729.070,21 |
-2,85 |
|
a) For debts with associated and affiliated companies |
-220.218,00 |
-0,12 |
-401.056,63 |
-0,23 |
|
|
|
b) For debts with third parties |
-3.271.805,00 |
-1,74 |
-3.586.515,96 |
-2,06 |
-4.729.070,21 |
-2,85 |
|
16. Reasonable value variation on financial instruments |
-187.054,00 |
-0,10 |
|
|
|
|
|
a) Negotiation portfolio and others |
-187.054,00 |
-0,10 |
|
|
|
|
|
17. Exchange differences |
-843.484,00 |
-0,45 |
-200.382,63 |
-0,11 |
-1.700.632,69 |
-1,02 |
|
18. Deterioration and result for disposal of financial instruments |
520.905,00 |
0,28 |
-55.808,03 |
-0,03 |
-12.082,79 |
-0,01 |
|
a) Deteriorations and losses |
-618.028,00 |
-0,33 |
-51.175,48 |
-0,03 |
|
|
|
b) Results for disposals and others |
1.138.933,00 |
0,61 |
-4.632,55 |
0,00 |
-12.082,79 |
-0,01 |
|
19. Other financial income and expenses |
|
|
|
|
|
|
|
A.2) FINANCIAL RESULT (14 + 15 + 16 + 17 + 18 + 19) |
-3.015.883,00 |
-1,61 |
-1.875.034,06 |
-1,07 |
-4.455.059,41 |
-2,68 |
|
A.3) RESULT BEFORE TAXES (A.1 + A.2) |
4.576.264,00 |
2,44 |
3.565.994,78 |
2,04 |
3.827.538,82 |
2,31 |
|
20. Taxes on profits |
1.584.166,00 |
0,84 |
90.564,97 |
0,05 |
-996.203,26 |
-0,60 |
|
A.4) EXERCISE RESULT COMING FROM CONTINUED OPERATIONS (A.3 + 20) |
6.160.430,00 |
3,28 |
3.656.559,75 |
2,10 |
2.831.335,56 |
1,71 |
|
B) DISCONTINUED OPERATIONS |
|
|
|
|
|
|
|
21. Net of taxes exercise result coming from discontinued operations |
|
|
|
|
|
|
|
A.5) EXERCISE RESULT (A.4 + 21) |
6.160.430,00 |
3,28 |
3.656.559,75 |
2,10 |
2.831.335,56 |
1,71 |
Alerts associated to the conversion to PGC2007
![]() The valuation norms
applicable to extraordinary results and other exercises ones have changed
substantially and, for this reason the conversion of financial statements of
the formulation exercise of the accounts to PGC2007 could include notable
inaccuracies.
The valuation norms
applicable to extraordinary results and other exercises ones have changed
substantially and, for this reason the conversion of financial statements of
the formulation exercise of the accounts to PGC2007 could include notable
inaccuracies.
![]() The valuation norms
applicable to deteriorations and results for assets disposal have changed
substantially and, for this reason, the conversion of financial statements of
the formulation exercise of the accounts to PGC2007 could include notable
inaccuracies. In the conversion process there have been made the following
assumptions: 1) the total “gains from disposal of fixed assets” corresponds
with results for disposal of fixed assets and not of financial instruments. 2)
no sale of non functional assets derived from discontinued operations has taken
place.
The valuation norms
applicable to deteriorations and results for assets disposal have changed
substantially and, for this reason, the conversion of financial statements of
the formulation exercise of the accounts to PGC2007 could include notable
inaccuracies. In the conversion process there have been made the following
assumptions: 1) the total “gains from disposal of fixed assets” corresponds
with results for disposal of fixed assets and not of financial instruments. 2)
no sale of non functional assets derived from discontinued operations has taken
place.
![]() Valuation norms applicable
to Financial instruments collected in PGC2007 present notable changes with
respect to PGC90. As a consequence, the conversion of the financial statements
of the accounts to PGC2007, carried out considering mainly classification
changes in the accounts might contain certain inaccuracies.
Valuation norms applicable
to Financial instruments collected in PGC2007 present notable changes with
respect to PGC90. As a consequence, the conversion of the financial statements
of the accounts to PGC2007, carried out considering mainly classification
changes in the accounts might contain certain inaccuracies.
![]() In the financial statements
conversion process of the accounts formulation exercise to PGC2007 it could not
be identified the amount of discounts on sales for prompt payment that under
PGC2007 are registered reducing sales and not as a financial expense.
In the financial statements
conversion process of the accounts formulation exercise to PGC2007 it could not
be identified the amount of discounts on sales for prompt payment that under
PGC2007 are registered reducing sales and not as a financial expense.
NET WORTH CHANGES STATUS
Status of recognized income and expenses
Figures given in €
|
NET WORTH CHANGES (1/3) |
31/08/2010 (12) |
31/08/2009 (12) |
|
A) PROFIT AND LOSS ACCOUNT RESULT |
6.160.430,00 |
3.656.559,75 |
|
INCOME AND EXPENSES ALLOCATED DIRECTLY TO NET WORTH |
|
|
|
I. For valuation of financial instruments |
|
|
|
II. Cash flow coverage |
|
|
|
III. Received legacies, grants and subventions |
|
42.000,00 |
|
IV. For actuarial profits and losses and other adjustments |
|
|
|
V. Non-current assets and related liabilities, maintained for sale |
|
|
|
VI. Conversion differences |
|
|
|
VII. Tax effect |
|
-12.600,00 |
|
B) TOTAL INCOME AND EXPENSES ALLOCATED DIRECTLY TO NET WORTH (I + II +
III + IV +V+VI+VII) |
|
29.400,00 |
|
PROFIT AND LOSS ACCOUNT TRANSFERS |
|
|
|
VIII. For valuation of financial instruments |
|
|
|
IX. Cash flow coverage |
|
|
|
X. Received legacies, grants and subventions |
-249.098,00 |
-255.645,06 |
|
XI. Non-current assets and related liabilities, maintained for sale |
|
|
|
XII. Conversion differences |
|
|
|
XIII. Tax effect |
74.729,00 |
76.693,54 |
|
C) TOTAL TRANSFERS TO THE PROFIT AND LOSS ACCOUNT (VIII + IX + X + XI+
XII+ XIII) |
-174.369,00 |
-178.951,52 |
|
TOTAL INCOME AND EXPENSES RECOGNIZED (A + B + C) |
5.986.061,00 |
3.507.008,23 |
Total net worth changes status
Figures given in €
|
NET WORTH CHANGES ( 2 /3) |
AUTHORIZED CAPITAL |
RESERVES |
RESULTS FROM THE EXERCISE |
RECEIVED LEGACIES, GRANTS AND SUBVENTIONS |
|
FINAL ACCOUNT BALANCE OF EXERCISE (2008) |
4.259.458,67 |
56.010.060,70 |
|
|
|
I. Adjustments by change of criteria in the exercise (2008) |
|
|
2.831.335,56 |
817.911,59 |
|
II. Adjustments by errors in the exercise (2008) |
|
|
|
|
|
ADJUSTED ACCOUNT BALANCE, BEGINNING OF EXERCISE (2009) |
4.259.458,67 |
56.010.060,70 |
2.831.335,56 |
817.911,59 |
|
I. Total recognized income and expenses |
|
|
3.656.559,75 |
-149.551,52 |
|
II. Operations with partners or owners |
|
|
|
|
|
III. Other net worth variations |
|
2.831.335,56 |
-2.831.335,56 |
|
|
FINAL ACCOUNT BALANCE OF EXERCISE (2009) |
4.259.458,67 |
58.841.396,26 |
3.656.559,75 |
668.360,07 |
|
FINAL ACCOUNT BALANCE OF EXERCISE (2009) |
4.259.459,00 |
58.841.396,00 |
3.656.560,00 |
668.361,00 |
|
I. Adjustments by change of criteria in the exercise (2009) |
|
|
|
|
|
II. Adjustments by errors in the exercise (2009) |
|
|
|
|
|
ADJUSTED ACCOUNT BALANCE, BEGINNING OF EXERCISE (2010) |
4.259.459,00 |
58.841.396,00 |
3.656.560,00 |
668.361,00 |
|
I. Total recognized income and expenses |
|
|
6.160.430,00 |
-174.369,00 |
|
II. Operations with partners or owners |
|
|
|
|
|
III. Other net worth variations |
|
3.656.560,00 |
-3.656.560,00 |
|
|
FINAL ACCOUNT BALANCE OF EXERCISE (2010) |
4.259.459,00 |
62.497.956,00 |
6.160.430,00 |
493.992,00 |
|
NET WORTH CHANGES ( 3 /3) |
TOTAL |
|
||
|
FINAL ACCOUNT BALANCE OF EXERCISE (2008) |
|
|
||
|
I. Adjustments by change of criteria in the exercise (2008) |
63.918.766,52 |
|
||
|
II. Adjustments by errors in the exercise (2008) |
|
|
||
|
ADJUSTED ACCOUNT BALANCE, BEGINNING OF EXERCISE (2009) |
63.918.766,52 |
|
||
|
I. Total recognized income and expenses |
3.507.008,23 |
|
||
|
II. Operations with partners or owners |
|
|
||
|
III. Other net worth variations |
|
|
||
|
FINAL ACCOUNT BALANCE OF EXERCISE (2009) |
67.425.774,75 |
|
||
|
FINAL ACCOUNT BALANCE OF EXERCISE (2009) |
67.425.776,00 |
|
||
|
I. Adjustments by change of criteria in the exercise (2009) |
|
|
||
|
II. Adjustments by errors in the exercise (2009) |
|
|
||
|
ADJUSTED ACCOUNT BALANCE, BEGINNING OF EXERCISE (2010) |
67.425.776,00 |
|
||
|
I. Total recognized income and expenses |
5.986.061,00 |
|
||
|
II. Operations with partners or owners |
|
|
||
|
III. Other net worth variations |
|
|
||
|
FINAL ACCOUNT BALANCE OF EXERCISE (2010) |
73.411.837,00 |
|
||
CASH FLOW STATUS
Figures given in €
|
|
31/08/2010 (12) |
31/08/2009 (12) |
|
A) CASH FLOW COMING FROM OPERATING ACTIVITIES |
|
|
|
1. exercise result before taxes |
4.576.264,00 |
3.565.994,78 |
|
2. Results adjustments |
3.423.867,00 |
5.809.105,70 |
|
a) Amortization of fixed assets (+) |
4.388.865,00 |
4.143.437,84 |
|
b) Value correction for deterioration (+/-) |
867.283,00 |
|
|
d) Grants allocation (-) |
-249.098,00 |
-255.645,06 |
|
e) Results for decline and disposal of fixed assets (+/-) |
-2.340.864,00 |
46.278,86 |
|
f) Results for decline and disposal of financial instruments (+/-) |
-1.138.933,00 |
55.808,03 |
|
g) Financial income (-) |
-985.773,00 |
-2.368.729,19 |
|
f) Financial expenses (+) |
3.492.023,00 |
3.987.572,59 |
|
i) Change difference (+/-) |
843.484,00 |
200.382,63 |
|
j) Reasonable value variation on financial instruments (+/-) |
187.054,00 |
|
|
k) Other income and expenses (-/+) |
-1.640.174,00 |
|
|
3. Changes in current capital |
10.690.991,00 |
-6.767.265,34 |
|
a) Stocks (+/-) |
944.955,00 |
-2.400.109,40 |
|
b) Debtors and other receivable accounts (+/-) |
12.032.809,00 |
-602.218,09 |
|
c) Other current assets (+/-) |
-19.258,00 |
-19.943.014,32 |
|
d) Creditors and other payable accounts (+/-) |
-2.184.347,00 |
14.196.300,14 |
|
e) Other current liabilities (+/-) |
-5.934,00 |
1.981.776,33 |
|
f) Other non-current assets and liabilities (+/-) |
-77.234,00 |
|
|
4. Other cash flow coming from operating activities |
-3.156.651,00 |
-1.962.165,35 |
|
a) Interests payments (-) |
-3.495.412,00 |
-4.096.633,38 |
|
b) Dividends collections (+) |
649.138,00 |
1.634.190,53 |
|
c) Interests collections (+) |
332.300,00 |
708.769,84 |
|
d) Collections (payments) for profit tax (+/-) |
241.970,00 |
-50.109,71 |
|
e) Other payments (collections) (-/+) |
-884.647,00 |
-158.382,63 |
|
5. Cash flow coming from operating activities (1 + 2 + 3 + 4) |
15.534.471,00 |
645.669,79 |
|
B) CASH FLOW COMING FROM INVESTING ACTIVITIES |
|
|
|
6. Investment payments (-) |
-10.401.722,00 |
-5.397.745,23 |
|
a) Group and associated companies |
-1.520.919,00 |
-10,00 |
|
b) Intangible assets |
-40.120,00 |
-310.542,53 |
|
c) Tangible assets |
-4.277.681,00 |
-4.996.774,19 |
|
d) Real state investments |
-3.714,00 |
-15.511,33 |
|
e) Other financial assets |
-4.559.288,00 |
-74.907,18 |
|
7. Disinvestment collections (+) |
6.866.726,00 |
3.185.450,93 |
|
a) Group and associated companies |
282.545,00 |
|
|
c) Tangible assets |
3.577.541,00 |
27.097,24 |
|
e) Other financial assets |
3.006.640,00 |
3.158.353,69 |
|
8. Cash Flow in investment activities (6 + 7) |
-3.534.996,00 |
-2.212.294,30 |
|
C) CASH FLOW COMING FROM FINANCING ACTIVITIES |
|
|
|
9. Net worth instruments collections and payments |
|
|
|
10. Financial liabilities instruments collections and payments |
-2.516.513,00 |
2.075.701,13 |
|
a) Issue |
10.472.755,00 |
9.128.550,57 |
|
2. Debts with bank entities (+) |
10.472.755,00 |
9.127.550,57 |
|
5. Other debts (+) |
|
1.000,00 |
|
b) Return and amortization of |
-12.989.268,00 |
-7.052.849,44 |
|
2. Debts with bank entities (-) |
-12.989.268,00 |
-6.710.312,86 |
|
5. Other debts (-) |
|
-342.536,58 |
|
11. Payments for dividends and remunerations of other net worth
instruments |
|
|
|
12. Cash Flow in financing activities (9 + 10 + 11) |
-2.516.513,00 |
2.075.701,13 |
|
D) Exchange rate variations effect |
|
|
|
E) NET CASH OR EQUIVALENTS INCREASE / REDUCTION (5 + 8 + 12 + D) |
9.482.962,00 |
509.076,62 |
|
Cash or equivalents at the beginning of the exercise |
1.884.647,00 |
1.375.569,89 |
|
Cash or equivalents at the end of the exercise |
11.367.609,00 |
1.884.646,51 |
RATIOS
|
|
31/08/2010 (12) |
CHANGE % |
31/08/2009 (12) |
CHANGE % |
31/08/2008 (12) |
|
BALANCE RATIOS |
|||||
|
Working Capital (€) |
31.793.867,00 |
16,17 |
27.367.480,92 |
38,17 |
19.807.113,17 |
|
Working capital ratio |
0,16 |
14,29 |
0,14 |
27,27 |
0,11 |
|
Soundness Ratio |
1,28 |
7,56 |
1,19 |
11,21 |
1,07 |
|
Average Collection Period (days) |
100 |
-17,94 |
122 |
-28,27 |
171 |
|
Average Payment Period (days) |
131 |
-11,84 |
149 |
28,17 |
116 |
|
LIQUIDITY RATIOS |
|||||
|
Current Ratio (%) |
128,73 |
3,07 |
124,90 |
3,48 |
120,70 |
|
Quick Ratio (%) |
28,04 |
54,66 |
18,12 |
242,08 |
5,30 |
|
DEBT RATIOS |
|||||
|
Borrowing percentage (%) |
35,34 |
1,44 |
34,84 |
-5,66 |
36,93 |
|
External Financing Average Cost |
0,05 |
-16,67 |
0,06 |
-14,29 |
0,07 |
|
Debt Service Coverage |
4,54 |
-95,65 |
104,27 |
1.004,56 |
9,44 |
|
Interest Coverage |
2,17 |
59,56 |
1,36 |
-22,29 |
1,75 |
|
GENERAL AND ACTIVITIES RATIOS |
|||||
|
Auto financing generated by sales (%) |
8,69 |
2.128,21 |
0,39 |
-90,89 |
4,28 |
|
Auto financing generated by Assets (%) |
7,79 |
2.260,61 |
0,33 |
-91,56 |
3,91 |
|
Breakdown Point |
1,04 |
0,97 |
1,03 |
-2,83 |
1,06 |
|
Average Sales Volume per Employee |
154.699,99 |
14,11 |
135.566,68 |
-2,02 |
138.366,50 |
|
Average Cost per Employee |
23.935,79 |
-2,93 |
24.657,27 |
4,59 |
23.575,74 |
|
Assets Turnover |
0,90 |
4,65 |
0,86 |
-5,49 |
0,91 |
|
Inventory Turnover (days) |
117 |
-15,98 |
140 |
9,92 |
127 |
|
RESULTS RATIOS |
|||||
|
Return on Assets (ROA) (%) |
3,81 |
35,11 |
2,82 |
-41,00 |
4,78 |
|
Operating Profitability (%) |
7,18 |
45,64 |
4,94 |
-58,22 |
11,80 |
|
Return on Equity (ROE) (%) |
6,28 |
17,60 |
5,34 |
-13,59 |
6,18 |
SECTORIAL ANALYSIS
Balance Sheet and Financial Balance
Figures expressed in %
|
|
COMPANY (2010) |
SECTOR |
DIFFERENCE |
|
BALANCE SHEET ANALYSIS: % on the total assets |
|
|
|
|
ASSETS |
|||
|
A) NON CURRENT ASSETS |
28,58 |
53,40 |
-24,81 |
|
A) CURRENT ASSETS |
71,42 |
46,60 |
24,81 |
|
LIABILITIES |
|||
|
A) NET WORTH |
36,80 |
37,21 |
-0,41 |
|
B) NON CURRENT LIABILITIES |
7,72 |
25,19 |
-17,47 |
|
C) CURRENT LIABILITIES |
55,48 |
37,60 |
17,88 |
|
|
|
|
|
Results Analytical Account
Figures given in %
|
|
COMPANY (2010) |
SECTOR |
DIFFERENCE |
|
Net Turnover |
95,30 |
97,56 |
-2,26 |
|
Other operating income |
4,70 |
2,44 |
2,26 |
|
OPERATING INCOME |
100,00 |
100,00 |
0,00 |
|
Supplies |
-59,83 |
-58,14 |
-1,70 |
|
Variation in stocks of finished goods and work in progress |
-0,42 |
2,28 |
-2,70 |
|
GROSS MARGIN |
39,74 |
44,14 |
-4,40 |
|
Other operating costs |
-19,45 |
-22,17 |
2,72 |
|
Labour cost |
-14,74 |
-13,46 |
-1,28 |
|
GROSS OPERATING RESULT |
5,55 |
8,52 |
-2,97 |
|
Amortization of fixed assets |
-2,34 |
-5,03 |
2,69 |
|
Deterioration and result for fixed assets disposal |
1,25 |
-0,07 |
1,32 |
|
Other expenses / income |
|
1,01 |
|
|
NET OPERATING RESULT |
4,05 |
4,42 |
-0,37 |
|
Financial result |
-1,61 |
-1,99 |
0,38 |
|
RESULT BEFORE TAX |
2,44 |
2,43 |
0,01 |
|
Taxes on profits |
0,84 |
-0,30 |
1,14 |
|
RESULT COMING FROM CONTINUED OPERATIONS |
3,28 |
2,13 |
1,15 |
|
Exercise result coming from discontinued operations net of taxes |
|
0,00 |
|
|
NET RESULT |
3,28 |
2,13 |
1,15 |
|
Amortization of fixed assets |
-2,34 |
-5,03 |
2,69 |
|
Deterioration and provisions variation |
-2,47 |
-0,04 |
-2,43 |
|
|
8,09 |
7,20 |
0,89 |
Main Ratios
Figures given in €
|
|
COMPANY (2010) |
PTILE25 |
PTILE50 |
PTILE75 |
|
BALANCE RATIOS |
|
|
|
|
|
Working Capital (€) |
31.793.867,00 |
-147.950,16 |
2.988.864,06 |
7.725.701,07 |
|
Working capital ratio |
0,16 |
-0,02 |
0,07 |
0,32 |
|
Soundness Ratio |
1,28 |
0,37 |
0,78 |
1,67 |
|
Average Collection Period (days) |
100 |
61 |
80 |
106 |
|
Average Payment Period (days) |
131 |
63 |
100 |
116 |
|
LIQUIDITY RATIOS |
|
|
|
|
|
Current Ratio (%) |
128,73 |
90,86 |
121,09 |
187,06 |
|
Quick Ratio (%) |
28,04 |
2,20 |
5,05 |
15,79 |
|
DEBT RATIOS |
|
|
|
|
|
Borrowing percentage (%) |
35,34 |
21,42 |
41,89 |
50,96 |
|
External Financing Average Cost |
0,05 |
0,03 |
0,04 |
0,07 |
|
Debt Service Coverage |
4,54 |
3,62 |
7,76 |
15,00 |
|
Interest Coverage |
2,17 |
1,20 |
2,18 |
4,19 |
|
GENERAL AND ACTIVITIES RATIOS |
|
|
|
|
|
Auto financing generated by sales (%) |
8,69 |
3,92 |
6,08 |
11,03 |
|
Auto financing generated by Assets (%) |
7,79 |
3,30 |
5,05 |
8,88 |
|
Breakdown Point |
1,04 |
1,03 |
1,05 |
1,08 |
|
Average Sales Volume per Employee |
154.699,99 |
170.707,92 |
219.164,92 |
323.386,66 |
|
Average Cost per Employee |
23.935,79 |
23.401,01 |
27.236,69 |
34.479,61 |
|
Assets Turnover |
0,90 |
0,57 |
0,88 |
1,15 |
|
Inventory Turnover (days) |
117 |
63 |
103 |
229 |
|
RESULTS RATIOS |
|
|
|
|
|
Return on Assets (ROA) (%) |
3,81 |
2,78 |
4,00 |
6,44 |
|
Operating Profitability (%) |
7,18 |
5,11 |
7,63 |
10,99 |
|
Return on Equity (ROE) (%) |
6,28 |
2,32 |
6,46 |
13,21 |
FOREIGN EXCHANGE RATES
|
Currency |
Unit
|
Indian Rupees |
|
US Dollar |
1 |
Rs.53.91 |
|
UK Pound |
1 |
Rs.87.60 |
|
Euro |
1 |
Rs.70.01 |
INFORMATION DETAILS
|
Report Prepared
by : |
SDA |
RATING EXPLANATIONS
|
RATING |
STATUS |
PROPOSED CREDIT LINE |
|
|
>86 |
Aaa |
Possesses an extremely sound financial base with the strongest
capability for timely payment of interest and principal sums |
Unlimited |
|
71-85 |
Aa |
Possesses adequate working capital. No caution needed for credit transaction.
It has above average (strong) capability for payment of interest and
principal sums |
Large |
|
56-70 |
A |
Financial & operational base are regarded healthy. General
unfavourable factors will not cause fatal effect. Satisfactory capability for
payment of interest and principal sums |
Fairly Large |
|
41-55 |
Ba |
Overall operation is considered normal. Capable to meet normal
commitments. |
Satisfactory |
|
26-40 |
B |
Capability to overcome financial difficulties seems comparatively below
average. |
Small |
|
11-25 |
Ca |
Adverse factors are apparent. Repayment of interest and principal sums
in default or expected to be in default upon maturity |
Limited with
full security |
|
<10 |
C |
Absolute credit risk exists. Caution needed to be exercised |
Credit not
recommended |
|
---- |
NB |
New Business |
---- |
This score serves as a reference to assess
SC’s credit risk and to set the amount of credit to be extended. It is
calculated from a composite of weighted scores obtained from each of the major
sections of this report. The assessed factors and their relative weights (as
indicated through %) are as follows:
Financial
condition (40%) Ownership
background (20%) Payment
record (10%)
Credit history
(10%) Market trend (10%) Operational size
(10%)
This report is issued at your request without any
risk and responsibility on the part of MIRA INFORM PRIVATE LIMITED (MIPL)
or its officials.