MIRA
INFORM REPORT
|
Report Date : |
26.09.2012 |
IDENTIFICATION DETAILS
|
Name : |
FASHION
HOMETEX CO., LTD |
|
|
|
|
Registered Office : |
|
|
|
|
|
Country : |
|
|
|
|
|
Financials (as on) : |
31.12.2011 |
|
|
|
|
Date of Incorporation : |
25.05.1993 |
|
|
|
|
Com. Reg. No.: |
0105536059687 |
|
|
|
|
Legal Form : |
Private Limited Company |
|
|
|
|
Line of Business : |
Manufacturer, exporter
and distributor of
blankets and other
related products |
|
|
|
|
No. of Employees : |
1000 employees |
RATING & COMMENTS
|
MIRA’s Rating : |
Ba |
|
RATING |
STATUS |
PROPOSED CREDIT LINE |
|
|
41-55 |
Ba |
Overall operation is considered normal. Capable to meet normal
commitments. |
Satisfactory |
|
Status : |
Satisfactory |
|
Payment Behaviour : |
No Complaints |
|
Litigation : |
Clear |
NOTES:
Any query related to this report can be made
on e-mail: infodept@mirainform.com
while quoting report number, name and date.
ECGC Country Risk Classification List – June 30th, 2012
|
Country Name |
Previous Rating (31.03.2012) |
Current Rating (30.06.2012) |
|
Thailand |
B1 |
B1 |
|
Risk Category |
ECGC
Classification |
|
Insignificant |
A1 |
|
Low |
A2 |
|
Moderate |
B1 |
|
High |
B2 |
|
Very High |
C1 |
|
Restricted |
C2 |
|
Off-credit |
D |
thailand - ECONOMIC OVERVIEW
With a well-developed infrastructure, a free-enterprise economy, generally pro-investment policies, and strong export industries, Thailand enjoyed solid growth from 2000 to 2007 - averaging more than 4% per year - as it recovered from the Asian financial crisis of 1997-98. Thai exports - mostly machinery and electronic components, agricultural commodities, and jewelry - continue to drive the economy, accounting for more than half of GDP. The global financial crisis of 2008-09 severely cut Thailand's exports, with most sectors experiencing double-digit drops. In 2009, the economy contracted 2.3%. In 2010, Thailand's economy expanded 7.8%, its fastest pace since 1995, as exports rebounded from their depressed 2009 level. Steady economic growth at just below 4% during the first three quarters of 2011 was interrupted by historic flooding in October and November in the industrial areas north of Bangkok, crippling the manufacturing sector and leading to a revised growth rate of only 0.1% for the year. The industrial sector is poised to recover from the second quarter of 2012 onward, however, and the government anticipates the economy will probably grow between 5.5 and 6.5% for 2012, while private sector forecasts range between 3.8% and 5.7%.
|
Source : CIA |
Company name
FASHION HOMETEX CO., LTD.
SUMMARY
BUSINESS
ADDRESS : 470
BANGKHUNTHIEN-CHAITALAY ROAD,
SAMAEDAM, BANGKHUNTHIEN,
BANGKOK 10150,
THAILAND
TELEPHONE : [66] 2416-1111
FAX :
[66] 2416-6320-2
E-MAIL
ADDRESS : mkt@fashionhometex.com
REGISTRATION
ADDRESS : SAME
AS BUSINESS ADDRESS
ESTABLISHED
: 1993
REGISTRATION
NO. : 0105536059687
TAX
ID NO. : 3011252116
CAPITAL REGISTERED : BHT. 100,000,000
CAPITAL PAID-UP : BHT.
100,000,000
SHAREHOLDER’S PROPORTION : THAI : 100%
FISCAL YEAR CLOSING DATE : DECEMBER 31
LEGAL
STATUS : PRIVATE LIMITED
COMPANY
EXECUTIVE : MRS.
PATCHARAPORN LAOLIKHITNAN, THAI
MANAGING DIRECTOR
NO.
OF STAFF : 1,000
LINES
OF BUSINESS : BLANKETS AND
OTHER RELATED PRODUCTS
MANUFACTURER,
EXPORTER AND DISTRIBUTOR
CORPORATE PROFILE
OPERATING
TREND : STABLE
PRESENT
SITUATION : OPERATING NORMALLY
REPUTATION : GOOD
WITH NORMAL BUSINESS
ENGAGEMENT
MANAGEMENT
STANDARD : MANAGEMENT WITH
GOOD PERFORMANCE
HISTORY
The
subject was established
on May 25,
1993 as a
private limited company under
the originally registered
name “J.S. Socks
Co., Ltd.” by
Thai groups. The subject’s
name was changed
later as follows:
-
“J.S.
Resume Co., Ltd.” on
October 6, 1995
-
“Big
Cat Co., Ltd.”
on
December 2, 1996
-
“Big
Cat [Thailand] Co.,
Ltd.” on September
24, 1997
-
“Big
Cat Blanket Co.,
Ltd.” on October
13, 1999
Eventually,
its name was
changed to FASHION
HOMETEX CO., LTD on
August 9, 2002.
Its business objective
is a manufacturer
of blankets and other
related products for
both domestic and overseas
markets. It currently
employs approximate 1,000
staff.
The subject is an associate of Jong
Stit Co., Ltd., the largest polyester
fiber manufacture in
Thailand.
The
subject’s registered address
is 470 Bangkhunthien-Chaitalay Rd.,
Samaedam, Bangkhunthien, Bangkok
10150, and this
is the subject’s
current operation address.
THE BOARD OF DIRECTOR
|
Name |
|
Nationality |
Age |
|
|
|
|
|
|
Mr. Songkram Chewaprawatdamrong |
[x] |
Thai |
68 |
|
Mrs. Patcharaporn Laolikhitnan |
[x] |
Thai |
64 |
|
Ms. Siriwan Kongkaewrasmee |
|
Thai |
38 |
|
Mrs. Orapan Sathienkij-ampai |
|
Thai |
58 |
AUTHORIZED PERSON
One of the
mentioned directors [x]
can sign or
both of the
rest directors can
jointly sign on
behalf of the
subject with company’s
affixed.
MANAGEMENT
Mrs. Patcharaporn Laolikhitnan is
the Managing Director.
She is Thai
nationality with the
age of 64
years old.
BUSINESS OPERATIONS
The subject
is engaged in
various kinds of
blankets and other
related products, such
as Baby Blankets,
Fleece Blankets & Throw, Printed
Blankets, Yarn Dyed
Stripe Blanket, Chenille
Blankets, Velour Blankets,
Sherpa Throw, Jacquard
Blanket, Faux Fur
Throw, camping, cushion
and curtain under
various brands such
as “BIG CAT”,
“BANANA”, “HAPPY HOME”,
“AUTUMN MIST”, “POLYWU”
and “POLUX”.
PURCHASE
100% of its
raw materials is
purchased from local
suppliers.
MAJOR
SUPPLIERS
Jong
Stit Co., Ltd. : Thailand
Thai
Polyester Co., Ltd. : Thailand
SALES
80% of the
products is exported
to U.S.A., Canada,
and the countries
in Europe, Asia
and Africa, the
remaining 20% is
sold locally.
ASSOCIATED COMPANIES
Thai Polyester Co.,
Ltd.
Business Type :
Manufacturer and distributor
of polyester yarns.
Jong Stit Co.,
Ltd.
Business Type :
Manufacturer and distributor
of fabric products.
Fashino Co., Ltd.
Business Type :
Manufacturer and distributor
of garment.
LITIGATION
Bankruptcy
and Receivership
There are no
litigation on bankruptcy
and receivership cases
filed against the
subject found at
Legal Execution Department
for the past
five years.
Others
There are no
legal suits filed
against the subject
for the past two
years.
CREDIT
Sales are by
cash or on
the credits term
of 30-60 days.
Local bills are
paid by cash
or on the
credits term of
30-60 days.
Exports are against
T/T.
BANKING
Kasikornbank
Public Co., Ltd.
EMPLOYMENT
The
subject currently employs
approximately 1,000 office
staff and factory
workers.
LOCATION
DETAILS
The
premise is owned for
administrative office at
the heading address.
Premise is located
in commercial/residential area.
Factory
and warehouse are
located at 136/4
Moo 1, Soi Wat
Phojae, Ekachai Rd.,
T. Khaerai, A. Krathumban, Samutsakorn
74110. Tel.: [66]
34 852-401-5, Fax:
[66] 34 852-572.
Branch:
993
Bangkhunthien-Chaitalay Rd., Samaedam,
Bangkhunthien, Bangkok 10150.
COMMENT
The subject’s activity
is a producer various
kinds of blankets
with highest quality.
Other than blankets,
the subject also
produces varieties of
household fabric products
to satisfy both
local and overseas
markets. Its products
are well-known and
widely accepted with
the sales increase
on a yearly basis.
Its business is
promising and growing
steadily.
FINANCIAL INFORMATION
The
capital was registered
at Bht. 30,000,000
divided into 300,000
shares of Bht.
100 each with
fully paid.
The
capital was increased
and decreased later
as follows:
Bht. 50,000,000
on July 13,
1995
Bht. 60,000,000
on December 9,
1998
Bht. 15,000,000
on May 13,
2004 [decreased]
Bht. 100,000,000
on August 17,
2004 [increased]
The
latest registered capital
was increased to
Bht. 100 million, divided into
1,000,000 shares of
Bht. 100 each with
fully paid.
THE
SHAREHOLDERS LISTED WERE
: [as at
April 12, 2012]
|
NAME |
HOLDING |
% |
|
|
|
|
|
Mrs. Patcharaporn Laolikhitnan Nationality: Thai Address : 33
Moo 1, Bangkhunthien-Chaitalay Rd.,
Samaedam, Bangkhunthien, Bangkok
10150 |
999,994 |
100.00 |
|
Mr. Prasert Chaikanchanasak Nationality: Thai Address : 64/1
Sukhumvit 71 Rd.,
Prakanongnua,
Wattana, Bangkok 10110
|
1 |
- |
|
Mrs. Orapan Sathienkij-ampai Nationality: Thai Address : 482
Moo 18, Bangpueng,
Phrapradaeng,
Samutprakarn 10130 |
1 |
- |
|
Ms. Napaporn Karuhamas Nationality: Thai Address : 396/5
Mahachai Rd., Samranraj,
Phranakorn, Bangkok 10200 |
1 |
- |
|
Mrs. Suwannee Thepsuwanvorn Nationality: Thai Address : 15/60
Moo 7, Kanchanapisek Rd.,
Bangkae,
Bangkok 10160 |
1 |
- |
|
Mrs. Vimol Patipanthewa Nationality: Thai Address :
93/282 Moo 2,
Prachauthis Rd.,
Thungkru, Bangkok 10140 |
1 |
- |
|
Mr. Torpong Chewaprawatdamrong Nationality: Thai Address : 55
Moo 6, Rama
2 Rd., Samaedam,
Bangkhunthien, Bangkok 10150 |
1 |
- |
Total Shareholders : 7
Share Structure [as
at April 12,
2012]
|
Nationality |
Shareholders |
No. of Share |
% Shares |
|
|
|
|
|
|
Thai |
7 |
1,000,000 |
100.00 |
|
Foreign |
- |
- |
- |
|
Total |
7 |
1,000,000 |
100.00 |
NAME OF AUDITOR
& CERTIFIED PUBLIC
ACCOUNTANT NO. :
Mrs. Cholthicha Leelapanang No.
1815
BALANCE SHEET [BAHT]
The
latest financial figures
published for December
31, 2011 &
2010 were:
ASSETS
|
Current Assets |
2011 |
2010 |
|
|
|
|
|
Cash and Cash Equivalents |
4,124,285.73 |
2,987,174.91 |
|
Trade Accounts & Other Receivable |
121,793,579.02 |
80,254,166.76 |
|
Inventories |
72,300,545.26 |
45,440,037.86 |
|
Other Current Assets
|
9,468,928.83 |
8,074,666.15 |
|
|
|
|
|
Total Current Assets
|
207,687,338.84 |
136,756,045.68 |
|
|
|
|
|
Fixed Assets |
68,119,166.74 |
69,871,548.34 |
|
Other Non-current Assets |
6,263.31 |
8,263.15 |
|
Total Assets |
275,812,768.89 |
206,635,857.17 |
LIABILITIES &
SHAREHOLDERS’ EQUITY [BAHT]
|
Current
Liabilities |
2011 |
2010 |
|
|
|
|
|
Trade Accounts & Other Payable |
154,925,273.18 |
87,913,721.63 |
|
Accrued Income Tax |
51,012.07 |
56,718.85 |
|
Other Current Liabilities |
10,801,033.51 |
9,751,171.83 |
|
|
|
|
|
Total Current Liabilities |
165,777,318.76 |
97,721,612.31 |
|
Total Liabilities |
165,777,318.76 |
97,721,612.31 |
|
|
|
|
|
Shareholders' Equity |
|
|
|
|
|
|
|
Share capital : Baht 100
value authorized, issued
and fully paid share
capital 1,000,000 shares |
100,000,000.00 |
100,000,000.00 |
|
|
|
|
|
Capital Paid |
100,000,000.00 |
100,000,000.00 |
|
Retained Earning - Unappropriated |
10,035,450.13 |
8,914,244.86 |
|
Total Shareholders' Equity |
110,035,450.13 |
108,914,244.86 |
|
Total Liabilities & Shareholders' Equity |
275,812,768.89 |
206,635,857.17 |
PROFIT &
LOSS ACCOUNT
|
Revenue |
2011 |
2010 |
|
|
|
|
|
Sales |
720,342,946.59 |
526,420,318.46 |
|
Tax Compensation Income |
5,810,795.84 |
2,519,820.59 |
|
Gain on Exchange Rate |
1,169,784.57 |
540,505.31 |
|
Gain on Disposal
of Assets |
15,240.48 |
107,784.08 |
|
Interest Income |
5,387.88 |
3,329.68 |
|
Other Income |
1,527,615.53 |
1,096,395.42 |
|
Total Revenues |
728,871,320.89 |
530,688,153.54 |
|
Expenses |
|
|
|
|
|
|
|
Cost of Goods
Sold & Services
|
709,947,659.75 |
506,089,231.41 |
|
Selling Expenses |
14,301,785.55 |
20,794,152.27 |
|
Administrative Expenses |
2,085,453.14 |
1,845,457.72 |
|
Total Expenses |
726,334,898.44 |
528,728,841.40 |
|
|
|
|
|
Profit before Financial Costs &
Income Tax |
2,536,422.45 |
1,959,312.14 |
|
Financial Costs |
[990,461.88] |
[757,098.13] |
|
|
|
|
|
Profit before Income Tax |
1,545,960.57 |
1,202,214.01 |
|
Income Tax |
[424,755.30] |
[384,642.35] |
|
Net Profit / [Loss] |
1,121,205.27 |
817,571.66 |
FINANCIAL ANALYSIS
|
ITEM |
UNIT |
2011 |
2010 |
|
|
|
|
|
|
LIQUIDITY RATIO |
|
|
|
|
CURRENT RATIO |
TIMES |
1.25 |
1.40 |
|
QUICK RATIO |
TIMES |
0.76 |
0.85 |
|
|
|
|
|
|
ACTIVITY RATIO |
|
|
|
|
FIXED ASSETS TURNOVER |
TIMES |
10.57 |
7.53 |
|
TOTAL ASSETS TURNOVER |
TIMES |
2.61 |
2.55 |
|
INVENTORY CONVERSION PERIOD |
DAYS |
37.17 |
32.77 |
|
INVENTORY TURNOVER |
TIMES |
9.82 |
11.14 |
|
RECEIVABLES CONVERSION PERIOD |
DAYS |
61.71 |
55.65 |
|
RECEIVABLES TURNOVER |
TIMES |
5.91 |
6.56 |
|
PAYABLES CONVERSION PERIOD |
DAYS |
79.65 |
63.40 |
|
CASH CONVERSION CYCLE |
DAYS |
19.23 |
25.01 |
|
|
|
|
|
|
PROFITABILITY
RATIO |
|
|
|
|
COST OF GOODS SOLD |
% |
98.56 |
96.14 |
|
SELLING & ADMINISTRATION |
% |
2.27 |
4.30 |
|
INTEREST |
% |
0.14 |
0.14 |
|
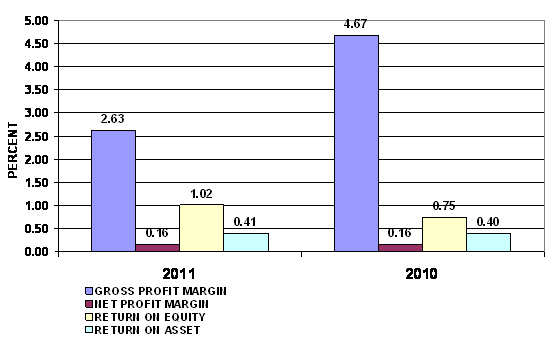
GROSS PROFIT MARGIN |
% |
2.63 |
4.67 |
|
NET PROFIT MARGIN BEFORE EX. ITEM |
% |
0.35 |
0.37 |
|
NET PROFIT MARGIN |
% |
0.16 |
0.16 |
|
RETURN ON EQUITY |
% |
1.02 |
0.75 |
|
RETURN ON ASSET |
% |
0.41 |
0.40 |
|
EARNING PER SHARE |
BAHT |
1.12 |
0.82 |
|
|
|
|
|
|
LEVERAGE RATIO |
|
|
|
|
DEBT RATIO |
TIMES |
0.60 |
0.47 |
|
DEBT TO EQUITY RATIO |
TIMES |
1.51 |
0.90 |
|
TIME INTEREST EARNED |
TIMES |
2.56 |
2.59 |
|
|
|
|
|
|
ANNUAL GROWTH |
|
|
|
|
SALES GROWTH |
% |
36.84 |
|
|
OPERATING PROFIT |
% |
29.45 |
|
|
NET PROFIT |
% |
37.14 |
|
|
FIXED ASSETS |
% |
(2.51) |
|
|
TOTAL ASSETS |
% |
33.48 |
|
PROFITABILITY
RATIO
|
Gross Profit Margin |
2.63 |
Deteriorated |
Industrial Average |
17.54 |
|
Net Profit Margin |
0.16 |
Deteriorated |
Industrial Average |
1.20 |
|
Return on Assets |
0.41 |
Deteriorated |
Industrial Average |
1.11 |
|
Return on Equity |
1.02 |
Deteriorated |
Industrial Average |
2.92 |
Gross Profit Margin used to assess a firm's financial health by revealing
the proportion of money left over from revenues after accounting for the cost
of goods sold. Gross profit margin serves as the source for paying additional
expenses and future savings. The company's figure is 2.63%. When compared with
the industry average, the ratio of the company was lower. This indicated that
company was originated from the problems with control over its costs.
Net Profit Margin is the indicator of the company's efficiency in that net
profit takes into consideration all expenses of the company. A low profit
margin indicates a low margin of safety, higher risk that a decline in sales
will erase profits and result in a net loss. The company's figure is 0.16%.
When compared with the industry average, the ratio of the company was lower.
Return on Assets measures how efficiently profits are being generated
from the assets employed in the business when compared with the ratios of firms
in a similar business. A low ratio in comparison with industry averages
indicates an inefficient use of business assets. When compared with the
industry average, it was lower, the company's figure is 0.41%.
Return on Equity indicates how profitable a company is by comparing its
net income to its average shareholders' equity, ROE measures how much the
shareholders earned for their investment in the company. When compared with the
industry average, it was lower, the company's figure is 1.02%.
Trend of the
average competitors in the same industry for last 5 years
Return on Assets Uptrend
Return on Equity Uptrend
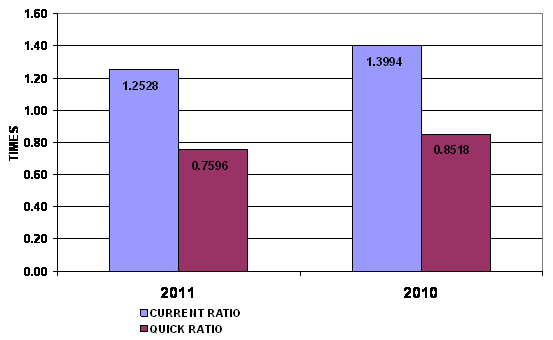
LIQUIDITY RATIO
|
Current Ratio |
1.25 |
Satisfactory |
Industrial Average |
1.32 |
|
Quick Ratio |
0.76 |
|
|
|
|
Cash Conversion Cycle |
19.23 |
|
|
|
The Current Ratio is to ascertain whether a company's short-term assets
are readily available to pay off its short-term liabilities. The company's
figure is 1.25 times in 2011, decrease from 1.4 times, then it is generally
considered to have good short-term financial strength. When compared with the
industry average, the ratio of the company was lower.
The Quick Ratio is a liquidity indicator that further refines the
current ratio by measuring the amount of the most liquid current assets there
are to cover current liabilities. The company's figure is 0.76 times in 2011,
decrease from 0.85 times, then the company has not enough current assets that
presumably can be quickly converted to cash for pay financial obligations.
The Cash Conversion Cycle measures the number of days a company's cash
is tied up in the production and sales process of its operations and the
benefit from payment terms from its creditors. It meant the company could
survive when no cash inflow was received from sale for 20 days.
Trend of the
average competitors in the same industry for last 5 years
Current Ratio Downtrend


LEVERAGE RATIO
|
Debt Ratio |
0.60 |
Acceptable |
Industrial Average |
0.58 |
|
Debt to Equity Ratio |
1.51 |
Risky |
Industrial Average |
1.43 |
|
Times Interest Earned |
2.56 |
Impressive |
Industrial Average |
1.48 |
Debt to Equity Ratio a measurement of how much suppliers, lenders,
creditors and obligors have committed to the company versus what the shareholders
have committed. A lower the percentage means that the company is using less
leverage and has a stronger equity position.
Times Interest Earned measuring a company's ability to meet its debt
obligations. Ratio is 2.57 higher than 1, so the company can pay interest
expenses on outstanding debt.
Debt Ratio shows the proportion of a company's assets which are financed
through debt. The company's figure is 0.6 greater than 0.5, most of the
company's assets are financed through debt.
Trend of the average
competitors in the same industry for last 5 years
Debt Ratio Downtrend
Times Interest Earned Uptrend

ACTIVITY RATIO
|
Fixed Assets Turnover |
10.57 |
Impressive |
Industrial Average |
2.16 |
|
Total Assets Turnover |
2.61 |
Impressive |
Industrial Average |
0.92 |
|
Inventory Conversion Period |
37.17 |
|
|
|
|
Inventory Turnover |
9.82 |
Impressive |
Industrial Average |
2.59 |
|
Receivables Conversion Period |
61.71 |
|
|
|
|
Receivables Turnover |
5.91 |
Impressive |
Industrial Average |
3.07 |
|
Payables Conversion Period |
79.65 |
|
|
|
Trend of the
average competitors in the same industry for last 5 years
Fixed Assets Turnover Downtrend
Total Assets Turnover Downtrend
Inventory Turnover Uptrend
Receivables Turnover Downtrend
FOREIGN EXCHANGE RATES
|
Currency |
Unit
|
Indian Rupees |
|
US Dollar |
1 |
Rs.53.53 |
|
UK Pound |
1 |
Rs.86.82 |
|
Euro |
1 |
Rs.69.03 |
INFORMATION DETAILS
|
Report Prepared
by : |
MNL |
RATING EXPLANATIONS
|
RATING |
STATUS |
PROPOSED CREDIT LINE |
|
|
>86 |
Aaa |
Possesses an extremely sound financial base with the strongest
capability for timely payment of interest and principal sums |
Unlimited |
|
71-85 |
Aa |
Possesses adequate working capital. No caution needed for credit
transaction. It has above average (strong) capability for payment of interest
and principal sums |
Large |
|
56-70 |
A |
Financial & operational base are regarded healthy. General unfavourable
factors will not cause fatal effect. Satisfactory capability for payment of
interest and principal sums |
Fairly Large |
|
41-55 |
Ba |
Overall operation is considered normal. Capable to meet normal
commitments. |
Satisfactory |
|
26-40 |
B |
Capability to overcome financial difficulties seems comparatively
below average. |
Small |
|
11-25 |
Ca |
Adverse factors are apparent. Repayment of interest and principal sums
in default or expected to be in default upon maturity |
Limited with full
security |
|
<10 |
C |
Absolute credit risk exists. Caution needed to be exercised |
Credit not
recommended |
|
---- |
NB |
New Business |
---- |
This score serves as a reference to assess SC’s credit risk and
to set the amount of credit to be extended. It is calculated from a composite
of weighted scores obtained from each of the major sections of this report. The
assessed factors and their relative weights (as indicated through %) are as
follows:
Financial
condition (40%) Ownership
background (20%) Payment
record (10%)
Credit history
(10%) Market trend
(10%) Operational
size (10%)
This report is issued at your request without any
risk and responsibility on the part of MIRA INFORM PRIVATE LIMITED (MIPL) or
its officials.