MIRA
INFORM REPORT
|
Report Date : |
29.09.2012 |
IDENTIFICATION DETAILS
|
Name : |
MEGA LIFESCIENCES LIMITED |
|
|
|
|
|
|
Formerly Known As : |
MEDICAP LIMITED |
|
|
|
|
|
|
Registered Office : |
384 Moo 4, Soi 6, Pattana 3 Road, Bangpoo Industrial Estate, T. Praeksa, A. Muang, Samutprakarn 10280 |
|
|
|
|
|
|
Country : |
|
|
|
|
|
|
|
Financials (as on) : |
31.12.2011 |
|
|
|
|
|
|
Date of Incorporation : |
15.01.1982 |
|
|
|
|
|
|
Com. Reg. No.: |
0105525001721 |
|
|
|
|
|
|
Legal Form : |
Private Limited Company |
|
|
|
|
|
|
Line of Business : |
Manufacturer, Contractor & Exporter of Soft Gelatin Capsules |
|
|
|
|
|
|
No. of Employees : |
900 |
|
RATING & COMMENTS
|
MIRA’s Rating : |
Ba |
|
RATING |
STATUS |
PROPOSED CREDIT LINE |
|
|
41-55 |
Ba |
Overall operation is considered normal. Capable to meet normal
commitments. |
Satisfactory |
|
Status : |
Satisfactory |
|
Payment Behaviour : |
Regular |
|
Litigation : |
Clear |
NOTES :
Any query related to this report can be made
on e-mail: infodept@mirainform.com
while quoting report number, name and date.
ECGC Country Risk Classification List – June 30th, 2012
|
Country Name |
Previous Rating (31.03.2011) |
Current Rating (30.06.2012) |
|
|
B1 |
B1 |
|
Risk Category |
ECGC
Classification |
|
Insignificant |
A1 |
|
Low |
A2 |
|
Moderate |
B1 |
|
High |
B2 |
|
Very High |
C1 |
|
Restricted |
C2 |
|
Off-credit |
D |
With a well-developed
infrastructure, a free-enterprise economy, generally pro-investment policies,
and strong export industries,
Source
: CIA
Company name
MEGA
LIFESCIENCES LIMITED
[FORMER : MEDICAP LIMITED]
SUMMARY
BUSINESS
ADDRESS : 384
MOO 4, SOI
6, PATTANA 3
ROAD,
BANGPOO INDUSTRIAL
ESTATE,
T. PRAEKSA,
A. MUANG,
SAMUTPRAKARN 10280
TELEPHONE : [66] 2324-0681,
2709-3600-4
FAX : [66] 2324-0451,
2324-0537
E-MAIL
ADDRESS : info.th@megawecare.com
info@medicapltd.com
REGISTRATION
ADDRESS : SAME
AS BUSINESS ADDRESS
ESTABLISHED
: 1982
REGISTRATION
NO. : 0105525001721
[Former : 172/2525]
TAX
ID NO. : 3101206166
CAPITAL REGISTERED : BHT. 67,056,190
CAPITAL PAID-UP : BHT.
67,056,190
SHAREHOLDER’S PROPORTION : THAI :
88.39%
FOREIGN :
11.61%
FISCALYEAR CLOSING DATE : DECEMBER
31
LEGAL
STATUS : PRIVATE
LIMITED COMPANY
EXECUTIVE
: MR.
VIVEK DHAWAN, THAI
CHIEF EXECUTIVE
OFFICER
NO.
OF STAFF : 900
LINES
OF BUSINESS : SOFT
GELATIN CAPSULES
MANUFACTURER,
CONTRACTOR & EXPORTER
CORPORATE PROFILE
OPERATING
TREND : STABLE
PRESENT
SITUATION : OPERATING
NORMALLY
REPUTATION : GOOD
WITH
MANAGEMENT
STANDARD : MANAGEMENT
WITH GOOD PERFORMANCE
HISTORY
The subject was
established on January
15, 1982 as
a private limited
company under the registered name “Vidas Ltd.” by
Thai-Indian groups, in order
to bring new
technology in Thailand
for manufacturing Soft
Gelatin Capsules.
Later, the name
was changed to “Medicap Limited”
and “Mega Lifesciences
Limited” on October 15, 1982 and August 15, 2005, respectively.
It currently employs
approximate 900 staff.
At present, the
subject is a
subsidiary of Unistretch
Co., Ltd., Thailand,
which is holding
around 73.23% of
the total shares.
The subject now
ranks among the
world class producers
of pharmaceutical, health
food supplements, herbal
products, vitamins &
minerals and cosmetic
products in the
dosage form. It is
also a member
of Pharmaceutical Producers
Association [PPA].
The subject’s registered
address is 384
Moo 4, Soi
6, Pattana 3
Rd., Bangpoo Industrial
Estate, T. Praeksa, A. Muang,
Samutprakarn 10280, and
this is the
subject’s current operation
address.
AWARD AND QUALITY
: Certified by
· TGA -
· FDA -
· Danish Health
Authorities
· ISO 9002
THE BOARD
OF DIRECTORS
|
Name |
|
Nationality |
Age |
|
|
|
|
|
|
Ms. Nishita Shah |
[x] |
Indian |
32 |
|
Mr. Vivek Dhawan
|
[x] : Chairman |
Thai |
51 |
|
Mr. Thomas Abraham |
|
Indian |
50 |
|
Mr. Apichai Chancharusiri |
|
Thai |
57 |
|
Mr. Paramjit Singh Sawney |
|
Indian |
47 |
|
Mr. Sudhir Gandhi |
|
Indian |
49 |
AUTHORIZED PERSON
One of the
above directors [x]
can sign or
two of the
rest directors can
jointly sign on behalf
of the subject
with company’s affixed.
MANAGEMENT
Mr. Vivek Dhawan
is the Chief
Executive Office
He is Thai
nationality with the
age of 51
years old.
Mr. Thomas Abrahim is
the Chief Finance
Officer.
He is Indian
nationality with the
age of 50
years old.
Mr. Apichai Chancharusiri is
the Operation Director.
He is Thai
nationality with the
age of 57
years old.
Mrs. Kuankam Kiatcharoenpol is
the Marketing Manager.
She is Thai
nationality.
Mr. Reddy Jonnala Venkatahubba is
the Supply Chain
Director.
He is Indian
nationality.
Mr. Rakesh Pai is
the Business Development
Manager.
He is Indian
nationality.
Mr. Rahul Deore is
the Product Development
Manager.
He is Indian
nationality.
Mr. Manit Kawa
is the Account
Manager.
He is Indian
nationality.
Ms. Chintana Luenglungjakorn is
the Purchasing Manager.
She is Thai
nationality.
Mr. Pornchai Wongpayak is
the Q.C. Director.
He is Thai nationality.
Mr. Snehal Mehta is
the Q.A. & Regulatory Affairs
Director.
He is Indian
nationality.
BUSINESS OPERATIONS
The subject’s activity
is a manufacturer
and contractor of
soft gelatin capsules
medicines and related
products, which has
five lines of
businesses, comprising drugs and
pharmaceuticals [20%], vitamin
and mineral supplements
[30%], health foods
and supplements [30%],
herbal preparations [15%]
and cosmetics [5%]
respectively.
Medicap has successfully developed
innovative dosage forms
such as “Emulcap”,
“Clearcap” and “Actisome”.
These are regarded
as new landmarks
in alternate medicine
increasing bio-absorption and
efficacy.
The products are
as followings:
· Multivitamins & Minerals
· Liver Cares
& Hepatic Product
· Behaviour Modifiers
· Heart Care
& Circulatory Disorders
· Women Formula
· Food Supplements
· Memory Booster &
Brain Tonics
· Slimming Formulas
· Headache and
Migrain
· Immunity Enhancers & Modulators
· Tonics &
Energy Boosters
· Antioxidants
· Prostate Care
· Cod Liver Oil
· Cosmetics
MAJOR BRANDS
|
“SCOTT’S” - Cod Liver Oil |
Customer’s Brand |
|
“MEDICRAFTS”, |
Customer’s Brand |
|
“MISTINE”, |
Customer’s Brand |
|
“GIFFARINE” - Evening Primrose Oil |
Customer’s Brand |
|
“IMUGINS” - Schumit Ginseng |
Customer’s Brand |
|
“GR 150” -
Schumit Ginseng |
Customer’s Brand |
|
“ROCHE” - Cough
Medicine |
Customer’s Brand |
|
“SMITH K-TINE” |
Customer’s Brand |
|
“BEECHAM” - Fish
Liver Oil |
Customer’s Brand |
|
“LYNAC” |
Customer’s Brand |
|
etc. |
|
TRADEMARK
“NATURAL CARE”
PRODUCTION
1.5 billion capsules/annum
IMPORT [COUNTRIES]
90% of raw
materials and chemicals
are imported from
Japan, Korea, Hong Kong,
India, Republic of China,
Singapore, France, Australia,
United Kingdom, Germany,
United States of
America and Taiwan.
MAJOR SUPPLIERS
|
Name |
Country |
Products |
|
|
|
|
|
Roche [Thailand] Co., Ltd. |
Thailand |
Chemicals |
|
Sanofi [T] Ltd. |
Thailand |
Chemicals |
|
B.A.S.F. [Thai] Co., Ltd. |
Thailand |
Chemicals |
|
Medicap Pharmacies Inc. |
U.S.A. |
Chemicals |
|
Mega Lifesciences
[Australia] Pty. Ltd. |
Australia |
Chemicals |
EXPORT [COUNTRIES]
80% of the
products is exported
to Hong Kong,
Africa, Australia, Denmark,
Singapore, Philippines, United
States of America, United Kingdom, India,
Taiwan, Japan, Korea, Canada,
New Zealand, Republic
of China, Yemen,
Nigeria, Cambodia, Vietnam,
Laos, Indonesia, Sri
Lanka, Malaysia and
Myanmar.
SALES [LOCAL]
20% of its
products is sold
locally to manufacturers, wholesalers,
Thai Government and
end-users.
MAJOR CUSTOMERS
|
Name |
Country |
|
|
|
|
Smithkline and Beecham |
Singapore |
|
Pan Laboratories |
Australia |
|
Berlin Pharmaceutical Co., Ltd. |
Thailand |
|
Bioconcept Co., Ltd. |
Thailand |
|
Mega Products Co.,
Ltd. |
Thailand |
|
Roche [Thailand] Co.,
Ltd. |
Thailand |
|
Sky Line Unity
Co., Ltd. |
Thailand |
|
Betterway [Thailand] Co.,
Ltd. |
Thailand |
|
Ceutic Co., Ltd. |
Thailand |
|
Mega Lifesciences Pty
Ltd. |
Australia |
|
Mega Products [Vietnam]
Ltd. |
Vietnam |
|
Mega Products [Myanmar]
Ltd. |
Myanmar |
PARENT COMPANY
Unistretch Co., Ltd.
Address : 8/23, 8/35-38, Cathey
House, North Sathorn
Rd., Bangrak, Bangkok
10500
SUBSIDIARIES &
AFFILIATED COMPANIES
Natural Health Foods
Co., Ltd.
Business Type: Distributor
of health food
products
Investment :
99.99 % held by
the subject.
Mega We Care Co., Ltd.
Business Type: Distributor
of health food
products
Investment :
99.96 % held by
the subject.
Mega Lifescience Pty.
Ltd.
Business Type: Distributor
of pharmaceutical and
health products
Investment :
99.99 % held by
the subject.
LITIGATION
Bankruptcy and Receivership
There are no
litigation on bankruptcy
and receivership cases
filed against the
subject found at
Legal Execution Department
for the past
five years.
Others
There are no
legal suits filed
against the subject
for the past
two years.
CREDIT
Sales are by
cash or on
the credits term
of 30-60 days.
Local bills are
paid by cash
or on the
credits term of
30-60 days.
Imports are by
L/C at sight
or T/T.
Exports are against
L/C at sight
or T/T.
BANKING
Bangkok Bank Public
Co., Ltd.
[Head Office : 333
Silom Rd., Silom,
Bangrak, Bangkok 10500]
The Siam Commercial
Bank Public Co., Ltd.
[Head Office : 9 Ratchadapisek Rd., Ladyao,
Jatujak, Bangkok 10900]
Export Import Bank
of Thailand
[Head Office : 1193 Phaholyothin Rd.,
Samsennai, Phyathai, Bangkok
10400]
Kasikornbank Public Co.,
Ltd.
EMPLOYMENT
The subject employs
approximately 900 staff.
[office staff and
factory workers]
LOCATION DETAILS
The premise is
owned for operating
office and factory
I on 4,800
square meters at
the heading address
in industrial area.
Factory II:
515 Moo 4,
Pattana 3 Rd.,
Bangpoo Industrial Estate,
T. Praeksa, A.
Muang, Samutprakarn 10280.
Bangkok Branch:
10th Floor, Ample
Tower, 120 Moo
11, Bangna-Trad Rd.,
Bangna, Bangkok 10260.
COMMENT
Mega Lifesciences Limited
was incorporated by
group of medicine producers to
bring new technology
in Thailand for
manufacturing soft gelatin
capsules. The company
has evolved over
the years to
become a leader
in South East
Asia for innovation and
development in this
field. It is commented
by an pharmaceutical expert
that Mega Lifesciences
Limited has a large more modern
research and development division
compared with other
local pharmaceutical companies
as well.
The company now
ranks among the
world class producers
of pharmaceuticals, health
food supplements, herbal
products, vitamins &
minerals and cosmetic
products in this
dosage form. It
strives to excel
in product &
technology development and
setting standards in the international
markets for high
quality products made
in a modern
GMP approved plant.
The company has
a well established
track record of
building brands and
enjoy a leadership status
in many international
markets.
The company performed
excellent in 2011 and
continued expanding.
FINANCIAL INFORMATION
The capital was
registered at Bht.
5,000,000 divided into 5,000
shares of Bht.
1,000 each.
The capital was
increased later as
followings :
Bht. 10,000,000
on October 15,
1982
Bht. 25,000,000
on April 11,
1986
Bht. 47,500,000
on April
24, 1996
Bht. 50,000,000
on November 23,
1998
Bht. 61,000,000
on December 27,
2000
Bht. 67,056,190
on December 30,
2003
The latest registered
capital was increased
to Bht. 67,056,190
divided into 6,705,619
shares of Bht.
10 each with
fully paid.
THE SHAREHOLDERS LISTED
WERE : [as at
April 30, 2012]
|
NAME |
HOLDING |
% |
|
|
|
|
|
Unistretch Co., Ltd. |
4,910,500 |
73.23 |
|
Mr. Vivek Dhawan |
670,563 |
10.00 |
|
Mr. Paramjit Singh
Sawney [Indian] |
167,640 |
2.50 |
|
Mr. Sudhir Gandhi [Indian] |
167,640 |
2.50 |
|
Mr. Thomas Abraham [Indian] |
167,640 |
2.50 |
|
Ms. Duangnapa Tongsiri |
167,640 |
2.50 |
|
Mr. Apichai Chancharusiri |
40,234 |
0.60 |
|
Mr. John Villiam Farley |
40,234 |
0.60 |
|
Mr. Pornchai Wongphayak |
33,528 |
0.50 |
|
Other Shareholders |
340,000 |
5.07 |
Total Shareholders : 60
Share Structure [as
at April 30,
2012]
|
Nationality |
Shareholders |
No. of Share |
% Shares |
|
|
|
|
|
|
Thai |
22 |
5,926,965 |
88.39 |
|
Foreign - Foreign |
38 |
778,654 |
11.61 |
|
Total |
60 |
6,705,619 |
100.00 |
NAME OF AUDITOR
& CERTIFIED PUBLIC
ACCOUNTANT NO. :
Mrs. Vilai Buranakittisophon No. 3920
BALANCE SHEET [BAHT]
The
latest financial figures
published for December
31, 2011 &
2010 were:
ASSETS
|
Current Assets |
2011 |
2010 |
|
|
|
|
|
Cash and Cash Equivalents |
3,707,069 |
1,426,967 |
|
Trade Accounts Receivable |
323,085,007 |
291,063,064 |
|
Inventories |
275,495,717 |
169,697,814 |
|
Other Current Assets
|
38,296,819 |
11,906,155 |
|
Total Current Assets
|
640,584,612 |
474,094,000 |
|
|
|
|
|
Investment in Subsidiaries |
52,162,300 |
52,162,300 |
|
Fixed Assets |
265,132,452 |
268,348,954 |
|
Intangible Assets |
4,862,281 |
5,682,627 |
|
Other Non-current Assets |
- |
24,568 |
|
Total Assets |
962,741,645 |
800,312,449 |
LIABILITIES &
SHAREHOLDERS' EQUITY [BAHT]
|
Current
Liabilities |
2011 |
2010 |
|
|
|
|
|
Bank Overdraft &
Short-term Loan from Financial Institution |
289,681,119 |
242,557,084 |
|
Trade Accounts Payable |
166,314,594 |
99,988,735 |
|
Short-term Loan &
Deferred Interest – Related Company |
2,549,277 |
2,534,884 |
|
Current Portion of Long-term
Loans |
20,255,000 |
28,410,692 |
|
Current Portion of
Hire Purchase Contract Liabilities |
95,335 |
228,805 |
|
Accrued Income Tax |
13,445,232 |
21,526,188 |
|
Accrued Expenses |
25,322,921 |
13,002,248 |
|
Other Current Liabilities |
11,479,062 |
11,025,674 |
|
Total Current Liabilities |
529,142,540 |
419,274,310 |
|
Long-term Loan from Financial Institution |
4,430,000 |
24,685,000 |
|
Employee Benefit Obligation |
31,513,122 |
- |
|
Hire-purchase Liabilities |
- |
95,335 |
|
Total Liabilities |
565,085,662 |
444,054,645 |
|
|
|
|
|
Shareholders' Equity |
|
|
|
|
|
|
|
Share capital : Baht 10
par value authorized, issued
and fully paid share
capital 6,705,619 shares |
67,056,190 |
67,056,190 |
|
Capital Paid |
67,056,190 |
67,056,190 |
|
Retained Earning Appropriated for
Statutory Reserve |
7,721,129 |
7,721,129 |
|
Unappropriated |
322,878,664 |
281,480,485 |
|
Total Shareholders' Equity |
397,655,983 |
356,257,804 |
|
Total Liabilities & Shareholders' Equity |
962,741,645 |
800,312,449 |
PROFIT & LOSS ACCOUNT
|
Revenue |
2011 |
2010 |
|
|
|
|
|
Sales |
1,116,952,153 |
1,019,295,271 |
|
Investment Income |
94,000,000 |
74,995,650 |
|
Gain on Exchange
Rate |
- |
919,985 |
|
Other Income |
8,449,565 |
4,198,581 |
|
Total Revenues |
1,219,401,718 |
1,099,409,487 |
|
Expenses |
|
|
|
|
|
|
|
Cost of Goods
Sold |
857,675,395 |
741,078,330 |
|
Selling Expenses |
30,256,080 |
27,615,213 |
|
Administrative Expenses |
122,364,107 |
113,002,398 |
|
Loss on Exchange Rate |
4,052,009 |
- |
|
Total Expenses |
1,014,347,591 |
881,695,941 |
|
Profit before Financial Cost |
205,054,127 |
217,713,546 |
|
Financial Cost |
[11,305,259] |
[11,917,345] |
|
Profit before Income Tax |
193,748,868 |
205,796,201 |
|
Income Tax |
[32,160,000] |
[40,260,612] |
|
Net Profit / [Loss] |
161,588,868 |
165,535,589 |
FINANCIAL ANALYSIS
|
ITEM |
UNIT |
2011 |
2010 |
|
|
|
|
|
|
LIQUIDITY RATIO |
|
|
|
|
CURRENT RATIO |
TIMES |
1.21 |
1.13 |
|
QUICK RATIO |
TIMES |
0.62 |
0.70 |
|
|
|
|
|
|
ACTIVITY RATIO |
|
|
|
|
FIXED ASSETS TURNOVER |
TIMES |
4.21 |
3.80 |
|
TOTAL ASSETS TURNOVER |
TIMES |
1.16 |
1.27 |
|
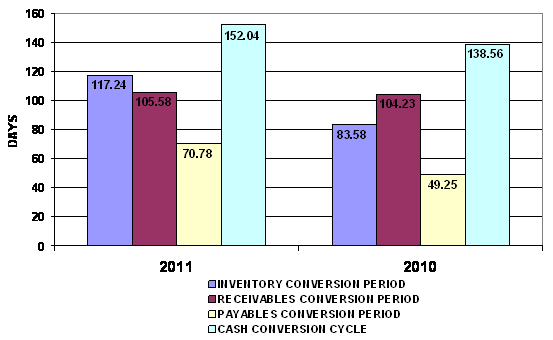
INVENTORY CONVERSION PERIOD |
DAYS |
117.24 |
83.58 |
|
INVENTORY TURNOVER |
TIMES |
3.11 |
4.37 |
|
RECEIVABLES CONVERSION PERIOD |
DAYS |
105.58 |
104.23 |
|
RECEIVABLES TURNOVER |
TIMES |
3.46 |
3.50 |
|
PAYABLES CONVERSION PERIOD |
DAYS |
70.78 |
49.25 |
|
CASH CONVERSION CYCLE |
DAYS |
152.04 |
138.56 |
|
|
|
|
|
|
PROFITABILITY
RATIO |
|
|
|
|
COST OF GOODS SOLD |
% |
76.79 |
72.70 |
|
SELLING & ADMINISTRATION |
% |
13.66 |
13.80 |
|
INTEREST |
% |
1.01 |
1.17 |
|
GROSS PROFIT MARGIN |
% |
32.39 |
35.15 |
|
NET PROFIT MARGIN BEFORE EX. ITEM |
% |
18.36 |
21.36 |
|
NET PROFIT MARGIN |
% |
14.47 |
16.24 |
|
RETURN ON EQUITY |
% |
40.64 |
46.47 |
|
RETURN ON ASSET |
% |
16.78 |
20.68 |
|
EARNING PER SHARE |
BAHT |
24.10 |
24.69 |
|
|
|
|
|
|
LEVERAGE RATIO |
|
|
|
|
DEBT RATIO |
TIMES |
0.59 |
0.55 |
|
DEBT TO EQUITY RATIO |
TIMES |
1.42 |
1.25 |
|
TIME INTEREST EARNED |
TIMES |
18.14 |
18.27 |
|
|
|
|
|
|
ANNUAL GROWTH |
|
|
|
|
SALES GROWTH |
% |
9.58 |
|
|
OPERATING PROFIT |
% |
(5.81) |
|
|
NET PROFIT |
% |
(2.38) |
|
|
FIXED ASSETS |
% |
(1.20) |
|
|
TOTAL ASSETS |
% |
20.30 |
|
PROFITABILITY
RATIO
|
Gross Profit Margin |
32.39 |
Impressive |
Industrial
Average |
23.49 |
|
Net Profit Margin |
14.47 |
Impressive |
Industrial
Average |
2.23 |
|
Return on Assets |
16.78 |
Impressive |
Industrial
Average |
4.38 |
|
Return on Equity |
40.64 |
Impressive |
Industrial
Average |
11.28 |
Gross Profit Margin used to assess a firm's financial health by
revealing the proportion of money left over from revenues after accounting for
the cost of goods sold. Gross profit margin serves as the source for paying
additional expenses and future savings. The company’s figure is 32.39%. When compared with the industry
average, the ratio of the company was higher, this indicated that company was
more profitable than the same industry.
Net Profit Margin is the indicator of the company's efficiency in that
net profit takes into consideration all expenses of the company. A low profit
margin indicates a low margin of safety, higher risk that a decline in sales
will erase profits and result in a net loss. The company’s figure is 14.47%,
higher figure when compared with those of its average competitors in the same
industry, indicated that business was an efficient operator in a dominant position within its industry.
Return on Assets measures how efficiently profits are being generated
from the assets employed in the business when compared with the ratios of firms
in a similar business. A low ratio in comparison with industry averages
indicates an inefficient use of business assets. Return on Assets ratio is
16.78%, higher figure when compared with those of its average competitors in
the same industry, indicated that business was an efficient profit in a dominant position within its industry.
Return on Equity indicates how profitable a company is by comparing its
net income to its average shareholders' equity, ROE measures how much the
shareholders earned for their investment in the company. Return on Equity ratio
is 40.64%, higher figure when compared with those of its average competitors in
the same industry, indicated that business was an efficient profit in a dominant position within its industry.
Trend of the
average competitors in the same industry for last 5 years
Return on Assets Uptrend
Return on Equity Downtrend
LIQUIDITY RATIO
|
Current Ratio |
1.21 |
Acceptable |
Industrial
Average |
1.66 |
|
Quick Ratio |
0.62 |
|
|
|
|
Cash Conversion Cycle |
152.04 |
|
|
|
The Current Ratio is to ascertain whether a company's short-term assets
are readily available to pay off its short-term liabilities. The company's figure
is 1.21 times in 2011, increased from 1.13 times, then it is generally
considered to have good short-term financial strength. When compared with the
industry average, the ratio of the company was lower.
The Quick Ratio is a liquidity indicator that further refines the
current ratio by measuring the amount of the most liquid current assets there
are to cover current liabilities. The company's figure is 0.62 times in 2011,
decreased from 0.7 times, then the company has not enough current assets that presumably
can be quickly converted to cash for pay financial obligations.
The Cash Conversion Cycle measures the number of days a company's cash
is tied up in the production and sales process of its operations and the
benefit from payment terms from its creditors. It meant the company could
survive when no cash inflow was received from sale for 153 days.
Trend of the
average competitors in the same industry for last 5 years
Current Ratio Uptrend
LEVERAGE RATIO
|
Debt Ratio |
0.59 |
Impressive |
Industrial
Average |
0.59 |
|
Debt to Equity Ratio |
1.42 |
Risky |
Industrial
Average |
1.40 |
|
Times Interest Earned |
18.14 |
Impressive |
Industrial
Average |
4.39 |
Debt to Equity Ratio a measurement of how much suppliers, lenders, creditors
and obligors have committed to the company versus what the shareholders have
committed. A lower the percentage means that the company is using less leverage
and has a stronger equity position.
Times Interest Earned measuring a company's ability to meet its debt
obligations. Ratio is 18.14 higher than 1, so the company can pay interest
expenses on outstanding debt.
Debt Ratio shows the proportion of a company's assets which are financed
through debt. The company's figure is 0.59 greater than 0.5, most of the
company's assets are financed through debt.
Trend of the
average competitors in the same industry for last 5 years
Debt Ratio Downtrend
Times Interest Earned Uptrend
ACTIVITY RATIO
|
Fixed Assets Turnover |
4.21 |
Deteriorated |
Industrial
Average |
9.02 |
|
Total Assets Turnover |
1.16 |
Acceptable |
Industrial
Average |
1.94 |
|
Inventory Conversion Period |
117.24 |
|
|
|
|
Inventory Turnover |
3.11 |
Satisfactory |
Industrial
Average |
3.98 |
|
Receivables Conversion Period |
105.58 |
|
|
|
|
Receivables Turnover |
3.46 |
Impressive |
Industrial
Average |
2.86 |
|
Payables Conversion Period |
70.78 |
|
|
|
Trend of the
average competitors in the same industry for last 5 years
Fixed Assets Turnover Downtrend
Total Assets Turnover Downtrend
Inventory Turnover Downtrend
Receivables Turnover Downtrend
FOREIGN EXCHANGE RATES
|
Currency |
Unit
|
Indian Rupees |
|
US Dollar |
1 |
Rs.52.69 |
|
|
1 |
Rs.85.71 |
|
Euro |
1 |
Rs.68.15 |
INFORMATION DETAILS
|
Report
Prepared by : |
PRL |
RATING EXPLANATIONS
|
RATING |
STATUS |
PROPOSED CREDIT LINE |
|
|
>86 |
Aaa |
Possesses an extremely sound financial base with the strongest
capability for timely payment of interest and principal sums |
Unlimited |
|
71-85 |
Aa |
Possesses adequate working capital. No caution needed for credit
transaction. It has above average (strong) capability for payment of interest
and principal sums |
Large |
|
56-70 |
A |
Financial & operational base are regarded healthy. General
unfavourable factors will not cause fatal effect. Satisfactory capability for
payment of interest and principal sums |
Fairly Large |
|
41-55 |
Ba |
Overall operation is considered normal. Capable to meet normal
commitments. |
Satisfactory |
|
26-40 |
B |
Capability to overcome financial difficulties seems comparatively
below average. |
Small |
|
11-25 |
Ca |
Adverse factors are apparent. Repayment of interest and principal sums
in default or expected to be in default upon maturity |
Limited with
full security |
|
<10 |
C |
Absolute credit risk exists. Caution needed to be exercised |
Credit not
recommended |
|
-- |
NB |
New Business |
-- |
This score serves as a reference to assess SC’s credit risk
and to set the amount of credit to be extended. It is calculated from a
composite of weighted scores obtained from each of the major sections of this report.
The assessed factors and their relative weights (as indicated through %) are as
follows:
Financial
condition (40%) Ownership
background (20%) Payment
record (10%)
Credit history
(10%) Market trend
(10%) Operational
size (10%)
This report is issued at your request without any risk
and responsibility on the part of MIRA INFORM PRIVATE LIMITED (MIPL) or its
officials.