MIRA
INFORM REPORT
|
Report Date : |
05.04.2013 |
IDENTIFICATION DETAILS
|
Name : |
GUARDIAN INDUSTRIES
CORP LTD. |
|
|
|
|
Registered Office : |
42 Moo
7, T. Nongplamoh,
A. Nongkhae, Saraburi 18140 |
|
|
|
|
Country : |
Thailand |
|
|
|
|
Financials (as on) : |
31.12.2011 |
|
|
|
|
Date of Incorporation : |
2003 |
|
|
|
|
Com. Reg. No.: |
0195546000332 |
|
|
|
|
Legal Form : |
Private Limited Company |
|
|
|
|
Line of Business : |
Manufacturer, Distributor and Exporter of Clear Float Glass and Mirror |
|
|
|
|
No. of Employees : |
550 |
RATING & COMMENTS
|
MIRA’s Rating : |
Ba |
|
RATING |
STATUS |
PROPOSED CREDIT LINE |
|
|
41-55 |
Ba |
Overall operation is considered normal. Capable to meet normal
commitments. |
Satisfactory |
|
Status : |
Satisfactory |
|
Payment Behaviour : |
No complaints |
|
Litigation : |
Clear |
NOTES :
Any query related to this report can be made
on e-mail: infodept@mirainform.com
while quoting report number, name and date.
ECGC Country Risk Classification List – June 30th, 2012
|
Country Name |
Previous Rating (31.03.2012) |
Current Rating (30.06.2012) |
|
Thailand |
B1 |
B1 |
|
Risk Category |
ECGC
Classification |
|
Insignificant |
A1 |
|
Low |
A2 |
|
Moderate |
B1 |
|
High |
B2 |
|
Very High |
C1 |
|
Restricted |
C2 |
|
Off-credit |
D |
thailand - ECONOMIC OVERVIEW
With a well-developed infrastructure, a free-enterprise economy, generally pro-investment policies, and strong export industries, Thailand enjoyed solid growth from 2000 to 2007 - averaging more than 4% per year - as it recovered from the Asian financial crisis of 1997-98. Thai exports - mostly machinery and electronic components, agricultural commodities, and jewelry - continue to drive the economy, accounting for more than half of GDP. The global financial crisis of 2008-09 severely cut Thailand's exports, with most sectors experiencing double-digit drops. In 2009, the economy contracted 2.3%. In 2010, Thailand's economy expanded 7.8%, its fastest pace since 1995, as exports rebounded from their depressed 2009 level. Steady economic growth at just below 4% during the first three quarters of 2011 was interrupted by historic flooding in October and November in the industrial areas north of Bangkok, crippling the manufacturing sector and leading to a revised growth rate of only 0.1% for the year. The industrial sector is poised to recover from the second quarter of 2012 onward, however, and the government anticipates the economy will probably grow between 5.5 and 6.5% for 2012, while private sector forecasts range between 3.8% and 5.7%.
|
Source : CIA |
Company name
GUARDIAN
INDUSTRIES CORP LTD.
SUMMARY
BUSINESS
ADDRESS : 42
MOO 7, T.
NONGPLAMOH, A. NONGKHAE,
SARABURI 18140,
THAILAND
TELEPHONE : [66] 36
373-373
FAX :
[66] 36
373-345-7, 36 373-338
E-MAIL
ADDRESS : info@guardian.com
REGISTRATION
ADDRESS : SAME
AS BUSINESS ADDRESS
ESTABLISHED
: 2003
REGISTRATION
NO. : 0195546000332
TAX
ID NO. : 3030888105
CAPITAL REGISTERED : BHT. 750,000,000
CAPITAL PAID-UP : BHT.
750,000,000
SHAREHOLDER’S PROPORTION : THAI : 100%
FISCAL YEAR CLOSING DATE : DECEMBER 31
LEGAL
STATUS : PRIVATE LIMITED
COMPANY
EXECUTIVE : MR.
GREGORY SCOTT POULSON,
AMERICAN
MANAGING DIRECTOR
NO.
OF STAFF : 550
LINES
OF BUSINESS : CLEAR
FLOAT GLASS AND
MIRROR
MANUFACTURER, DISTRIBUTOR
AND EXPORTER
CORPORATE PROFILE
OPERATING
TREND : STABLE
PRESENT
SITUATION : OPERATING NORMALLY
REPUTATION : GOOD
WITH NORMAL BUSINESS
ENGAGEMENT
MANAGEMENT
STANDARD : MANAGEMENT WITH
GOOD PERFORMANCE
HISTORY
The
subject was established
on May 1,
2003 as a
private limited company
under the name
style GUARDIAN INDUSTRIES
CORP LTD. by
American groups, in
order to produce
and distribute clear float glass
and mirror for both
domestic and international
markets.
Awards:
Products Manufacturing
BSI - Certificate Number: FM: 32648
ISO 9002 – The manufacture and supply of Clear Float Glass in thickness ranging from 2mm to 12 mm (October 1995)
ISO 9002 - The manufacture and supply of Mirror (Silvered) Glass in thickness ranging from 2mm to 6mm (April 1996)
TIS - Certificate Number: (2) T 525-10/880
TIS 880 - 2532 for Clear Float Glass (January 1998)
TIS 880 - 2532 for Frosted
Float Glass (May 1998)
At
present, subject is a wholly owned subsidiary of Guardian
Industries [Nongkhae] Ltd.,
which is a
member of Guardian
Industries Corporation in
U.S.A., a leading
worldwide manufacturer of
float glass and
fabricated glass products
for commercial and residential
construction industries, and
for automotive industry.
It currently employs
approximately 550 staff.
The
subject’s registered address
is 42 Moo 7,
T. Nongplamoh, A. Nongkhae
Saraburi 18140, and
this is the
subject’s current operation
address.
THE
BOARD OF DIRECTORS
|
Name |
|
Nationality |
Age |
|
|
|
|
|
|
Mr. William Jeffrey
Petek |
|
American |
45 |
|
Mr. Gregory Scott
Poulson |
|
American |
63 |
AUTHORIZED PERSON
Both of the
above directors can
jointly sign on
behalf of the
subject with company’s
affixed.
MANAGEMENT
Mr. Gregory Scott
Poulson is the
Managing Director.
He is American
nationality with the
age of 63
years old.
Mr. William Jeffrey Petek
is the Marketing
& Sales Manager.
He is American
nationality with the
age of 45 years old.
Mr. Crown Benden is
the Factory Manager.
He is American
nationality.
Mr. Ralph Wragge is
the Technical Director.
He is American
nationality.
BUSINESS OPERATIONS
The subject is engaged
in manufacturing, distributing
and exporting wide
range of glass
and mirror, including
float glass products [extra clear/green
tinted glass], fabricated
glass [sun guard] and
special glass products [shower guard
glass/ satin deco glass/ ultra
mirror/ ultra white mirror],
with the promotional privileges
granted by the
Board of Investment [BOI], used in automobiles, residential, commercial and construction
industries.
PRODUCTION CAPACITY
390,000 tons per
annum
MAJOR BRAND
“GUARDIAN”
PURCHASE
Raw
materials are purchased
from suppliers both
local and overseas
in Japan, Taiwan,
Singapore, Republic of
China, India, United
States of America,
Germany and France.
MAJOR
SUPPLIER
Guardian
Global Inc.
: U.S.A.
SALES
[LOCAL]
64%
of its products
is sold locally
by wholesale to
dealers and end-users
nationwide.
EXPORT
36% of its
products is exported
to United States
of America, Germany,
Italy, Sweden, United Kingdom, Taiwan,
Japan, Singapore, Malaysia,
Korea, India, Hong Kong, Indonesia,
Canada, South Africa,
and Middle East
countries.
PARENT COMPANY
Guardian Industries [Nongkhae]
Ltd.
Address : 42 Moo 7,
T. Nongplamoh, A.
Nongkhae, Saraburi 18140
RELATED COMPANY
Guardian Industries Rayong
Co., Ltd.
Business Type : Manufacturer of
color tinted float
glass
LITIGATION
Bankruptcy and Receivership
There are no
litigation on bankruptcy
and receivership cases
filed against the
subject found at
Legal Execution Department
for the past
five years.
Others
There are no
legal suits filed
against the subject
according for the
past two years.
CREDIT
Sales
are by cash
or on the
credits term of
30-60 days.
Local
bills are paid
by cash or
on the credits
term of 30-60
days.
Imports
are by L/C
at sight or
T/T.
Exports
are against L/C
at sight or
T/T.
BANKING
Standard
Chartered Bank [Thai]
Public Co., Ltd.
[Bangkok Branch : 990 Rama 4
Rd., Bangrak, Bangkok
10500]
Bangkok
Bank Public Co.,
Ltd.
EMPLOYMENT
The
subject employs approximately
550 staff [office
staff and factory
workers].
LOCATION
DETAILS
The
premise is rented
for administrative office,
factory and warehouse
at the heading
address. Premise is
located in provincial.
COMMENT
The subject is
Thailand’s leading producer of flat glass using the Float Process, which
incorporates the most advanced glass manufacturing technology available. This
technique permits the production of glass that is extremely even in thickness,
high in quality which is used in a wide variety of applications.
The subject’s
operating performance in
2011 was slightly
dropped comparing to
the previous year’s
level due to
a severe flood
in late 2011 which
affected on a
slowdown of its
sales. However, the
construction, automobile and related
industries have seen
improvement in 2012,
and it expects
to continue growing
throughout this year.
FINANCIAL
INFORMATION
The
capital was registered
at Bht. 750,000,000 divided into 7,500,000 shares
of Bht. 100
each with fully
paid.
THE
SHAREHOLDERS LISTED WERE
: [as at
April 27, 2012]
|
NAME |
HOLDING |
% |
|
|
|
|
|
Guardian Industries [Nongkhae]
Ltd. Nationality: Thai Address : 42 Moo 7,
T. Nongplamoh, A.
Nongkhae,
Saraburi 18140 |
7,499,998 |
100.00 |
|
Mr. Peter Story
Walters Nationality: American Address : Michigan, U.S.A. |
1 |
- |
|
Mr. Michael Thomas
Morrison Nationality: American Address : Michigan, U.S.A. |
1 |
- |
Total Shareholders : 3
Share Structure [as
at April 27,
2012]
|
Nationality |
Shareholders |
No. of Share |
% Shares |
|
|
|
|
|
|
Thai |
1 |
7,499,998 |
100.00 |
|
Foreign - American |
2 |
2 |
- |
|
Total |
3 |
7,500,000 |
100.00 |
NAME OF AUDITOR
& CERTIFIED PUBLIC
ACCOUNTANT NO. :
Mr. Vichien Kingmontree No.
3977
BALANCE SHEET [BAHT]
The
latest financial figures
published for December
31, 2011, 2010
& 2009 were:
ASSETS
|
Current Assets |
2011 |
2010 |
2009 |
|
|
|
|
|
|
Cash and Cash Equivalents |
436,089 |
1,145,200 |
6,482,136 |
|
Trade Accounts &
Other Receivable |
203,408,176 |
219,345,705 |
173,806,222 |
|
Loan to Related
Company |
- |
373,536,597 |
34,109,567 |
|
Inventories |
309,740,639 |
258,979,639 |
1,230,719,250 |
|
Refundable Value Added Tax |
13,514,014 |
380,976 |
249,820,358 |
|
Other Current Assets
|
2,257,273 |
13,636,170 |
8,797,225 |
|
Total Current Assets
|
529,356,191 |
867,024,287 |
1,703,734,758 |
|
|
|
|
|
|
Fixed Assets |
1,173,723,936 |
705,856,449 |
493,352,040 |
|
Intangible Assets |
804,290 |
335,700 |
597,250 |
|
Deferred Income Tax |
4,430,131 |
1,482,464 |
398,378 |
|
Other Assets |
2,876,759 |
2,777,859 |
2,817,059 |
|
Total Assets |
1,711,191,307 |
1,577,476,759 |
2,200,899,485 |
LIABILITIES &
SHAREHOLDERS' EQUITY [BAHT]
|
Current
Liabilities |
2011 |
2010 |
2009 |
|
|
|
|
|
|
Trade Accounts & Other
Payable |
249,929,919 |
241,468,578 |
109,338,858 |
|
Loan from Related
Company |
509,909,163 |
- |
15,217,626 |
|
Accrued Income Tax |
80,015,116 |
117,860,817 |
112,039,108 |
|
Current Portion of Forward Contract Payable |
18,885,607 |
33,007,037 |
76,451,995 |
|
Other Current Liabilities |
4,650,219 |
3,670,466 |
10,250,668 |
|
Total Current Liabilities |
863,390,024 |
396,006,898 |
323,298,255 |
|
Estimated Liabilities from Employee Benefits |
7,050,240 |
- |
- |
|
Total Liabilities |
870,440,264 |
396,006,898 |
323,298,255 |
|
|
|
|
|
|
Shareholders' Equity |
|
|
|
|
|
|
|
|
|
Share capital : Baht 100
par value authorized, issued
and fully paid share
capital 7,500,000 shares |
750,000,000 |
750,000,000 |
750,000,000 |
|
Capital Paid |
750,000,000 |
750,000,000 |
750,000,000 |
|
Statutory Reserve |
75,000,000 |
75,000,000 |
75,000,000 |
|
Retained Earning -
Unappropriated |
15,751,043 |
356,469,861 |
1,052,601,230 |
|
Total Shareholders' Equity |
840,751,043 |
1,181,469,861 |
1,877,601,230 |
|
Total Liabilities &
Shareholders' Equity |
1,711,191,307 |
1,577,476,759 |
2,200,899,485 |
PROFIT &
LOSS ACCOUNT
|
Revenue |
2011 |
2010 |
2009 |
|
|
|
|
|
|
Sales Income |
2,810,198,311 |
2,826,810,975 |
2,616,675,395 |
|
Other Income |
11,247,230 |
13,278,591 |
22,782,033 |
|
Total Revenues |
2,821,445,541 |
2,840,089,566 |
2,639,457,428 |
|
Expenses |
|
|
|
|
|
|
|
|
|
Cost of Goods
Sold |
1,930,863,611 |
1,786,823,100 |
1,682,837,822 |
|
Selling Expenses |
225,500,627 |
216,632,037 |
232,682,363 |
|
Administrative Expenses |
97,075,899 |
99,704,330 |
82,682,515 |
|
Loss on Exchange Rate |
12,971,197 |
16,197,977 |
[10,265,542] |
|
Total Expenses |
2,266,411,334 |
2,119,357,444 |
1,987,937,158 |
|
Profit before Financial
Cost & Income Tax |
555,034,207 |
720,732,122 |
651,520,270 |
|
Financial Cost - Interest
Paid |
[3,840,508] |
- |
- |
|
Profit before Income Tax |
551,193,699 |
720,732,122 |
651,520,270 |
|
Income Tax |
[167,412,517] |
[216,863,491] |
[195,631,713] |
|
Net Profit / [Loss] |
383,781,182 |
503,868,631 |
455,888,557 |
FINANCIAL ANALYSIS
|
ITEM |
UNIT |
2011 |
2010 |
2009 |
|
|
|
|
|
|
|
LIQUIDITY RATIO |
|
|
|
|
|
CURRENT RATIO |
TIMES |
0.61 |
2.19 |
5.27 |
|
QUICK RATIO |
TIMES |
0.24 |
1.50 |
0.66 |
|
|
|
|
|
|
|
ACTIVITY RATIO |
|
|
|
|
|
FIXED ASSETS TURNOVER |
TIMES |
2.39 |
4.00 |
5.30 |
|
TOTAL ASSETS TURNOVER |
TIMES |
1.64 |
1.79 |
1.19 |
|
INVENTORY CONVERSION PERIOD |
DAYS |
58.55 |
52.90 |
266.94 |
|
INVENTORY TURNOVER |
TIMES |
6.23 |
6.90 |
1.37 |
|
RECEIVABLES CONVERSION PERIOD |
DAYS |
26.42 |
28.32 |
24.24 |
|
RECEIVABLES TURNOVER |
TIMES |
13.82 |
12.89 |
15.06 |
|
PAYABLES CONVERSION PERIOD |
DAYS |
47.25 |
49.33 |
23.72 |
|
CASH CONVERSION CYCLE |
DAYS |
37.73 |
31.90 |
267.47 |
|
|
|
|
|
|
|
PROFITABILITY
RATIO |
|
|
|
|
|
COST OF GOODS SOLD |
% |
68.71 |
63.21 |
64.31 |
|
SELLING & ADMINISTRATION |
% |
11.48 |
11.19 |
12.05 |
|
INTEREST |
% |
0.14 |
- |
- |
|
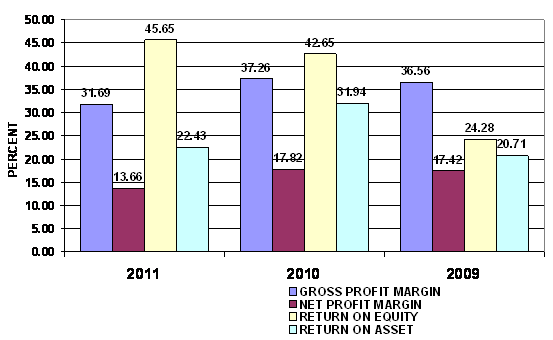
GROSS PROFIT MARGIN |
% |
31.69 |
37.26 |
36.56 |
|
NET PROFIT MARGIN BEFORE EX. ITEM |
% |
19.75 |
25.50 |
24.90 |
|
NET PROFIT MARGIN |
% |
13.66 |
17.82 |
17.42 |
|
RETURN ON EQUITY |
% |
45.65 |
42.65 |
24.28 |
|
RETURN ON ASSET |
% |
22.43 |
31.94 |
20.71 |
|
EARNING PER SHARE |
BAHT |
51.17 |
67.18 |
60.79 |
|
|
|
|
|
|
|
LEVERAGE RATIO |
|
|
|
|
|
DEBT RATIO |
TIMES |
0.51 |
0.25 |
0.15 |
|
DEBT TO EQUITY RATIO |
TIMES |
1.04 |
0.34 |
0.17 |
|
TIME INTEREST EARNED |
TIMES |
144.52 |
- |
- |
|
|
|
|
|
|
|
ANNUAL GROWTH |
|
|
|
|
|
SALES GROWTH |
% |
(0.59) |
8.03 |
|
|
OPERATING PROFIT |
% |
(22.99) |
10.62 |
|
|
NET PROFIT |
% |
(23.83) |
10.52 |
|
|
FIXED ASSETS |
% |
66.28 |
43.07 |
|
|
TOTAL ASSETS |
% |
8.48 |
(28.33) |
|
ANNUAL GROWTH :
ACCEPTABLE
An annual sales growth is -0.59%. Turnover has decreased from THB
2,826,810,975.00 in 2010 to THB 2,810,198,311.00 in 2011. While net profit has
decreased from THB 503,868,631.00 in 2010 to THB 383,781,182.00 in 2011. And
total assets has increased from THB 1,577,476,759.00 in 2010 to THB 1,711,191,307.00
in 2011.
PROFITABILITY :
EXCELLENT
PROFITABILITY
RATIO
|
Gross Profit Margin |
31.69 |
Impressive |
Industrial
Average |
16.96 |
|
Net Profit Margin |
13.66 |
Impressive |
Industrial
Average |
3.27 |
|
Return on Assets |
22.43 |
Impressive |
Industrial
Average |
4.13 |
|
Return on Equity |
45.65 |
Impressive |
Industrial
Average |
16.84 |
Gross Profit Margin used to assess a firm's financial health by
revealing the proportion of money left over from revenues after accounting for
the cost of goods sold. Gross profit margin serves as the source for paying
additional expenses and future savings. Gross Profit Margin is 31.69%. When compared with the industry
average, the ratio of the company was higher, indicated that company was more
profitable than the same industry.
Net Profit Margin is the indicator of the company's efficiency in that
net profit takes into consideration all expenses of the company. A low profit
margin indicates a low margin of safety, higher risk that a decline in sales
will erase profits and result in a net loss. Net Profit Margin ratio is 13.66%,
higher figure when compared with those of its average competitors in the same
industry, indicated that business was an efficient operator in a dominant
position within its industry.
Return on Assets measures how efficiently profits are being generated
from the assets employed in the business when compared with the ratios of firms
in a similar business. A low ratio in comparison with industry averages
indicates an inefficient use of business assets. Return on Assets ratio is
22.43%, higher figure when compared with those of its average competitors in
the same industry, indicated that business was an efficient profit in a
dominant position within its industry.
Return on Equity indicates how profitable a company is by comparing its
net income to its average shareholders' equity, ROE measures how much the
shareholders earned for their investment in the company. Return on Equity ratio
is 45.65%, higher figure when compared with those of its average competitors in
the same industry, indicated that business was an efficient profit in a
dominant position within its industry.
Trend of the
average competitors in the same industry for last 5 years
Return on Assets Downtrend
Return on Equity Uptrend
LIQUIDITY : RISKY
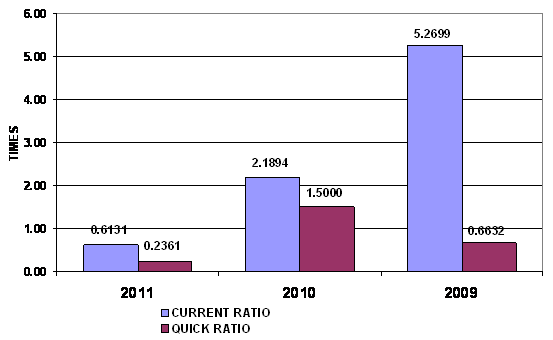
LIQUIDITY RATIO
|
Current Ratio |
0.61 |
Risky |
Industrial
Average |
1.06 |
|
Quick Ratio |
0.24 |
|
|
|
|
Cash Conversion Cycle |
37.73 |
|
|
|
The Current Ratio is to ascertain whether a company's short-term assets
are readily available to pay off its short-term liabilities. The company's
figure is 0.61 times in 2011, decrease from 2.19 times, then the company may
not be efficiently using its current assets. When compared with the industry
average, the ratio of the company was lower.
The Quick Ratio is a liquidity indicator that further refines the
current ratio by measuring the amount of the most liquid current assets there
are to cover current liabilities. The company's figure is 0.24 times in 2011,
decrease from 1.5 times, then the company has not enough current assets that presumably
can be quickly converted to cash for pay financial obligations.
The Cash Conversion Cycle measures the number of days a company's cash
is tied up in the production and sales process of its operations and the
benefit from payment terms from its creditors. It meant the company could
survive when no cash inflow was received from sale for 38 days.
Trend of the
average competitors in the same industry for last 5 years
Current Ratio Downtrend
LEVERAGE :
EXCELLENT

LEVERAGE RATIO
|
Debt Ratio |
0.51 |
Impressive |
Industrial
Average |
0.65 |
|
Debt to Equity Ratio |
1.04 |
Impressive |
Industrial
Average |
2.17 |
|
Times Interest Earned |
144.52 |
Impressive |
Industrial
Average |
5.73 |
Debt to Equity Ratio a measurement of how much suppliers, lenders,
creditors and obligors have committed to the company versus what the
shareholders have committed. A lower the percentage means that the company is
using less leverage and has a stronger equity position.
Times Interest Earned measuring a company's ability to meet its debt
obligations. Ratio is 144.53 higher than 1, so the company can pay interest
expenses on outstanding debt.
Debt Ratio shows the proportion of a company's assets which are financed
through debt. The company's figure is 0.51 greater than 0.5, most of the
company's assets are financed through debt.
Trend of the
average competitors in the same industry for last 5 years
Debt Ratio Uptrend
Times Interest Earned Uptrend
ACTIVITY :
EXCELLENT
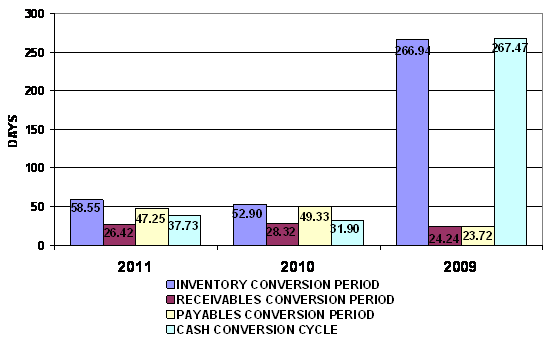
ACTIVITY RATIO
|
Fixed Assets Turnover |
2.39 |
Impressive |
Industrial Average |
2.38 |
|
Total Assets Turnover |
1.64 |
Impressive |
Industrial
Average |
1.06 |
|
Inventory Conversion Period |
58.55 |
|
|
|
|
Inventory Turnover |
6.23 |
Impressive |
Industrial
Average |
4.87 |
|
Receivables Conversion Period |
26.42 |
|
|
|
|
Receivables Turnover |
13.82 |
Impressive |
Industrial
Average |
4.88 |
|
Payables Conversion Period |
47.25 |
|
|
|
The company's Account Receivable Ratio is calculated as 13.82 and 12.89
in 2011 and 2010 respectively. This ratio measures the efficiency of the
company in managing its trade debtors to generate revenue. A lower ratio may
indicate over extension and collection problems. Conversely, a higher ratio may
indicate an overtly stringent policy. In this case, the company's A/R ratio in
2011 increased from 2010. This would suggest the company had good performance
in the management of its debt collections.
Inventory Turnover in Days Ratio indicates the liquidity of inventory.
It estimates the number of days that it will take to sell the current
inventory. Inventory is particularly sensitive to change in business
activities. The inventory turnover in days has increased from 53 days at the
end of 2010 to 59 days at the end of 2011. This represents a negative trend.
And Inventory turnover has decreased from 6.9 times in year 2010 to 6.23 times
in year 2011.
The company's Total Asset Turnover is calculated as 1.64 times and 1.79
times in 2011 and 2010 respectively. This ratio is determined by dividing total
assets into total sales turnover. The ratio measures the activity of the assets
and the ability of the firm to generate sales through the use of the assets.
Trend of the
average competitors in the same industry for last 5 years
Fixed Assets Turnover Uptrend
Total Assets Turnover Uptrend
Inventory Turnover Uptrend
Receivables Turnover Uptrend
FOREIGN EXCHANGE RATES
|
Currency |
Unit
|
Indian Rupees |
|
US Dollar |
1 |
Rs.54.64 |
|
|
1 |
Rs.82.41 |
|
Euro |
1 |
Rs.70.07 |
INFORMATION DETAILS
|
Report Prepared
by : |
PDT |
RATING EXPLANATIONS
|
RATING |
STATUS |
PROPOSED CREDIT LINE |
|
|
>86 |
Aaa |
Possesses an extremely sound financial base with the strongest
capability for timely payment of interest and principal sums |
Unlimited |
|
71-85 |
Aa |
Possesses adequate working capital. No caution needed for credit
transaction. It has above average (strong) capability for payment of interest
and principal sums |
Large |
|
56-70 |
A |
Financial & operational base are regarded healthy. General
unfavourable factors will not cause fatal effect. Satisfactory capability for
payment of interest and principal sums |
Fairly Large |
|
41-55 |
Ba |
Overall operation is considered normal. Capable to meet normal
commitments. |
Satisfactory |
|
26-40 |
B |
Capability to overcome financial difficulties seems comparatively
below average. |
Small |
|
11-25 |
Ca |
Adverse factors are apparent. Repayment of interest and principal sums
in default or expected to be in default upon maturity |
Limited with
full security |
|
<10 |
C |
Absolute credit risk exists. Caution needed to be exercised |
Credit not
recommended |
|
-- |
NB |
New Business |
-- |
This score serves as a reference to assess SC’s credit risk
and to set the amount of credit to be extended. It is calculated from a
composite of weighted scores obtained from each of the major sections of this
report. The assessed factors and their relative weights (as indicated through
%) are as follows:
Financial
condition (40%) Ownership
background (20%) Payment
record (10%)
Credit history
(10%) Market trend
(10%) Operational
size (10%)
This report is issued at your request without any
risk and responsibility on the part of MIRA INFORM PRIVATE LIMITED (MIPL)
or its officials.