MIRA
INFORM REPORT
|
Report Date : |
13.04.2013 |
IDENTIFICATION DETAILS
|
Name : |
MILLCON BURAPA
CO., LTD. |
|
|
|
|
Registered Office : |
99 Highway No. 3191, T. Nikompattana, A. Nikompattana, Rayong 21180 |
|
|
|
|
Country : |
Thailand |
|
|
|
|
Financials (as on) : |
31.12.2011 |
|
|
|
|
Date of Incorporation : |
1994 |
|
|
|
|
Com. Reg. No.: |
0215537001304 |
|
|
|
|
Legal Form : |
Private Limited Company |
|
|
|
|
Line of Business : |
Manufacturer, Distributor and Exporter Hot Rolled Steel Products |
|
|
|
|
No. of Employees : |
230 |
RATING & COMMENTS
|
MIRA’s Rating : |
Ba |
|
RATING |
STATUS |
PROPOSED CREDIT LINE |
|
|
41-55 |
Ba |
Overall operation is considered normal. Capable to meet normal
commitments. |
Satisfactory |
|
Status : |
Satisfactory |
|
Payment Behaviour : |
No complaints |
|
Litigation : |
Clear |
NOTES :
Any query related to this report can be made
on e-mail: infodept@mirainform.com
while quoting report number, name and date.
ECGC Country Risk Classification List – June 30th, 2012
|
Country Name |
Previous Rating (31.03.2012) |
Current Rating (30.06.2012) |
|
Thailand |
B1 |
B1 |
|
Risk Category |
ECGC
Classification |
|
Insignificant |
A1 |
|
Low |
A2 |
|
Moderate |
B1 |
|
High |
B2 |
|
Very High |
C1 |
|
Restricted |
C2 |
|
Off-credit |
D |
thailand - ECONOMIC OVERVIEW
With a well-developed infrastructure, a free-enterprise economy, generally pro-investment policies, and strong export industries, Thailand enjoyed solid growth from 2000 to 2007 - averaging more than 4% per year - as it recovered from the Asian financial crisis of 1997-98. Thai exports - mostly machinery and electronic components, agricultural commodities, and jewelry - continue to drive the economy, accounting for more than half of GDP. The global financial crisis of 2008-09 severely cut Thailand's exports, with most sectors experiencing double-digit drops. In 2009, the economy contracted 2.3%. In 2010, Thailand's economy expanded 7.8%, its fastest pace since 1995, as exports rebounded from their depressed 2009 level. Steady economic growth at just below 4% during the first three quarters of 2011 was interrupted by historic flooding in October and November in the industrial areas north of Bangkok, crippling the manufacturing sector and leading to a revised growth rate of only 0.1% for the year. The industrial sector is poised to recover from the second quarter of 2012 onward, however, and the government anticipates the economy will probably grow between 5.5 and 6.5% for 2012, while private sector forecasts range between 3.8% and 5.7%.
|
Source : CIA |
Company name
MILLCON
BURAPA CO., LTD.
[FORMER
: BRP STEEL
CO., LTD.]
SUMMARY
BUSINESS
ADDRESS : 99
HIGHWAY NO. 3191, T. NIKOMPATTANA,
A.
NIKOMPATTANA, RAYONG 21180
TELEPHONE : [66] 38
606-040-2
FAX :
[66] 38
606-043
E-MAIL
ADDRESS : sales@brpsteel.com
REGISTRATION
ADDRESS : SAME
AS BUSINESS ADDRESS
ESTABLISHED
: 1994
REGISTRATION
NO. : 0215537001304
TAX
ID NO. : 3241008927
CAPITAL REGISTERED : BHT. 2,399,999,990
CAPITAL PAID-UP : BHT.
2,399,999,990
SHAREHOLDER’S PROPORTION : THAI : 99.86%
HONG KONG : 0.14%
FISCAL YEAR CLOSING DATE : DECEMBER 31
LEGAL
STATUS : PRIVATE LIMITED
COMPANY
EXECUTIVE : MR. SITTHICHAI LEESAWADTRAKUL, THAI
PRESIDENT
& CHIEF EXECUTIVE OFFICER
NO.
OF STAFF : 230
LINES
OF BUSINESS : HOT
ROLLED STEEL PRODUCTS
MANUFACTURER, DISTRIBUTOR
AND EXPORTER
CORPORATE PROFILE
OPERATING
TREND : STABLE
PRESENT
SITUATION : OPERATING NORMALLY
REPUTATION : GOOD
WITH NORMAL BUSINESS
ENGAGEMENT
MANAGEMENT
STANDARD : MANAGEMENT WITH
FAIR PERFORMANCE
HISTORY
The
subject was established
on September 23, 1994
as a private
limited company under the
originally registered name “Burapa
Steel Co., Ltd.” by Thai
and Italian groups.
On November 8,
1994, the registered
name was changed
to “Burapa Steel
Industries Co., Ltd.” and
was changed again
to “BRP Steel
Co., Ltd.” on May
30, 2008.
Finally
Millcon Steel Industries
PCL acquired an interest in
Burapa Steel Industries Co., Ltd. (BS),
a long steel
products manufacturer, from Thai Capital Corp PCL, then its
name was changed
to the present
name, MILLCON BURAPA
CO., LTD. on
May 11, 2011.
Its
business objective is to
manufacture and market
hot rolled steel
products to both
domestic and international markets.
It currently employs
approximately 230 staff.
The
subject’s registered address
is 99 Highway
No. 3191, T. Nikompattana, A. Nikompattana, Rayong
21180, and this
is the subject’s
current operation address.
THE BOARD OF
DIRECTOR
|
Name |
|
Nationality |
Age |
|
|
|
|
|
|
Mr. Santisuk Plukesawad |
|
Thai |
64 |
|
Mr. Sitthichai Leesawadtrakul |
[x] |
Thai |
35 |
|
Ms. Suttirat Leesawadtrakul |
[x] |
Thai |
31 |
|
Mr. Thitipong Tangpoonpholviwat |
[-] |
Thai |
35 |
|
Mrs. Pirom Saopayon |
[-] |
Thai |
52 |
|
Mrs. Nantapatch Thienprateep |
[-] |
Thai |
48 |
|
Ms. Jureerat Lapanavanich |
|
Thai |
37 |
|
Mr. Pagano Carlo |
|
Italian |
41 |
AUTHORIZED PERSON
One of the
mentioned directors [x]
can jointly sign
with anyone of
the mentioned directors
[-] on behalf
of the subject
with company’s affixed.
MANAGEMENT
Mr. Sitthichai
Leesawadtrakul is the
President & Chief
Executive Officer.
He is Thai
nationality with the
age of 35
years old.
Mrs. Duangkamol Sukmuang is
the Vice President
of General and
Administrative.
She is Thai
nationality.
Mr. Virat Kaewbangkaprom is
the Vice President
of Long Products.
He is Thai
nationality.
Ms. Suttirat Leesawadtrakul is
the Vice President
of Finance.
She is Thai
nationality with the
age of 31
years old.
Mrs. Pirom Saopayon is
the Vice President
of Accounting.
She is Thai
nationality with the
age of 52
years old.
Mr. Teerayuth Lertsiruangsan is
the Vice President
of Sales and
Marketing.
He is Thai
nationality.
BUSINESS OPERATIONS
The subject
is engaged in
manufacturing, distributing and
exporting various kinds
of hot rolled
steel products, such
as Concrete Steel
Bar, Deformed Bars,
Steel Plates, Terex
Bar, One Bar
and etc.
PRODUCTION CAPACITY
300,000 tons
per annum
PURCHASE
Most of raw
materials are purchased
from local suppliers,
the remaining is
imported from Japan,
Republic of China
and Australia.
MAJOR SUPPLIERS
Oriental Supreme Ltd. : Republic
of China
Millcon Steel Industries
Public Company Limited : Thailand
SALES
The products are sold
by wholesale to both
local and overseas, such
as Canada, Australia,
Korea, Taiwan, Republic
of China, Vietnam
and European countries.
MAJOR CUSTOMERS
Millcon Steel Industries
Public Company Limited : Thailand
G.J. Steel Public
company Limited : Thailand
SUBSIDIARY AND AFFILIATED
COMPANY
The subject is
not found to have any
subsidiary or affiliated
company here in
Thailand.
LITIGATION
Bankruptcy and Receivership
There are no
litigation on bankruptcy
and receivership cases
filed against the
subject found at
Legal Execution Department
for the past
five years.
Others
There are no
legal suits filed
against the subject
according for the
past two years.
CREDIT
Sales are by
cash or on
the credits term
of 30-60 days.
Local bills are
paid by cash
or on the
credits term of
30-60 days.
Imports are by
T/T.
Exports are against
T/T.
BANKING
Bangkok
Bank Public Co.,
Ltd.
EMPLOYMENT
The
subject employs approximately
230 office staff
and factory workers.
LOCATION
DETAILS
The premise is
owned for administrative office
and factory at
the heading address.
Premise is located
in provincial, in the
Eastern region.
Bangkok
Branch office:
29th Floor, Thaniya
Plaza Building, 52 Silom Rd., Suriyawongse, Bangrak,
Bangkok 10500. Tel. : [66] 2652-3333, Fax. : [66] 2632-9899.
ADDITIONAL INFORMATION
Burapa Steel Industries Co.,
Ltd. Announces Revised
Judgment of the
Central Administrative Court to
Suspend 65 Projects
in Map Ta Phut
09/9/2010.
As the Supreme Administrative Court revised an order of the Central
Administrative Court by ordering the relevant government authorities to suspend
65 projects in Map Ta Phut and nearby areas until otherwise ordered by the
Court, the expansion project of the company's subsidiary, namely BRP Steel Co.,
Ltd., which is determined as a project number 36 is one of the projects
referred in the attachment to the Complaint. The environmental impact
assessment (EIA) report of which has been approved by the Expert Committee and
the Office of the Natural Resources and Environmental Policy and Planning
(ONEP) on September 16, 2008. On September 2, 2010, the Central Administrative
Court ruled that the license of any of the 76 projects which fall into the 11
types of projects under the Notification of the Ministry of Natural Resources
and Environment dated August 31, 2010 re: 11 types and sizes of Serious Impact
Projects which require preparation of EIA report, shall be revoked. Mill Con
Steel Industries Public Company Limited informed that the expansion project of
BRP Steel Co., Ltd. plant can be continued.
Thailand Court Rejects Appeals of 16 Map Ta Phut Industrial Projects
05/5/2010
The Central Administrative Court has resolved to turn down the appeals
of the operators of 16 Map Ta Phut industrial projects, which were previously
suspended by the court's injunction. On January 22, 2010, the court rejected a
request for assistance filed by operators of a total of 30 suspended projects
located in Map Ta Phut industrial estate. Afterwards, 16 of the 30 projects
lodged appeals against the court's injunction; however, the appeals have been
dropped, and the operators are deprived of the rights to appeal further with
the Supreme Administrative Court. The 16 industrial projects are operated by 12
firms, namely Amata B.Grimm Power Service Limited, Vinythai Public Company
Limited, MTP HPJV C.V., Siam
Tinplate Company Limited, Ube Nylon (Thailand), Limited, Bangkok
Synthetics Co., Ltd., Burapa Steel Industries Co., Ltd., PTT Chemical Public
Company Limited, PTT Utilities Co, Ltd. and PTT Plc. The Administrative Court
earlier issued an injunction for 76 projects in Map Ta Phut industrial estate
to halt functioning for their failure to pass the environmental and health
impact assessments as required by the Constitution. 21 industrial projects are
presently allowed to resume operation while 55 others remain frozen.
COMMENT
The
subject is a manufacturer and
exporter of cast steel and ductile
cast iron parts. Its products
are used in
automotive industry especially
trucks, tractor and
trailers, water works part, electrical parts, rails system
parts, earth moving and agricultural parts, machinery parts, mining and cement manufacturing.
The company incorporates efficient
production facilities and world - class standard manufacturing technology
together with high attention to quality control system to ensure maximum customer
satisfaction and also
achieved ISO 9001 : 2000
certification.
With its extensive range of product
offerings, manufacturing technologies and engineering capabilities, it is
well-equipped to serve both domestic and foreign customers.
FINANCIAL INFORMATION
The
capital was registered
at Bht. 250,000,000
divided into 25,000,000
shares of Bht.
10 each with
fully paid.
The
capital was increased
and decreased later
as follows:
Bht. 173,927,020
on March 16,
2001
Bht. 286,963,510
on August 4,
2006
Bht. 386,963,510
on July 24,
2007
Bht. 497,524,515
on September 5,
2008
Bht. 968,973,945
on March 31,
2010
Bht.
1,968,973,945 on May
7, 2010
Bht.
2,599,352,545 on October
21, 2010
Bht.
2,244,177,345 on November
8, 2010 [decreased]
Bht.
2,399,999,990 on June
20, 2011
The latest
registered capital was
increased to Bht. 2,399,999,990 divided
into 479,999,998 shares
of Bht. 5 each
with fully paid.
MAIN
SHAREHOLDERS : [as
at May 27,
2012]
|
NAME |
HOLDING |
% |
|
|
|
|
|
Millcon Steel Industries
Public Company Limited Nationality: Thai Address : 9, 11, 13
Bangkradi 32 Rd.,
Samaedam,
Bangkhunthien, Bangkok |
473,909,920 |
98.73 |
|
Mr. Phanom Santhanasuk Nationality: Thai Address : 21/4
Moo 3, Bangkrasor,
Muang, Nonthaburi |
1,309,450 |
0.27 |
|
Mr. Varanchai Suksiri Nationality: Thai Address : 22
Soi Lasal 23,
Bangna, Bangkok |
709,950 |
0.15 |
|
Mrs. Ajcharee Muangjeen Nationality: Thai Address : 22
Soi Lasal 23,
Bangna, Bangkok |
709,950 |
0.15 |
|
Electra Fareast LP
Co., Ltd. Nationality: Hong Kong Address : 1
Connaughr Place, Hong
Kong |
685,990 |
0.14 |
|
Mr. Dol Plooksawad Nationality: Thai Address : 73
Sukhumvit 54 Rd.,
Bangchak, Prakanong, Bangkok |
573,191 |
0.12 |
|
Mrs. Srisamorn Prapakorn Nationality: Thai Address : 22
Soi Lasalle 23,
Bangna, Bangna, Bangkok |
557,535 |
0.12 |
|
Others |
1,544,012 |
0.32 |
Total Shareholders : 41
Share Structure [as
at April 27,
2012]
|
Nationality |
Shareholders |
No. of Share |
% Shares |
|
|
|
|
|
|
Thai |
40 |
479,314,008 |
99.86 |
|
Foreign - Hong Kong |
1 |
685,990 |
0.14 |
|
Total |
41 |
479,999,998 |
100.00 |
NAME OF AUDITOR
& CERTIFIED PUBLIC
ACCOUNTANT NO. :
Mr. Prasit Yuengsrikul No. 4174
BALANCE SHEET [BAHT]
The
latest financial figures
published for December
31, 2011, 2010
& 2009 were:
ASSETS
|
Current Assets |
2011 |
2010 [Adjusted] |
2009 |
|
|
|
|
|
|
Cash and Cash Equivalent |
19,444,838 |
12,283,998 |
12,638,831 |
|
Cash at Bank under Commitment |
40,100,000 |
- |
- |
|
Trade Accounts &
Notes Receivable |
209,068,127 |
79,815,117 |
755,075,356 |
|
Inventories |
1,515,732,308 |
998,487,701 |
584,077,055 |
|
Retention Receivable |
- |
- |
68,500,000 |
|
Receivable - Revenue Department
|
267,047,004 |
173,135,185 |
47,390,799 |
|
Advance Payment for
Goods & Constructor |
53,540,052 |
58,346,809 |
254,498,575 |
|
Short-term Lending to
Related Person |
7,157,463 |
47,757,232 |
16,601,200 |
|
Financial Derivatives Assets |
807,246 |
3,414,597 |
- |
|
Other Current Assets |
83,748,460 |
100,734,706 |
6,475,994 |
|
|
|
|
|
|
Total Current Assets
|
2,196,645,498 |
1,473,975,345 |
1,745,257,810 |
|
Cash at Bank under Commitment |
- |
40,100,000 |
100,000 |
|
Financial Derivatives Assets |
1,106,788 |
662,899 |
- |
|
Investment in Real Estate
|
87,837,663 |
- |
- |
|
Long-term Investment |
3,504,747 |
3,543,641 |
3,582,535 |
|
Fixed Assets |
4,510,407,879 |
2,078,199,757 |
779,798,221 |
|
Intangible Assets |
41,374,853 |
44,940,595 |
47,066,336 |
|
Other Assets |
1,449,669 |
2,496,050 |
1,858,633 |
|
Total Assets |
6,842,327,097 |
3,643,918,287 |
2,577,663,535 |
LIABILITIES &
SHAREHOLDERS’ EQUITY [BAHT]
|
Current
Liabilities |
2011 |
2010 [Adjusted] |
2009 |
|
|
|
|
|
|
Short-term Loan from Financial
Institute |
1,677,601,607 |
754,933,140 |
1,078,986,674 |
|
Short-term Loan from Discount Sales |
- |
- |
227,022,500 |
|
Trade Accounts Payable |
10,014,613 |
100,674,229 |
31,513,404 |
|
Related Company Payable |
- |
- |
16,601,200 |
|
Advance Received for Goods |
489,128,172 |
175,397,933 |
78,086,324 |
|
Current Portion of Long-term Loan from Financial
Institution |
130,886,953 |
- |
- |
|
Current Portion of Financial
Lease Contract Liabilities |
4,522,332 |
- |
- |
|
Current Portion of Duty
Tax |
- |
2,814,208 |
2,814,208 |
|
Other Payable |
334,092,944 |
118,619,426 |
- |
|
Financial Derivatives Liabilities |
6,195,217 |
18,673,004 |
- |
|
Other Current Liabilities |
20,610,134 |
25,639,788 |
22,061,590 |
|
|
|
|
|
|
Total Current Liabilities |
2,673,051,972 |
1,196,751,728 |
1,457,085,900 |
|
Financial Derivatives Liabilities |
- |
3,211,364 |
- |
|
Long-term Loan from Financial Institutions, Net
of Current Portion |
1,594,010,264 |
277,775,673 |
- |
|
Financial Lease Contract
Liabilities, Net of
Current Portion |
9,090,778 |
- |
- |
|
Employee Benefits Obligation |
660,150 |
- |
- |
|
Duty Tax, Net
of Current Portion |
- |
- |
2,814,208 |
|
Total Liabilities |
4,276,813,164 |
1,477,738,765 |
1,459,900,108 |
|
|
|
|
|
|
Shareholders’ Equity |
|
|
|
|
|
|
|
|
|
Share capital : Baht 5
par value Authorized &
issued share capital
519,870,509 shares in 2011
& 2010; 99,504,903
shares in 2009 respectively |
2,599,352,545 |
2,599,352,545 |
497,524,515 |
|
|
|
|
|
|
Capital Paid |
2,372,525,006 |
2,010,299,811 |
497,524,515 |
|
Premium on Share Capital |
66,336,603 |
66,336,603 |
66,336,603 |
|
Surplus on Revaluation
of Assets |
- |
- |
356,711,495 |
|
Statutory Reserve |
10,935,879 |
10,935,879 |
- |
|
Retained Earning-
Unappropriated |
115,716,445 |
78,607,229 |
197,190,814 |
|
Total Shareholders' Equity |
2,565,513,933 |
2,166,179,522 |
1,117,763,427 |
|
Total Liabilities &
Shareholders' Equity |
6,842,327,097 |
3,643,918,287 |
2,577,663,535 |
PROFIT &
LOSS ACCOUNT
|
Revenue |
2011 |
2010 [Adjusted] |
2009 |
|
|
|
|
|
|
Sales Income |
3,969,844,791 |
2,836,055,387 |
4,141,614,500 |
|
Other Income |
78,189,488 |
7,529,433 |
83,582,702 |
|
Total Revenues |
4,048,034,279 |
2,843,584,820 |
4,225,197,202 |
|
Expenses |
|
|
|
|
|
|
|
|
|
Cost of Goods
Sold |
3,849,637,605 |
2,677,001,466 |
3,972,268,698 |
|
Selling Expenses |
11,007,133 |
16,370,538 |
29,972,110 |
|
Administrative Expenses |
50,322,201 |
43,674,098 |
32,486,610 |
|
Other Expenses |
- |
13,922,327 |
- |
|
Total Expenses |
3,910,966,939 |
2,750,968,429 |
4,034,727,418 |
|
|
|
|
|
|
Profit before Financial
Cost & Income Tax |
137,067,340 |
92,616,391 |
190,469,784 |
|
Financial Cost |
[79,485,916] |
[46,812,181] |
[54,215,739] |
|
Profit before Income
Tax |
57,581,424 |
45,804,210 |
136,254,045 |
|
Income Tax |
[15,087,164] |
[3,809,896] |
- |
|
|
|
|
|
|
Net Profit / [Loss] |
42,494,260 |
41,994,314 |
136,254,045 |
FINANCIAL ANALYSIS
|
ITEM |
UNIT |
2011 |
2010 |
2009 |
|
|
|
|
|
|
|
LIQUIDITY RATIO |
|
|
|
|
|
CURRENT RATIO |
TIMES |
0.82 |
1.23 |
1.20 |
|
QUICK RATIO |
TIMES |
0.10 |
0.08 |
0.53 |
|
|
|
|
|
|
|
ACTIVITY RATIO |
|
|
|
|
|
FIXED ASSETS TURNOVER |
TIMES |
0.88 |
1.36 |
5.31 |
|
TOTAL ASSETS TURNOVER |
TIMES |
0.58 |
0.78 |
1.61 |
|
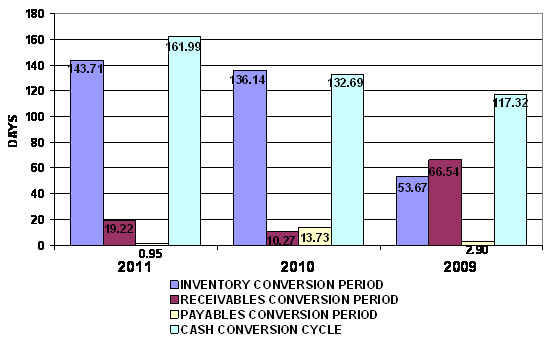
INVENTORY CONVERSION PERIOD |
DAYS |
143.71 |
136.14 |
53.67 |
|
INVENTORY TURNOVER |
TIMES |
2.54 |
2.68 |
6.80 |
|
RECEIVABLES CONVERSION PERIOD |
DAYS |
19.22 |
10.27 |
66.54 |
|
RECEIVABLES TURNOVER |
TIMES |
18.99 |
35.53 |
5.49 |
|
PAYABLES CONVERSION PERIOD |
DAYS |
0.95 |
13.73 |
2.90 |
|
CASH CONVERSION CYCLE |
DAYS |
161.99 |
132.69 |
117.32 |
|
|
|
|
|
|
|
PROFITABILITY
RATIO |
|
|
|
|
|
COST OF GOODS SOLD |
% |
96.97 |
94.39 |
95.91 |
|
SELLING & ADMINISTRATION |
% |
1.54 |
2.12 |
1.51 |
|
INTEREST |
% |
2.00 |
1.65 |
1.31 |
|
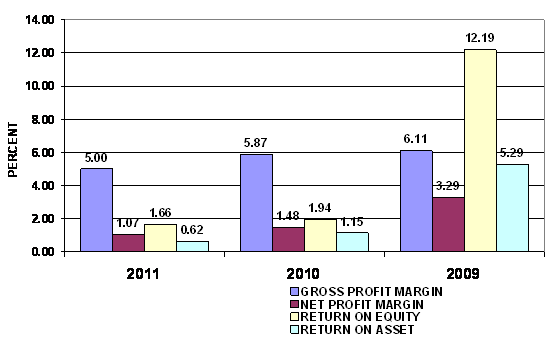
GROSS PROFIT MARGIN |
% |
5.00 |
5.87 |
6.11 |
|
NET PROFIT MARGIN BEFORE EX. ITEM |
% |
3.45 |
3.27 |
4.60 |
|
NET PROFIT MARGIN |
% |
1.07 |
1.48 |
3.29 |
|
RETURN ON EQUITY |
% |
1.66 |
1.94 |
12.19 |
|
RETURN ON ASSET |
% |
0.62 |
1.15 |
5.29 |
|
EARNING PER SHARE |
BAHT |
0.09 |
0.10 |
1.37 |
|
|
|
|
|
|
|
LEVERAGE RATIO |
|
|
|
|
|
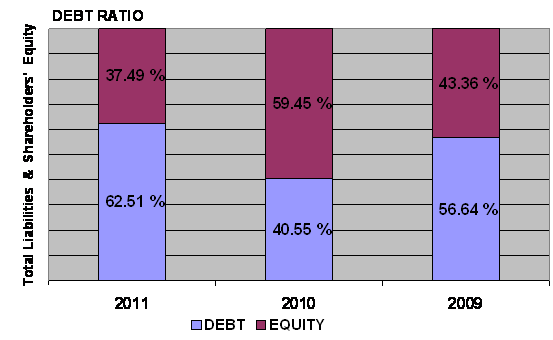
DEBT RATIO |
TIMES |
0.63 |
0.41 |
0.57 |
|
DEBT TO EQUITY RATIO |
TIMES |
1.67 |
0.68 |
1.31 |
|
TIME INTEREST EARNED |
TIMES |
1.72 |
1.98 |
3.51 |
|
|
|
|
|
|
|
ANNUAL GROWTH |
|
|
|
|
|
SALES GROWTH |
% |
39.98 |
(31.52) |
|
|
OPERATING PROFIT |
% |
47.99 |
(51.37) |
|
|
NET PROFIT |
% |
1.19 |
(69.18) |
|
|
FIXED ASSETS |
% |
117.03 |
166.50 |
|
|
TOTAL ASSETS |
% |
87.77 |
41.37 |
|
ANNUAL GROWTH :
EXCELLENT
An annual sales growth is 39.98%. Turnover has increased from THB
2,836,055,387.00 in 2010 to THB 3,969,844,791.00 in 2011. While net profit has
increased from THB 41,994,314.00 in 2010 to THB 42,494,260.00 in 2011. And
total assets has increased from THB 3,643,918,287.00 in 2010 to THB 6,842,327,097.00
in 2011.
PROFITABILITY :
SATISFACTORY
PROFITABILITY
RATIO
|
Gross Profit Margin |
5.00 |
Satisfactory |
Industrial
Average |
6.34 |
|
Net Profit Margin |
1.07 |
Satisfactory |
Industrial
Average |
1.14 |
|
Return on Assets |
0.62 |
Acceptable |
Industrial
Average |
1.22 |
|
Return on Equity |
1.66 |
Acceptable |
Industrial
Average |
2.51 |
Gross Profit Margin used to assess a firm's financial health by
revealing the proportion of money left over from revenues after accounting for
the cost of goods sold. Gross profit margin serves as the source for paying
additional expenses and future savings. The company's figure is 5%. When
compared with the industry average, the ratio of the company was lower, this
indicated that company may have problems with control over its costs.
Net Profit Margin is the indicator of the company's efficiency in that
net profit takes into consideration all expenses of the company. A low profit
margin indicates a low margin of safety, higher risk that a decline in sales
will erase profits and result in a net loss. The company's figure is 1.07%.
When compared with the industry average, the ratio of the company was lower.
Return on Assets measures how efficiently profits are being generated
from the assets employed in the business when compared with the ratios of firms
in a similar business. A low ratio in comparison with industry averages
indicates an inefficient use of business assets. When compared with the
industry average, it was lower, the company's figure is 0.62%.
Return on Equity indicates how profitable a company is by comparing its
net income to its average shareholders' equity, ROE measures how much the
shareholders earned for their investment in the company. When compared with the
industry average, it was lower, the company's figure is 1.66%.
Trend of the
average competitors in the same industry for last 5 years
Return on Assets Downtrend
Return on Equity Downtrend
LIQUIDITY : RISKY
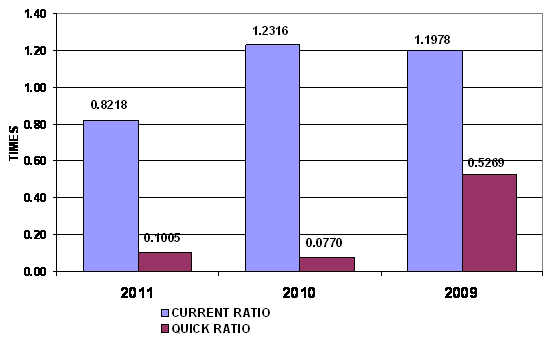
LIQUIDITY RATIO
|
Current Ratio |
0.82 |
Risky |
Industrial
Average |
1.03 |
|
Quick Ratio |
0.10 |
|
|
|
|
Cash Conversion Cycle |
161.99 |
|
|
|
The Current Ratio is to ascertain whether a company's short-term assets
are readily available to pay off its short-term liabilities. The company's
figure is 0.82 times in 2011, decreased from 1.23 times, then the company may
have problems meeting its short-term obligations. When compared with the
industry average, the ratio of the company was lower.
The Quick Ratio is a liquidity indicator that further refines the
current ratio by measuring the amount of the most liquid current assets there
are to cover current liabilities. The company's figure is 0.1 times in 2011,
increased from 0.08 times, then the company has not enough current assets that
presumably can be quickly converted to cash for pay financial obligations.
The Cash Conversion Cycle measures the number of days a company's cash
is tied up in the production and sales process of its operations and the
benefit from payment terms from its creditors. It meant the company could
survive when no cash inflow was received from sale for 162 days.
Trend of the
average competitors in the same industry for last 5 years
Current Ratio Downtrend
LEVERAGE :
IMPRESSIVE
LEVERAGE RATIO
|
Debt Ratio |
0.63 |
Impressive |
Industrial
Average |
0.65 |
|
Debt to Equity Ratio |
1.67 |
Acceptable |
Industrial
Average |
1.74 |
|
Times Interest Earned |
1.72 |
Impressive |
Industrial
Average |
1.37 |
Debt to Equity Ratio a measurement of how much suppliers, lenders,
creditors and obligors have committed to the company versus what the
shareholders have committed. A lower the percentage means that the company is
using less leverage and has a stronger equity position.
Times Interest Earned measuring a company's ability to meet its debt
obligations. Ratio is 1.73 higher than 1, so the company can pay interest
expenses on outstanding debt.
Debt Ratio shows the proportion of a company's assets which are financed
through debt. The company's figure is 0.63 greater than 0.5, most of the
company's assets are financed through debt.
Trend of the
average competitors in the same industry for last 5 years
Debt Ratio Downtrend
Times Interest Earned Downtrend
ACTIVITY :
ACCEPTABLE
ACTIVITY RATIO
|
Fixed Assets Turnover |
0.88 |
Deteriorated |
Industrial
Average |
2.83 |
|
Total Assets Turnover |
0.58 |
Deteriorated |
Industrial
Average |
1.24 |
|
Inventory Conversion Period |
143.71 |
|
|
|
|
Inventory Turnover |
2.54 |
Acceptable |
Industrial
Average |
3.78 |
|
Receivables Conversion Period |
19.22 |
|
|
|
|
Receivables Turnover |
18.99 |
Impressive |
Industrial
Average |
5.84 |
|
Payables Conversion Period |
0.95 |
|
|
|
The company's Account Receivable Ratio is calculated as 18.99 and 35.53
in 2011 and 2010 respectively. This ratio measures the efficiency of the
company in managing its trade debtors to generate revenue. A lower ratio may
indicate over extension and collection problems. Conversely, a higher ratio may
indicate an overtly stringent policy. In this case, the company's A/R ratio in
2011 decreased from 2010. This would suggest the company had deteriorated in
the management of its debt collections.
Inventory Turnover in Days Ratio indicates the liquidity of inventory.
It estimates the number of days that it will take to sell the current
inventory. Inventory is particularly sensitive to change in business
activities. The inventory turnover in days has increased from 136 days at the
end of 2010 to 144 days at the end of 2011. This represents a negative trend.
And Inventory turnover has decreased from 2.68 times in year 2010 to 2.54 times
in year 2011.
The company's Total Asset Turnover is calculated as 0.58 times and 0.78
times in 2011 and 2010 respectively. This ratio is determined by dividing total
assets into total sales turnover. The ratio measures the activity of the assets
and the ability of the firm to generate sales through the use of the assets.
Trend of the
average competitors in the same industry for last 5 years
Fixed Assets Turnover Downtrend
Total Assets Turnover Downtrend
Inventory Turnover Downtrend
Receivables Turnover Downtrend
FOREIGN EXCHANGE RATES
|
Currency |
Unit
|
Indian Rupees |
|
US Dollar |
1 |
Rs.54.44 |
|
|
1 |
Rs.83.77 |
|
Euro |
1 |
Rs.71.33 |
INFORMATION DETAILS
|
Report Prepared
by : |
PDT |
RATING EXPLANATIONS
|
RATING |
STATUS |
PROPOSED CREDIT LINE |
|
|
>86 |
Aaa |
Possesses an extremely sound financial base with the strongest
capability for timely payment of interest and principal sums |
Unlimited |
|
71-85 |
Aa |
Possesses adequate working capital. No caution needed for credit
transaction. It has above average (strong) capability for payment of interest
and principal sums |
Large |
|
56-70 |
A |
Financial & operational base are regarded healthy. General
unfavourable factors will not cause fatal effect. Satisfactory capability for
payment of interest and principal sums |
Fairly Large |
|
41-55 |
Ba |
Overall operation is considered normal. Capable to meet normal
commitments. |
Satisfactory |
|
26-40 |
B |
Capability to overcome financial difficulties seems comparatively
below average. |
Small |
|
11-25 |
Ca |
Adverse factors are apparent. Repayment of interest and principal sums
in default or expected to be in default upon maturity |
Limited with
full security |
|
<10 |
C |
Absolute credit risk exists. Caution needed to be exercised |
Credit not
recommended |
|
-- |
NB |
New Business |
-- |
This score serves as a reference to assess SC’s credit risk
and to set the amount of credit to be extended. It is calculated from a
composite of weighted scores obtained from each of the major sections of this
report. The assessed factors and their relative weights (as indicated through
%) are as follows:
Financial
condition (40%) Ownership
background (20%) Payment
record (10%)
Credit history
(10%) Market trend
(10%) Operational
size (10%)
This report is issued at your request without any
risk and responsibility on the part of MIRA INFORM PRIVATE LIMITED (MIPL)
or its officials.