MIRA
INFORM REPORT
|
Report Date : |
18.04.2013 |
IDENTIFICATION DETAILS
|
Name : |
MAHACHAK INTERNATIONAL CO., LTD. |
|
|
|
|
Registered Office : |
159/12 Moo 3, Vibhavadi Rangsit 64 Road, Taladbangkhen, Laksi, Bangkok 10210 |
|
|
|
|
Country : |
Thailand |
|
|
|
|
Financials (as on) : |
31.12.2011 |
|
|
|
|
Date of Incorporation : |
07.12.1994 |
|
|
|
|
Com. Reg. No.: |
0105537144378 |
|
|
|
|
Legal Form : |
Private Limited Company |
|
|
|
|
Line of Business : |
Importer and Distributor of Safety Materials and Medical Supplies |
|
|
|
|
No. of Employees : |
120 |
RATING & COMMENTS
|
MIRA’s Rating : |
Ba |
|
RATING |
STATUS |
PROPOSED CREDIT LINE |
|
|
41-55 |
Ba |
Overall operation is considered normal. Capable to meet normal
commitments. |
Satisfactory |
|
Status : |
Satisfactory |
|
Payment Behaviour : |
No Complaints |
|
Litigation : |
Clear |
NOTES :
Any query related to this report can be made
on e-mail: infodept@mirainform.com
while quoting report number, name and date.
ECGC Country Risk Classification List – June 30th, 2012
|
Country Name |
Previous Rating (31.03.2011) |
Current Rating (30.06.2012) |
|
Thailand |
B1 |
B1 |
|
Risk Category |
ECGC
Classification |
|
Insignificant |
A1 |
|
Low |
A2 |
|
Moderate |
B1 |
|
High |
B2 |
|
Very High |
C1 |
|
Restricted |
C2 |
|
Off-credit |
D |
THAILAND - ECONOMIC OVERVIEW
With a well-developed infrastructure, a free-enterprise
economy, generally pro-investment policies, and strong export industries,
Thailand achieved steady growth due largely to industrial and agriculture
exports - mostly electronics, agricultural commodities, automobiles and parts,
and processed foods. Thailand is trying to maintain growth by encouraging
domestic consumption and public investment to offset weak exports in 2012.
Unemployment, at less than 1% of the labor force, stands as one of the lowest
levels in the world, which puts upward pressure on wages in some industries.
Thailand also attracts nearly 2.5 million migrant workers from neighboring
countries. The Thai government is implementing a nation-wide 300 baht ($10) per
day minimum wage policy and deploying new tax reforms designed to lower rates
on middle-income earners. The Thai economy has weathered internal and external
economic shocks in recent years. The global economic severely cut Thailand's
exports, with most sectors experiencing double-digit drops. In 2009, the
economy contracted 2.3%. However, in 2010, Thailand's economy expanded 7.8%,
its fastest pace since 1995, as exports rebounded. In late 2011 growth was
interrupted by historic flooding in the industrial areas in Bangkok and its
five surrounding provinces, crippling the manufacturing sector. Industry
recovered from the second quarter of 2012 onward with GDP growth at 5.5% in
2012. The government has approved flood mitigation projects worth $11.7 billion,
which were started in 2012, to prevent similar economic damage, and an
additional $75 billion for infrastructure over the next seven years with a plan
to start in 2013.
Source
: CIA
Company name
MAHACHAK
INTERNATIONAL CO., LTD.
SUMMARY
BUSINESS
ADDRESS : 159/12 MOO
3, VIBHAVADI RANGSIT
64 ROAD,
TALADBANGKHEN, LAKSI,
BANGKOK 10210
TELEPHONE : [66] 2973-5522-30
FAX :
[66] 2973-5533,
2521-0825
E-MAIL
ADDRESS : mahachak@ii-net.com
REGISTRATION
ADDRESS : SAME
AS BUSINESS ADDRESS
ESTABLISHED
: 1994
REGISTRATION
NO. : 0105537144378
TAX
ID NO. : 3011532904
CAPITAL REGISTERED : BHT. 20,000,000
CAPITAL PAID-UP : BHT.
20,000,000
SHAREHOLDER’S PROPORTION : THAI :
100%
FISCAL YEAR CLOSING DATE : DECEMBER 31
LEGAL
STATUS : PRIVATE LIMITED
COMPANY
EXECUTIVE : MR. SARAVUTH PUTTHIVUTHIKUL, THAI
MANAGING DIRECTOR
NO.
OF STAFF : 120
LINES
OF BUSINESS : SAFETY MATERIALS
AND MEDICAL SUPPLIES
IMPORTER AND
DISTRIBUTOR
CORPORATE PROFILE
OPERATING
TREND : STABLE
PRESENT
SITUATION : OPERATING NORMALLY
REPUTATION : GOOD
WITH NORMAL BUSINESS
ENGAGEMENT
MANAGEMENT
STANDARD : MANAGEMENT WITH
GOOD PERFORMANCE
HISTORY
The
subject was established
on December 7, 1994
as a private
limited company under
the name style MAHACHAK INTERNATIONAL
CO., LTD., by
Thai groups. Its
business objective is to distribute
various kinds of
safety materials and
medical supplies to
domestic market. Subject
currently employs approximate
120 staff.
The
subject’s registered address
is 159/12 Moo 3,
Vibhavadi Rangsit 64 Rd., Taladbangkhen, Laksi, Bangkok
10210, and this
is the subject’s
current operation address.
THE BOARD
OF DIRECTOR
|
Name |
|
Nationality |
Age |
|
|
|
|
|
|
Mr. Saravuth Putthivuthikul |
[x] |
Thai |
62 |
|
Ms. Chanjira Putthivuthikul |
[-] |
Thai |
57 |
|
Mr. Krerkchai Suwacharangkura |
|
Thai |
67 |
|
Ms. Ampawan Ratanavipark |
[+] |
Thai |
59 |
|
Mrs. Punnee Pipattikanand |
|
Thai |
57 |
|
Mr. Charn Tangviwatwong |
|
Thai |
68 |
|
Ms. Rungnapa Mahattanawat |
[+] |
Thai |
51 |
AUTHORIZED PERSON
The mentioned director
[x] can sign
or the mentioned
director [-] can
jointly sign with
one of the
directors [+] on
behalf of the
subject with company’s
affixed.
MANAGEMENT
Mr. Saravuth Putthivuthikul is
the Managing Director.
He is Thai
nationality with the
age of 62
years old.
Mr. Krerkchai Suwacharangkura is
the Deputy Managing
Director, Sales &
Marketing Manager.
He is Thai
nationality with the
age of 67
years old.
BUSINESS OPERATIONS
The subject
is engaged in
importing and distributing
various kinds of
safety materials and
medical supplies such
as disposable face
mask, disposable gloves,
paper utensil, disposable
paper cup, surgical
tape and equipment,
syringes, thermometer, blade,
flow meter, sphygmomanometer, dental equipment,
sterilizing units, sterilizing
monitoring products, stethoscope
and etc.
PURCHASE
60% of the
products is purchased
from local suppliers,
the remaining 40%
is imported from
Korea, India, Spain,
France, Republic of
China, Japan, Malaysia,
Germany and United
States of America.
MAJOR SUPPLIERS
Becton
Dickinson & Company : United
States of America
Phoenix
Ltd. : Japan
Mani : Japan
SALES
100% of the
products is sold
locally to wholesalers
and end-users mainly
for hospital and medical
center of both
private and public
sectors.
SUBSIDIARY AND
AFFILIATED COMPANY
The subject is
not found to
have any subsidiary
or affiliated company here
in Thailand.
LITIGATION
Bankruptcy and Receivership
There are no
litigation on bankruptcy
and receivership cases
filed against the
subject found at
Legal Execution Department
for the past
five years.
Others
There are no
legal suits filed
against the subject
for the past
two years.
CREDIT
Sales are by
cash or on
the credits term
of 30-60 days.
Local bills are
paid by cash
or on the
credits term of
30-60 days.
Imports are by
L/C at sight
or T/T.
BANKING
Bangkok
Bank Public Co.,
Ltd.
Kasikornbank
Public Co., Ltd.
EMPLOYMENT
The
subject employs approximately
120 staff.
LOCATION DETAILS
The premise
is owned for
administrative office and warehouse
at the heading
address. Premise is
located in commercial/residential area.
COMMENT
Subject
is an importer
and distributor of
safety equipments and
medical supplies in
relation to health
care business. The
products are supplied
to hospital, clinic
and general healthcare
center. In general,
the subject’s operating
performance in 2011
was excellent, while
business outlook in 2013
remains excellent.
FINANCIAL INFORMATION
The
capital was registered
at Bht. 10,000,000 divided into
1,000,000 shares of
Bht. 10 each
with fully paid.
The
capital was increased
later as follows:
Bht. 15,000,000
on February 18,
2003
Bht. 20,000,000
on September 17,
2003
The
latest registered capital
was increased to Bht. 20,000,000 divided into
2,000,000 shares of
Bht. 10 each with
fully paid.
THE
SHAREHOLDERS LISTED WERE
: [as at
February 6, 2013]
|
NAME |
HOLDING |
% |
|
|
|
|
|
Mr. Saravuth Putthivuthikul Nationality: Thai Address : 43
Pradipat 15 Rd.,
Samsennai, Phyathai, Bangkok |
1,065,000 |
53.25 |
|
Ms. Chanjira Putthivuthikul Nationality: Thai Address : 43
Pradipat 15 Rd.,
Samsennai, Phyathai, Bangkok |
815,000 |
40.75 |
|
Ms. Rungnapa Mahattanawat Nationality: Thai Address : 171/406
Pradipat Rd., Samsennai,,
Phayathai, Bangkok |
30,000 |
1.50 |
|
Mr. Charn Tangviwatwong Nationality: Thai Address : 1679/3
Chan Rd., Thungwatdon, Sathorn, Bangkok |
30,000 |
1.50 |
|
Mrs. Sumalee Tangviwatwong Nationality: Thai Address : 1679/3
Chan Rd., Thungwatdon, Sathorn, Bangkok |
30,000 |
1.50 |
|
Mrs. Pallapa Chiarasathit Nationality: Thai Address : 53/29
Pradipat 15 Rd.,
Samsennai,
Phyathai, Bangkok |
30,000 |
1.50 |
Total Shareholders : 6
Share Structure [as
at February 6,
2013]
|
Nationality |
Shareholders |
No. of Share |
% Shares |
|
|
|
|
|
|
Thai |
6 |
2,000,000 |
100.00 |
|
Foreign |
- |
- |
- |
|
Total |
6 |
2,000,000 |
100.00 |
NAME OF AUDITOR
& CERTIFIED PUBLIC
ACCOUNTANT NO. :
Ms. Raveewal Piyayopanakul No.
2661
BALANCE SHEET [BAHT]
The
latest financial figures
published for December
31, 2011, 2010
& 2009 were:
ASSETS
|
Current Assets |
2011 |
2010 |
2009 |
|
|
|
|
|
|
Cash and Cash
Equivalents |
9,289,590.39 |
7,936,589.07 |
6,924,665.24 |
|
Postdated Cheque |
33,849,680.43 |
35,980,749.38 |
31,517,196.64 |
|
Trade Accounts Receivable |
53,760,531.03 |
45,809,712.74 |
47,333,602.04 |
|
Inventories |
111,825,732.74 |
94,574,730.37 |
109,480,688.43 |
|
Deposit Goods |
827,976.19 |
1,210,801.52 |
1,639,330.48 |
|
Other Current Assets
|
5,757,772.69 |
1,980,973.10 |
2,185,471.45 |
|
Total Current Assets
|
215,311,283.47 |
187,493,556.18 |
199,080,954.28 |
|
Fixed Assets |
268,906,499.23 |
210,897,477.15 |
159,926,349.89 |
|
Intangible Assets |
39,243.33 |
65,603.03 |
244,668.59 |
|
Other Non-current Assets |
3,376,430.40 |
6,496,521.24 |
4,895,023.63 |
|
Total Assets |
487,633,456.43 |
404,953,157.60 |
364,146,996.39 |
LIABILITIES &
SHAREHOLDERS' EQUITY [BAHT]
|
Current
Liabilities |
2011 |
2010 |
2009 |
|
|
|
|
|
|
Bank Overdraft |
7,394,486.45 |
10,152,131.47 |
7,473,938.88 |
|
Trade Accounts Payable |
119,689,059.92 |
89,228,352.49 |
91,421,751.14 |
|
Postdated Cheque |
69,428,473.83 |
74,829,487.67 |
70,014,941.03 |
|
Short-term Loans |
40,200,000.00 |
23,900,000.00 |
20,600,000.00 |
|
Withholding Income Tax |
696,653.15 |
233,184.66 |
128,986.47 |
|
Accrued Income Tax |
10,710,354.53 |
11,680,109.77 |
6,919,599.88 |
|
Accrued Expenses |
10,701,691.02 |
10,254,978.89 |
10,916,864.91 |
|
Other Current Liabilities |
15,200.00 |
150,000.00 |
178,166.47 |
|
Total Current Liabilities |
258,835,918.90 |
220,428,244.95 |
207,654,248.78 |
|
Long Term Loan |
16,703,523.00 |
17,923,523.00 |
31,363,523.00 |
|
Total Liabilities |
275,539,441.90
|
238,351,676.95 |
239,017,771.78 |
|
|
|
|
|
|
Shareholders' Equity |
|
|
|
|
|
|
|
|
|
Share capital : Baht 10
par value authorized, issued
and fully paid share
capital 2,000,000 shares |
20,000,000.00 |
20,000,000.00 |
20,000,000.00 |
|
Capital Paid |
20,000,000.00 |
20,000,000.00 |
20,000,000.00 |
|
Statutory Reserve |
2,000,000.00 |
2,000,000.00 |
2,000,000.00 |
|
Retained Earning -
Unappropriated |
190,094,014.53 |
144,601,389.65 |
103,129,224.61 |
|
Total Shareholders' Equity |
212,094,014.53 |
166,601,389.65 |
125,129,224.61 |
|
Total Liabilities &
Shareholders' Equity |
487,633,456.43 |
404,953,157.60 |
364,146,996.39 |
PROFIT &
LOSS ACCOUNT
|
Revenue |
2011 |
2010 |
2009 |
|
|
|
|
|
|
Sales |
784,151,777.74 |
729,689,906.25 |
682,292,229.37 |
|
Other Income |
|
|
|
|
Rental Income |
40,000.00 |
60,000.00 |
60,000.00 |
|
Interest Income |
102,917.14 |
39,316.34 |
185,264.88 |
|
Gain on Disposal of Assets |
238,315.76 |
238,111.45 |
309,183.92 |
|
Gain / [Loss] on Exchange Rate |
[3,489,642.17] |
3,048,260.90 |
2,807,395.36 |
|
Others |
970,050.87 |
220,063.43 |
596,941.16 |
|
Total Revenues |
782,013,419.34 |
733,295,658.46 |
686,251,014.69 |
|
Expenses |
|
|
|
|
|
|
|
|
|
Cost of Goods
Sold |
644,954,577.33 |
606,829,815.37 |
574,801,772.04 |
|
Selling Expenses |
9,094,445.44 |
8,317,058.87 |
7,640,290.92 |
|
Administrative Expenses |
58,815,427.91 |
55,665,926.16 |
60,238,218.26 |
|
Total Expenses |
712,864,450.68 |
670,812,800.40 |
642,680,281.22 |
|
Profit before Financial
Cost & Income Tax |
69,148,968.66 |
62,482,858.06 |
43,570,733.47 |
|
Financial Cost |
[3,339,119.63] |
[2,579,601.24] |
[3,693,045.42] |
|
Profit before Income
Tax |
65,809,849.03 |
59,903,256.82 |
39,877,688.05 |
|
Income Tax |
[20,317,224.15] |
[18,431,091.78] |
[13,373,411.66] |
|
Net Profit / [Loss] |
45,492,624.88 |
41,472,165.04 |
26,504,276.39 |
FINANCIAL ANALYSIS
|
ITEM |
UNIT |
2011 |
2010 |
2009 |
|
|
|
|
|
|
|
LIQUIDITY RATIO |
|
|
|
|
|
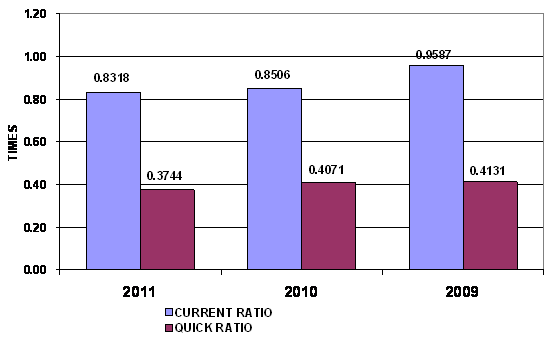
CURRENT RATIO |
TIMES |
0.83 |
0.85 |
0.96 |
|
QUICK RATIO |
TIMES |
0.37 |
0.41 |
0.41 |
|
|
|
|
|
|
|
ACTIVITY RATIO |
|
|
|
|
|
FIXED ASSETS TURNOVER |
TIMES |
2.92 |
3.46 |
4.27 |
|
TOTAL ASSETS TURNOVER |
TIMES |
1.61 |
1.80 |
1.87 |
|
INVENTORY CONVERSION PERIOD |
DAYS |
63.29 |
56.89 |
69.52 |
|
INVENTORY TURNOVER |
TIMES |
5.77 |
6.42 |
5.25 |
|
RECEIVABLES CONVERSION PERIOD |
DAYS |
25.02 |
22.91 |
25.32 |
|
RECEIVABLES TURNOVER |
TIMES |
14.59 |
15.93 |
14.41 |
|
PAYABLES CONVERSION PERIOD |
DAYS |
67.74 |
53.67 |
58.05 |
|
CASH CONVERSION CYCLE |
DAYS |
20.57 |
26.13 |
36.79 |
|
|
|
|
|
|
|
PROFITABILITY
RATIO |
|
|
|
|
|
COST OF GOODS SOLD |
% |
82.25 |
83.16 |
84.25 |
|
SELLING & ADMINISTRATION |
% |
8.66 |
8.77 |
9.95 |
|
INTEREST |
% |
0.43 |
0.35 |
0.54 |
|
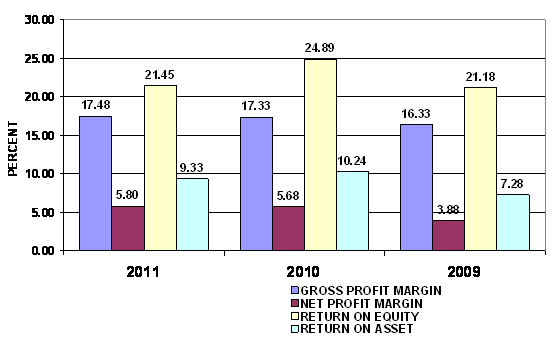
GROSS PROFIT MARGIN |
% |
17.48 |
17.33 |
16.33 |
|
NET PROFIT MARGIN BEFORE EX. ITEM |
% |
8.82 |
8.56 |
6.39 |
|
NET PROFIT MARGIN |
% |
5.80 |
5.68 |
3.88 |
|
RETURN ON EQUITY |
% |
21.45 |
24.89 |
21.18 |
|
RETURN ON ASSET |
% |
9.33 |
10.24 |
7.28 |
|
EARNING PER SHARE |
BAHT |
22.75 |
20.74 |
13.25 |
|
|
|
|
|
|
|
LEVERAGE RATIO |
|
|
|
|
|
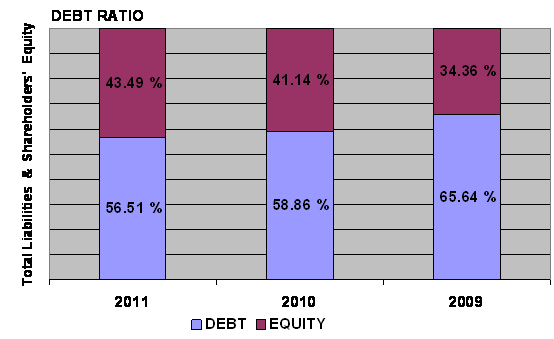
DEBT RATIO |
TIMES |
0.57 |
0.59 |
0.66 |
|
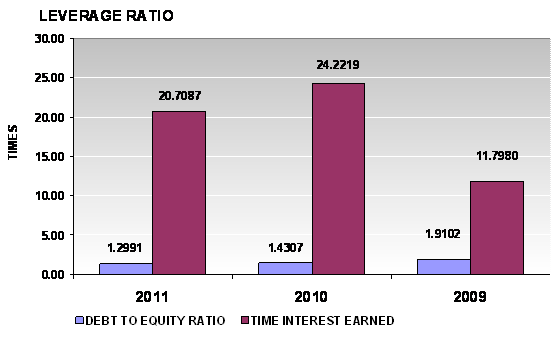
DEBT TO EQUITY RATIO |
TIMES |
1.30 |
1.43 |
1.91 |
|
TIME INTEREST EARNED |
TIMES |
20.71 |
24.22 |
11.80 |
|
|
|
|
|
|
|
ANNUAL GROWTH |
|
|
|
|
|
SALES GROWTH |
% |
7.46 |
6.95 |
|
|
OPERATING PROFIT |
% |
10.67 |
43.41 |
|
|
NET PROFIT |
% |
9.69 |
56.47 |
|
|
FIXED ASSETS |
% |
27.51 |
31.87 |
|
|
TOTAL ASSETS |
% |
20.42 |
11.21 |
|
ANNUAL GROWTH :
EXCELLENT
An annual sales growth is 7.46%. Turnover has increased from THB
PROFITABILITY :
IMPRESSIVE
PROFITABILITY
RATIO
|
Gross Profit Margin |
17.48 |
Acceptable |
Industrial Average |
23.49 |
|
Net Profit Margin |
5.80 |
Impressive |
Industrial Average |
2.23 |
|
Return on Assets |
9.33 |
Impressive |
Industrial Average |
4.38 |
|
Return on Equity |
21.45 |
Impressive |
Industrial Average |
11.28 |
Gross Profit Margin used to assess a firm's financial health by
revealing the proportion of money left over from revenues after accounting for
the cost of goods sold. Gross profit margin serves as the source for paying
additional expenses and future savings. The company's figure is 17.48%. When
compared with the industry average, the ratio of the company was lower, this
indicated that company may have problems with control over its costs.
Net Profit Margin is the indicator of the company's efficiency in that
net profit takes into consideration all expenses of the company. A low profit
margin indicates a low margin of safety, higher risk that a decline in sales
will erase profits and result in a net loss. The company's figure is 5.8% compared with those of its average
competitors in the same industry, indicated that business was an efficient
operator in a dominant position within its
industry.
Return on Assets measures how efficiently profits are being generated
from the assets employed in the business when compared with the ratios of firms
in a similar business. A low ratio in comparison with industry averages
indicates an inefficient use of business assets. Return on Assets ratio is
9.33%, higher figure when compared with those of its average competitors
in the same industry, indicated that business was an efficient profit in a dominant position within its industry.
Return on Equity indicates how profitable a company is by comparing its net
income to its average shareholders' equity, ROE measures how much the
shareholders earned for their investment in the company. Return on Equity ratio
is 21.45%, higher figure when compared with those of its average competitors in
the same industry, indicated that business was an efficient profit in a dominant position within its industry.
Trend of the
average competitors in the same industry for last 5 years
Return on Assets Uptrend
Return on Equity Downtrend
LIQUIDITY :
ACCEPTABLE
LIQUIDITY RATIO
|
Current Ratio |
0.83 |
Risky |
Industrial
Average |
1.66 |
|
Quick Ratio |
0.37 |
|
|
|
|
Cash Conversion Cycle |
20.57 |
|
|
|
The Current Ratio is to ascertain whether a company's short-term assets are
readily available to pay off its short-term liabilities. The company's figure
is 0.83 times in 2011, decreased from 0.85 times, then the company may have
problems meeting its short-term obligations. When compared with the industry
average, the ratio of the company was lower.
The Quick Ratio is a liquidity indicator that further refines the
current ratio by measuring the amount of the most liquid current assets there
are to cover current liabilities. The company's figure is 0.37 times in 2011,
decreased from 0.41 times, then the company has not enough current assets that
presumably can be quickly converted to cash for pay financial obligations.
The Cash Conversion Cycle measures the number of days a company's cash
is tied up in the production and sales process of its operations and the
benefit from payment terms from its creditors. It meant the company could
survive when no cash inflow was received from sale for 21 days.
Trend of the
average competitors in the same industry for last 5 years
Current Ratio Uptrend
LEVERAGE :
IMPRESSIVE
LEVERAGE RATIO
|
Debt Ratio |
0.57 |
Impressive |
Industrial
Average |
0.59 |
|
Debt to Equity Ratio |
1.30 |
Acceptable |
Industrial
Average |
1.40 |
|
Times Interest Earned |
20.71 |
Impressive |
Industrial
Average |
4.39 |
Debt to Equity Ratio a measurement of how much suppliers, lenders,
creditors and obligors have committed to the company versus what the
shareholders have committed. A lower the percentage means that the company is
using less leverage and has a stronger equity position.
Times Interest Earned measuring a company's ability to meet its debt
obligations. Ratio is 20.71 higher than 1, so the company can pay interest
expenses on outstanding debt.
Debt Ratio shows the proportion of a company's assets which are financed
through debt. The company's figure is 0.57 greater than 0.5, most of the
company's assets are financed through debt.
Trend of the
average competitors in the same industry for last 5 years
Debt Ratio Downtrend
Times Interest Earned Uptrend
ACTIVITY :
SATISFACTORY

ACTIVITY RATIO
|
Fixed Assets Turnover |
2.92 |
Deteriorated |
Industrial
Average |
9.02 |
|
Total Assets Turnover |
1.61 |
Satisfactory |
Industrial
Average |
1.94 |
|
Inventory Conversion Period |
63.29 |
|
|
|
|
Inventory Turnover |
5.77 |
Impressive |
Industrial
Average |
3.98 |
|
Receivables Conversion Period |
25.02 |
|
|
|
|
Receivables Turnover |
14.59 |
Impressive |
Industrial
Average |
2.86 |
|
Payables Conversion Period |
67.74 |
|
|
|
The company's Account Receivable Ratio is calculated as 14.59 and
Inventory Turnover in Days Ratio indicates the liquidity of inventory.
It estimates the number of days that it will take to sell the current
inventory. Inventory is particularly sensitive to change in business
activities. The inventory turnover in days has increased from 57 days at the
end of 2010 to 63 days at the end of 2011. This represents a negative trend.
And Inventory turnover has decreased from 6.42 times in year 2010 to 5.77 times
in year 2011.
The company's Total Asset Turnover is calculated as 1.61 times and 1.8
times in 2011 and 2010 respectively. This ratio is determined by dividing total
assets into total sales turnover. The ratio measures the activity of the assets
and the ability of the firm to generate sales through the use of the assets.
Trend of the
average competitors in the same industry for last 5 years
Fixed Assets Turnover Downtrend
Total Assets Turnover Downtrend
Inventory Turnover Downtrend
Receivables Turnover Downtrend
FOREIGN EXCHANGE RATES
|
Currency |
Unit
|
Indian Rupees |
|
US Dollar |
1 |
Rs.53.94 |
|
|
1 |
Rs.82.76 |
|
Euro |
1 |
Rs.71.04 |
INFORMATION DETAILS
|
Report
Prepared by : |
PRL |
RATING EXPLANATIONS
|
RATING |
STATUS |
PROPOSED CREDIT LINE |
|
|
>86 |
Aaa |
Possesses an extremely sound financial base with the strongest
capability for timely payment of interest and principal sums |
Unlimited |
|
71-85 |
Aa |
Possesses adequate working capital. No caution needed for credit
transaction. It has above average (strong) capability for payment of interest
and principal sums |
Large |
|
56-70 |
A |
Financial & operational base are regarded healthy. General unfavourable
factors will not cause fatal effect. Satisfactory capability for payment of
interest and principal sums |
Fairly Large |
|
41-55 |
Ba |
Overall operation is considered normal. Capable to meet normal
commitments. |
Satisfactory |
|
26-40 |
B |
Capability to overcome financial difficulties seems comparatively
below average. |
Small |
|
11-25 |
Ca |
Adverse factors are apparent. Repayment of interest and principal sums
in default or expected to be in default upon maturity |
Limited with full
security |
|
<10 |
C |
Absolute credit risk exists. Caution needed to be exercised |
Credit not
recommended |
|
-- |
NB |
New Business |
-- |
This score serves as a reference to assess SC’s credit risk and
to set the amount of credit to be extended. It is calculated from a composite
of weighted scores obtained from each of the major sections of this report. The
assessed factors and their relative weights (as indicated through %) are as
follows:
Financial
condition (40%) Ownership
background (20%) Payment
record (10%)
Credit history
(10%) Market trend
(10%) Operational
size (10%)
This report is issued at your request without any
risk and responsibility on the part of MIRA INFORM PRIVATE LIMITED (MIPL) or
its officials.