MIRA
INFORM REPORT
|
Report Date : |
20.04.2013 |
IDENTIFICATION DETAILS
|
Name : |
THE
ERAWAN AGRICULTURAL CHEMICALS
CO., LTD. |
|
|
|
|
Registered Office : |
15/7
Ladprao 33 Road,
Chankasem, Jatujak, Bangkok 10900 |
|
|
|
|
Country : |
Thailand |
|
|
|
|
Financials (as on) : |
31.12.2011 |
|
|
|
|
Date of Incorporation : |
19.01.1982 |
|
|
|
|
Com. Reg. No.: |
0105525002131 [Former : 213/2525] |
|
|
|
|
Legal Form : |
Private
Limited Company |
|
|
|
|
Line of Business : |
Formulator & distributor of agro-chemicals |
|
|
|
|
No. of Employees : |
230 |
RATING & COMMENTS
|
MIRA’s Rating : |
Ba |
|
RATING |
STATUS |
PROPOSED CREDIT LINE |
|
|
41-55 |
Ba |
Overall operation is considered normal. Capable to meet normal
commitments. |
Satisfactory |
|
Status : |
Satisfactory |
|
Payment Behaviour : |
No Complaints |
|
Litigation : |
Clear |
NOTES:
Any query related to this report can be made
on e-mail: infodept@mirainform.com
while quoting report number, name and date.
ECGC Country Risk Classification List – June 30th, 2012
|
Country Name |
Previous Rating (31.03.2012) |
Current Rating (30.06.2012) |
|
Thailand |
b1 |
b1 |
|
Risk Category |
ECGC
Classification |
|
Insignificant |
A1 |
|
Low |
A2 |
|
Moderate |
B1 |
|
High |
B2 |
|
Very High |
C1 |
|
Restricted |
C2 |
|
Off-credit |
D |
thailand ECONOMIC OVERVIEW
With a
well-developed infrastructure, a free-enterprise economy, generally
pro-investment policies, and strong export industries, Thailand achieved steady
growth due largely to industrial and agriculture exports - mostly electronics,
agricultural commodities, automobiles and parts, and processed foods. Thailand
is trying to maintain growth by encouraging domestic consumption and public
investment to offset weak exports in 2012. Unemployment, at less than 1% of the
labor force, stands as one of the lowest levels in the world, which puts upward
pressure on wages in some industries. Thailand also attracts nearly 2.5 million
migrant workers from neighboring countries. The Thai government is implementing
a nation-wide 300 baht ($10) per day minimum wage policy and deploying new tax
reforms designed to lower rates on middle-income earners. The Thai economy has
weathered internal and external economic shocks in recent years. The global
economic severely cut Thailand's exports, with most sectors experiencing
double-digit drops. In 2009, the economy contracted 2.3%. However, in 2010,
Thailand's economy expanded 7.8%, its fastest pace since 1995, as exports
rebounded. In late 2011 growth was interrupted by historic flooding in the
industrial areas in Bangkok and its five surrounding provinces, crippling the
manufacturing sector. Industry recovered from the second quarter of 2012 onward
with GDP growth at 5.5% in 2012. The government has approved flood mitigation
projects worth $11.7 billion, which were started in 2012, to prevent similar
economic damage, and an additional $75 billion for infrastructure over the next
seven years with a plan to start in 2013.
|
Source : CIA |
Company name
THE ERAWAN AGRICULTURAL
CHEMICALS CO., LTD.
SUMMARY
BUSINESS
ADDRESS : 15/7
LADPRAO 33 ROAD,
CHANKASEM,
JATUJAK, BANGKOK
10900, THAILAND
TELEPHONE : [66] 2513-5251
FAX :
[66] 2513-3181
E-MAIL
ADDRESS : info@erawanagri.com
REGISTRATION
ADDRESS : SAME
AS BUSINESS ADDRESS
ESTABLISHED
: 1982
REGISTRATION
NO. : 0105525002131 [Former : 213/2525]
TAX
ID NO. : 3101174274
CAPITAL REGISTERED : BHT. 500,000,000
CAPITAL PAID-UP : BHT.
500,000,000
SHAREHOLDER’S PROPORTION : THAI :
100%
FISCAL YEAR CLOSING DATE : DECEMBER 31
LEGAL
STATUS : PRIVATE LIMITED
COMPANY
EXECUTIVE : MR.
SEREE SUPHANTHARIDA, THAI
PRESIDENT AND
MANAGING DIRECTOR
NO.
OF STAFF : 230
LINES
OF BUSINESS : AGRO-CHEMICALS
FORMULATOR &
DISTRIBUTOR
CORPORATE PROFILE
OPERATING
TREND : STABLE
PRESENT
SITUATION : OPERATING NORMALLY
REPUTATION : GOOD
WITH NORMAL BUSINESS
ENGAGEMENT
MANAGEMENT
STANDARD : MANAGEMENT WITH
GOOD PERFORMANCE
HISTORY
The subject was
established on January
19, 1982 as
a private limited
company under the
name style THE ERAWAN
AGRICULTURAL CHEMICALS CO.,
LTD. by Thai
groups, in order to formulate and
distribute agro-chemical to
local market. It currently
employs approximate 230
staff.
The subject’s registered
address is 15/7 Ladprao
33 Rd., Chankasem,
Jatujak, Bangkok 10900,
and this is
the company’s current
operation address.
THE BOARD
OF DIRECTORS
|
Name |
|
Nationality |
Age |
|
|
|
|
|
|
Mr. Seree Suphantharida |
[x] |
Thai |
67 |
|
Mrs. Kulrat Suphantharida |
[+] |
Thai |
62 |
|
Mr. Chanavee Suphantharida |
[+] |
Thai |
37 |
|
Mr. Sarawuth Suphantharida |
[+] |
Thai |
38 |
|
Ms. Thareesawas Sukhantarat |
|
Thai |
61 |
|
Ms. Wanna Pitisuksombat |
[+] |
Thai |
57 |
AUTHORIZED PERSON
Only the mentioned
director [x] signs or two
of the
directors [+] can
jointly sign on
behalf of the
subject with company’s
affixed.
MANAGEMENT
Mr. Seree Suphantharida is
the President and
Managing Director.
He is Thai nationality
with the age
of 67 years old.
Ms. Wanna Pitisuksombat is
the Executive Director.
She is Thai
nationality with the
age of 57
years old.
Mrs. Kulrat Suphantharida is
the Executive Director.
She is Thai
nationality with the
age of 62
years old.
Mr. Chanavee Suphantharida is
the Executive Director.
He is Thai
nationality with the
age of 37
years old.
Ms. Pruetsuda Suphantharida is
the Quality Control & Factory Manager.
She is Thai
nationality.
Mr. Kosol Nakrueng
is the Marketing
& Sales Director.
He is Thai
nationality.
Mr. Sarawuth Suphantharida is
the Sales Manager
He is Thai
nationality.
BUSINESS OPERATIONS
The subject’s activities are formulator
and distributor of agricultural chemicals. The products
are insecticide, fungicide,
liquid herbicide, herbicide,
foliar fertilizer, Paraquat
Dichloride, plant growth
regulator and etc., with more than
100 different kinds
and trade names
of products, under
its owned brand “ERAWAN”.
PRODUCTION CAPACITY
Fertilizer : 5
tons/day
Fungicide : 3-5
tons/day
Insecticide : 15-35
tons/day
Paraquat Dicloride & : 18 tons/day
- Glyphosate
Liquid Herbicide : 15 tons/day
Powder Herbicide : 3-5 tons/day
PURCHASE
Raw chemicals are
imported from Republic
of China, Malaysia,
Taiwan, Japan, Hong
Kong, Singapore, Korea,
U.K., Denmark, India,
Israel, Germany, Italy
and France, and
the remaining is
purchased from local
suppliers and agents.
MAJOR SUPPLIERS
- Kunshan Chemical material
Co., Ltd.: Republic
of China
- Cheminova Agro A/S : Denmark
- Sinon Corporation : Taiwan
- BASF [Thai] Ltd. : Thailand
- Bayer Thai Co.,
Ltd. : Thailand
SALES [LOCAL]
100% of its
products is sold
locally by wholesale
through approximately 650
dealers, as well
as end-users.
RELATED/AFFILIATED COMPANIES
The Siam AG
Marketing Co., Ltd.
Business Type : Distributor
of agro-chemical
The Aiyara Agricultural
Chemicals Co., Ltd.
Business Type : Distributor of
agricultural chemical
The Aiyara Packaging
Co., Ltd.
Business Type : Packaging service
LITIGATION
Bankruptcy and
Receivership
There are no
litigation on bankruptcy
and receivership cases
filed against the
subject found at
Legal Execution Department
for the past
five years.
Others
There are no
legal suits filed
against the subject
for the past
two years.
CREDIT
Sales are by
cash or on
the credits term
of 30-60 days.
Local bills are
paid by cash
or on the
credits term of
30-60 days.
Imports are by
T/T.
BUSINESS TRANSACTION
The products are
sold to customers
mainly by credit,
with the maximum credit
given at 60 days. The
subject is not
found to have
payment problem on
both accounts receivable
and accounts payable.
BANKING
Bangkok Bank Public
Co., Ltd.
[Ladprao Branch
: 1150 Phaholyothin
Rd., Ladyao, Jatujak,
Bangkok 10900]
TMB Bank Public
Co., Ltd.
Siam Commercial Bank
Public Co., Ltd.
EMPLOYMENT
The subject employs
approximately 230 staff comprising
administrative, sales and
workers.
LOCATION DETAILS
The premise is owned
for administrative office
at the heading
address. Premise is located
in commercial/residential area.
Factory and warehouse
are located at
80 Moo 4,
Soi Nongkhayang 10,
Yingpaotai Rd., Sanamchan,
Muang, Nakornpathom 73000.
Premises is on
28,800 square meters
of area.
Tel : [66] 34 960-839-40 Fax :
[66] 34 960-838
COMMENT
The subject is the leading supplier of
agricultural chemicals, which has been in Thailand’s market with high
recognition from its clients for more than three decades. Since its
establishment in Thailand 31 years ago, the subject has well performed in
trading of agricultural chemicals with significant development
on product port folio,
formulation and re-packing
plant.
The subject is one of the country’s leading suppliers of agrochemical products.
FINANCIAL INFORMATION
The capital was
initially registered at
Bht. 1,500,000 divided into
1,500 shares of
Bht. 1,000 each.
The capital was
increased later as
followings :
Bht. 3,500,000
on April 20,
1987
Bht. 15,000,000
on August 7,
1992
Bht. 18,000,000
on November 22,
1994
Bht. 30,000,000
on December 9,
1999
Bht. 100,000,000 on
October 31, 2002
Bht. 500,000,000 on
December 21, 2012
The latest registered
capital was increased to Bht. 500,000,000 divided
into 500,000 shares
of Bht. 1,000
each with fully
paid.
THE SHAREHOLDERS LISTED
WERE: [as at
December 21, 2012]
|
NAME |
HOLDING |
% |
|
|
|
|
|
Mr. Seree Suphantharida Nationality: Thai Address : 4/49
Sukhapibal 1 Rd.,
Bangkae, Pasicharoen, Bangkok |
322,000 |
64.40 |
|
Ms. Pruetsuda Suphantharida Nationality: Thai Address : 4/49
Sukhapibal 1 Rd.,
Bangkae, Pasicharoen, Bangkok |
34,160 |
6.83 |
|
Mr. Chanavee Suphantharida Nationality: Thai Address : 15/12
Ladprao 33, Ladprao
Rd., Ladyao,
Jatujak, Bangkok |
34,155 |
6.83 |
|
Mr. Pinetawee Suphantharida Nationality: Thai Address : 4/49
Sukhapibal 1 Rd., Bangkae,
Pasicharoen, Bangkok |
33,000 |
6.60 |
|
Ms. Trihathai Suphantharida Nationality: Thai Address : 4/49
Sukhapibal 1 Rd., Bangkae,
Pasicharoen, Bangkok |
33,000 |
6.60 |
|
Mrs. Kulrat Suphantharida Nationality: Thai Address : 15/10
Ladprao 33, Ladprao
Rd., Ladyao,
Jatujak, Bangkok |
31,435 |
6.29 |
|
Ms. Wanna Pitisuksombat Nationality: Thai Address : 2001/70
Moo 5, Dindaeng,
Bangkok |
10,200 |
2.04 |
|
Ms. Thareesawas Sukhantarat Nationality: Thai Address : 15/7
Ladprao Rd., Ladyao,
Jatujak, Bangkok |
2,050 |
0.41 |
Total Shareholders : 8
Share Structure [as
at December 21,
2012]
|
Nationality |
Shareholders |
No. of Share |
% Shares |
|
|
|
|
|
|
Thai |
8 |
500,000 |
100.00 |
|
Foreign |
- |
- |
- |
|
Total |
8 |
500,000 |
100.00 |
NAME OF AUDITOR
& CERTIFIED PUBLIC
ACCOUNTANT NO. :
Mr. Chomsak Puthamilinprateep No.
4955
BALANCE SHEET [BAHT]
The latest financial figures published
as at December
31, 2011, 2010
& 2009 were:
ASSETS
|
Current Assets |
2011 |
2010 |
2009 |
|
|
|
|
|
|
Cash and Cash Equivalents |
11,400,466.11 |
17,863,649.72 |
22,946,252.74 |
|
Short-term Investment |
213,500,000.00 |
- |
- |
|
Trade Accounts &
Notes Receivable |
154,904,340.70 |
86,353,230.32 |
224,887,409.14 |
|
Inventories |
173,264,228.33 |
276,262,151.61 |
259,049,029.53 |
|
Prepaid Expenses of
Goods |
39,073,480.00 |
41,731,702.90 |
3,449,050.20 |
|
Other Prepaid Expenses
|
6,173,463.85 |
4,464,352.23 |
1,866,218.72 |
|
Deposit Assets |
13,660,172.55 |
1,518,883.19 |
- |
|
Other Current Assets
|
1,841,091.56 |
1,544,377.62 |
1,712,532.88 |
|
|
|
|
|
|
Total Current Assets
|
613,817,243.10 |
429,738,347.59 |
513,910,493.21 |
|
Cash at Bank
Pledged as a
Collateral |
7,500,618.33 |
12,976,645.21 |
12,807,227.34 |
|
Fixed Assets |
347,127,519.01 |
314,317,175.93 |
267,450,799.34 |
|
Other Non-current Assets |
366,800.00 |
366,800.00 |
366,800.00 |
|
Total Assets |
968,812,180.44 |
757,398,968.73 |
794,535,319.89 |
LIABILITIES &
SHAREHOLDERS' EQUITY [BAHT]
|
Current
Liabilities |
2011 |
2010 |
2009 |
|
|
|
|
|
|
Bank Overdraft &
Loan from Bank |
115,187,155.83 |
237,153,947.48 |
257,346,562.40 |
|
Related Companies Payable |
504,400,000.00 |
85,545,000.00 |
126,313,406.55 |
|
Trade Accts. &
Notes Payable |
69,895,450.39 |
150,338,401.23 |
147,419,711.49 |
|
Deferred Advance Income for Goods |
16,691,555.10 |
68,552,035.20 |
42,285,525.50 |
|
Accrued Expenses |
67,958,215.69 |
19,392,080.51 |
19,524,553.66 |
|
Current Portion of
Hire-purchase Contract Liabilities |
7,120,332.00 |
10,762,161.00 |
6,009,552.00 |
|
Other Current Liabilities |
4,210,747.24 |
550,632.90 |
374,801.61 |
|
|
|
|
|
|
Total Current Liabilities |
785,463,456.25 |
572,294,258.32 |
599,274,113.21 |
|
|
|
|
|
|
Hire-purchase Contract
Liabilities |
1,220,812.00 |
5,497,344.00 |
3,104,547.00 |
|
Total Liabilities |
786,684,268.25 |
577,791,602.32 |
602,378,660.21 |
|
|
|
|
|
|
Shareholders' Equity |
|
|
|
|
|
|
|
|
|
Share capital : Baht 1,000
par value authorized, issued
and fully paid share
capital 100,000 shares |
100,000,000.00 |
100,000,000.00 |
100,000,000.00 |
|
|
|
|
|
|
Capital Paid |
100,000,000.00 |
100,000,000.00 |
100,000,000.00 |
|
Retained Earnings
|
|
|
|
|
Appropriated for
Statutory Reserve |
10,000,000.00 |
10,000,000.00 |
- |
|
Unappropriated |
72,127,912.19 |
69,607,366.41 |
92,156,659.68 |
|
Total Shareholders' Equity |
182,127,912.19 |
179,607,366.41 |
192,156,659.68 |
|
Total Liabilities &
Shareholders' Equity |
968,812,180.44 |
757,398,968.73 |
794,535,319.89 |
PROFIT & LOSS ACCOUNT
|
Sale |
2011 |
2010 |
2009 |
|
|
|
|
|
|
Sales |
2,370,318,560.86 |
1,569,048,680.85 |
1,609,440,176.72 |
|
Other Income |
2,694,661.73 |
1,823,247.97 |
1,803,703.65 |
|
Total Sales |
2,373,013,222.59 |
1,570,871,928.82 |
1,611,243,880.37 |
|
Expenses |
|
|
|
|
|
|
|
|
|
Cost of Goods
Sold |
2,136,649,444.39 |
1,401,120,925.29 |
1,479,600,970.00 |
|
Selling Expenses |
62,586,305.49 |
64,470,333.42 |
44,050,594.52 |
|
Administrative Expenses |
105,205,624.66 |
73,722,704.86 |
55,745,837.29 |
|
Total Expenses |
2,304,441,374.54 |
1,539,313,963.57 |
1,579,397,401.81 |
|
|
|
|
|
|
Profit before Finance
Cost & Income Tax |
68,571,848.05 |
31,557,965.25 |
31,846,478.56 |
|
Finance Cost |
[6,608,231.48] |
[5,082,152.44] |
[8,242,235.53] |
|
Profit before Income Tax |
61,963,616.57 |
26,475,812.81 |
23,604,243.03 |
|
Income Tax |
[19,443,070.79] |
[9,025,106.08] |
[8,011,302.96] |
|
|
|
|
|
|
Net Profit / [Loss] |
42,520,545.78 |
17,450,706.73 |
15,592,940.07 |
fINANCIAL ANALYSIS
|
ITEM |
UNIT |
2011 |
2010 |
2009 |
|
|
|
|
|
|
|
LIQUIDITY RATIO |
|
|
|
|
|
CURRENT RATIO |
TIMES |
0.78 |
0.75 |
0.86 |
|
QUICK RATIO |
TIMES |
0.48 |
0.18 |
0.41 |
|
|
|
|
|
|
|
ACTIVITY RATIO |
|
|
|
|
|
FIXED ASSETS TURNOVER |
TIMES |
6.83 |
4.99 |
6.02 |
|
TOTAL ASSETS TURNOVER |
TIMES |
2.45 |
2.07 |
2.03 |
|
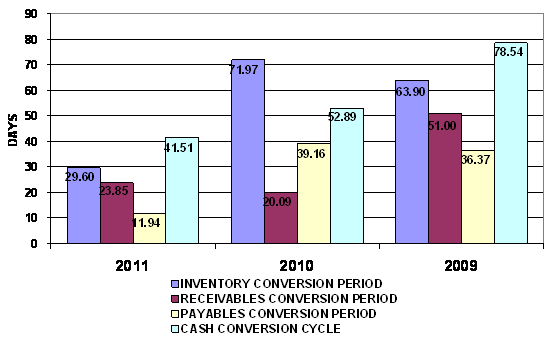
INVENTORY CONVERSION PERIOD |
DAYS |
29.60 |
71.97 |
63.90 |
|
INVENTORY TURNOVER |
TIMES |
12.33 |
5.07 |
5.71 |
|
RECEIVABLES CONVERSION PERIOD |
DAYS |
23.85 |
20.09 |
51.00 |
|
RECEIVABLES TURNOVER |
TIMES |
15.30 |
18.17 |
7.16 |
|
PAYABLES CONVERSION PERIOD |
DAYS |
11.94 |
39.16 |
36.37 |
|
CASH CONVERSION CYCLE |
DAYS |
41.51 |
52.89 |
78.54 |
|
|
|
|
|
|
|
PROFITABILITY
RATIO |
|
|
|
|
|
COST OF GOODS SOLD |
% |
90.14 |
89.30 |
91.93 |
|
SELLING & ADMINISTRATION |
% |
7.08 |
8.81 |
6.20 |
|
INTEREST |
% |
0.28 |
0.32 |
0.51 |
|
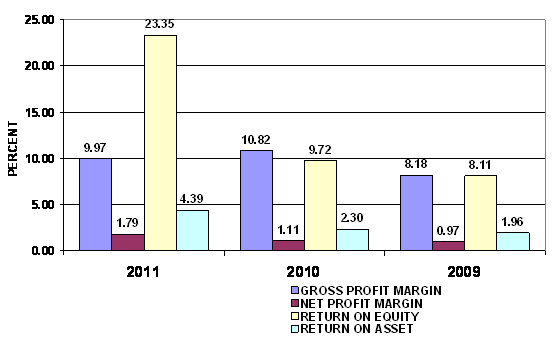
GROSS PROFIT MARGIN |
% |
9.97 |
10.82 |
8.18 |
|
NET PROFIT MARGIN BEFORE EX. ITEM |
% |
2.89 |
2.01 |
1.98 |
|
NET PROFIT MARGIN |
% |
1.79 |
1.11 |
0.97 |
|
RETURN ON EQUITY |
% |
23.35 |
9.72 |
8.11 |
|
RETURN ON ASSET |
% |
4.39 |
2.30 |
1.96 |
|
EARNING PER SHARE |
BAHT |
425.21 |
174.51 |
155.93 |
|
|
|
|
|
|
|
LEVERAGE RATIO |
|
|
|
|
|
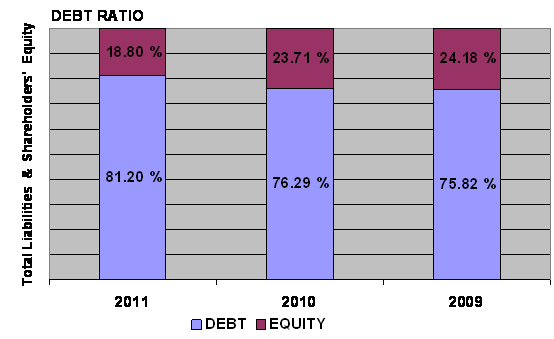
DEBT RATIO |
TIMES |
0.81 |
0.76 |
0.76 |
|
DEBT TO EQUITY RATIO |
TIMES |
4.32 |
3.22 |
3.13 |
|
TIME INTEREST EARNED |
TIMES |
10.38 |
6.21 |
3.86 |
|
|
|
|
|
|
|
ANNUAL GROWTH |
|
|
|
|
|
SALES GROWTH |
% |
51.07 |
(2.51) |
|
|
OPERATING PROFIT |
% |
117.29 |
(0.91) |
|
|
NET PROFIT |
% |
143.66 |
11.91 |
|
|
FIXED ASSETS |
% |
10.44 |
17.52 |
|
|
TOTAL ASSETS |
% |
27.91 |
(4.67) |
|
ANNUAL GROWTH :
EXCELLENT
An annual sales growth is 51.07%. Turnover has increased from THB
PROFITABILITY :
EXCELLENT
PROFITABILITY
RATIO
|
Gross Profit Margin |
9.97 |
Impressive |
Industrial
Average |
5.57 |
|
Net Profit Margin |
1.79 |
Impressive |
Industrial
Average |
0.87 |
|
Return on Assets |
4.39 |
Impressive |
Industrial
Average |
2.65 |
|
Return on Equity |
23.35 |
Impressive |
Industrial
Average |
8.13 |
Gross Profit Margin used to assess a firm's financial health by revealing
the proportion of money left over from sales after accounting for the cost of
goods sold. Gross profit margin serves as the source for paying additional
expenses and future savings. The company’s
figure is 9.97%. When compared with the industry average, the ratio of
the company was higher, indicated that company was more profitable than the
same industry.
Net Profit Margin is the indicator of the company's efficiency in that net
profit takes into consideration all expenses of the company. A low profit
margin indicates a low margin of safety, higher risk that a decline in sales
will erase profits and result in a net loss. The company’s figure is 1.79% compared with those of its
average competitors in the same industry, indicated that business was an
efficient operator in a dominant
position within its industry.
Return on Assets measures how efficiently profits are being generated
from the assets employed in the business when compared with the ratios of firms
in a similar business. A low ratio in comparison with industry averages
indicates an inefficient use of business assets. Return on Assets ratio is 4.39%, higher figure when compared
with those of its average competitors in the same industry, indicated that
business was an efficient profit in a
dominant position within its industry.
Return on Equity indicates how profitable a company is by comparing its
net income to its average shareholders' equity, ROE measures how much the
shareholders earned for their investment in the company. Return on Equity ratio
is 23.35%, higher figure when compared with those of its average competitors in
the same industry, indicated that business was an efficient profit in a dominant position within its industry.
Trend of the
average competitors in the same industry for last 5 years
Return on Assets Uptrend
Return on Equity Uptrend
LIQUIDITY : RISKY
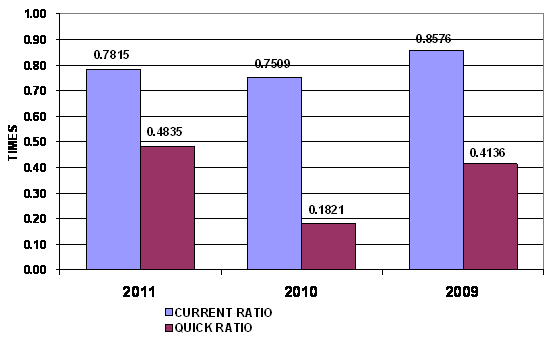
LIQUIDITY RATIO
|
Current Ratio |
0.78 |
Risky |
Industrial
Average |
1.59 |
|
Quick Ratio |
0.48 |
|
|
|
|
Cash Conversion Cycle |
41.51 |
|
|
|
The Current Ratio is to ascertain whether a company's short-term assets
are readily available to pay off its short-term liabilities. The company's figure
is 0.78 times in 2011, increased from 0.75 times, then the company may not be
efficiently using its current assets. When compared with the industry average,
the ratio of the company was lower.
The Quick Ratio is a liquidity indicator that further refines the
current ratio by measuring the amount of the most liquid current assets there
are to cover current liabilities. The company's figure is 0.48 times in 2011,
increased from 0.18 times, then the company has not enough current assets that
presumably can be quickly converted to cash for pay financial obligations.
The Cash Conversion Cycle measures the number of days a company's cash
is tied up in the production and sales process of its operations and the
benefit from payment terms from its creditors. It meant the company could
survive when no cash inflow was received from sale for 42 days.
Trend of the
average competitors in the same industry for last 5 years
Current Ratio Downtrend
LEVERAGE :
ACCEPTABLE
LEVERAGE RATIO
|
Debt Ratio |
0.81 |
Acceptable |
Industrial
Average |
0.64 |
|
Debt to Equity Ratio |
4.32 |
Risky |
Industrial
Average |
1.89 |
|
Times Interest Earned |
10.38 |
Impressive |
Industrial
Average |
1.60 |
Debt to Equity Ratio a measurement of how much suppliers, lenders,
creditors and obligors have committed to the company versus what the
shareholders have committed. A lower the percentage means that the company is
using less leverage and has a stronger equity position.
Times Interest Earned measuring a company's ability to meet its debt
obligations. Ratio is 10.38 higher than 1, so the company can pay interest
expenses on outstanding debt.
Debt Ratio shows the proportion of a company's assets which are financed
through debt. The company's figure is 0.81 greater than 0.5, most of the
company's assets are financed through debt.
Trend of the
average competitors in the same industry for last 5 years
Debt Ratio Uptrend
Times Interest Earned Uptrend
ACTIVITY :
IMPRESSIVE
ACTIVITY RATIO
|
Fixed Assets Turnover |
6.83 |
Satisfactory |
Industrial
Average |
8.75 |
|
Total Assets Turnover |
2.45 |
Satisfactory |
Industrial
Average |
3.07 |
|
Inventory Conversion Period |
29.60 |
|
|
|
|
Inventory Turnover |
12.33 |
Impressive |
Industrial
Average |
5.87 |
|
Receivables Conversion Period |
23.85 |
|
|
|
|
Receivables Turnover |
15.30 |
Impressive |
Industrial
Average |
4.52 |
|
Payables Conversion Period |
11.94 |
|
|
|
The company's Account Receivable Ratio is calculated as 15.30 and
Inventory Turnover in Days Ratio indicates the liquidity of inventory.
It estimates the number of days that it will take to sell the current
inventory. Inventory is particularly sensitive to change in business
activities. The inventory turnover in days has decreased from 72 days at the
end of 2010 to 30 days at the end of 2011. This represents a positive trend.
And Inventory turnover has increased from 5.07 times in year 2010 to 12.33 times
in year 2011.
The company's Total Asset Turnover is calculated as 2.45 times and 2.07
times in 2011 and 2010 respectively. This ratio is determined by dividing total
assets into total sales turnover. The ratio measures the activity of the assets
and the ability of the firm to generate sales through the use of the assets.
Trend of the
average competitors in the same industry for last 5 years
Fixed Assets Turnover Downtrend
Total Assets Turnover Downtrend
Inventory Turnover Downtrend
Receivables Turnover Downtrend
FOREIGN EXCHANGE RATES
|
Currency |
Unit
|
Indian Rupees |
|
US Dollar |
1 |
Rs.54.03 |
|
UK Pound |
1 |
Rs.82.43 |
|
Euro |
1 |
Rs.70.49 |
INFORMATION DETAILS
|
Report Prepared
by : |
MNL |
RATING EXPLANATIONS
|
RATING |
STATUS |
PROPOSED CREDIT LINE |
|
|
>86 |
Aaa |
Possesses an extremely sound financial base with the strongest
capability for timely payment of interest and principal sums |
Unlimited |
|
71-85 |
Aa |
Possesses adequate working capital. No caution needed for credit
transaction. It has above average (strong) capability for payment of interest
and principal sums |
Large |
|
56-70 |
A |
Financial & operational base are regarded healthy. General unfavourable
factors will not cause fatal effect. Satisfactory capability for payment of
interest and principal sums |
Fairly Large |
|
41-55 |
Ba |
Overall operation is considered normal. Capable to meet normal
commitments. |
Satisfactory |
|
26-40 |
B |
Capability to overcome financial difficulties seems comparatively
below average. |
Small |
|
11-25 |
Ca |
Adverse factors are apparent. Repayment of interest and principal sums
in default or expected to be in default upon maturity |
Limited with full
security |
|
<10 |
C |
Absolute credit risk exists. Caution needed to be exercised |
Credit not
recommended |
|
---- |
NB |
New Business |
---- |
This score serves as a reference to assess SC’s credit risk and
to set the amount of credit to be extended. It is calculated from a composite
of weighted scores obtained from each of the major sections of this report. The
assessed factors and their relative weights (as indicated through %) are as
follows:
Financial
condition (40%) Ownership
background (20%) Payment
record (10%)
Credit history
(10%) Market trend
(10%) Operational
size (10%)
This report is issued at your request without any
risk and responsibility on the part of MIRA INFORM PRIVATE LIMITED (MIPL)
or its officials.