MIRA
INFORM REPORT
|
Report Date : |
23.04.2013 |
IDENTIFICATION DETAILS
|
Name : |
Aditya Birla Chemicals [Thailand] Ltd. |
|
|
|
|
Formerly Known As : |
THAI
ORGANIC CHEMICALS CO.,
LTD. |
|
|
|
|
Registered Office : |
16th Floor, Mahathun Plaza Building, 888/160-161 Ploenchit Road, Lumpini, Pathumwan, Bangkok 10330 |
|
|
|
|
Country : |
Thailand |
|
|
|
|
Financials (as on) : |
31.12.2011 |
|
|
|
|
Date of Incorporation : |
26.12.1994 |
|
|
|
|
Com. Reg. No.: |
0105537150963 [Former:
3283/2537] |
|
|
|
|
Legal Form : |
Private Limited Company |
|
|
|
|
Line of Business : |
Manufacturer, Distributor and Exporter of Industrial Chemicals. |
|
|
|
|
No. of Employees : |
500 |
RATING & COMMENTS
|
MIRA’s Rating : |
Ba |
|
RATING |
STATUS |
PROPOSED CREDIT LINE |
|
|
41-55 |
Ba |
Overall operation is considered normal. Capable to meet normal
commitments. |
Satisfactory |
|
Status : |
Satisfactory |
|
|
|
|
Payment Behaviour : |
No Complaints |
|
|
|
|
Litigation : |
Clear |
NOTES :
Any query related to this report can be made
on e-mail: infodept@mirainform.com
while quoting report number, name and date.
ECGC Country Risk Classification List – June 30th, 2012
|
Country Name |
Previous Rating (31.03.2011) |
Current Rating (30.06.2012) |
|
Thailand |
B1 |
B1 |
|
Risk Category |
ECGC
Classification |
|
Insignificant |
A1 |
|
Low |
A2 |
|
Moderate |
B1 |
|
High |
B2 |
|
Very High |
C1 |
|
Restricted |
C2 |
|
Off-credit |
D |
THAILAND - ECONOMIC OVERVIEW
With a well-developed infrastructure, a free-enterprise economy, generally pro-investment policies, and strong export industries, Thailand achieved steady growth due largely to industrial and agriculture exports - mostly electronics, agricultural commodities, automobiles and parts, and processed foods. Thailand is trying to maintain growth by encouraging domestic consumption and public investment to offset weak exports in 2012. Unemployment, at less than 1% of the labor force, stands as one of the lowest levels in the world, which puts upward pressure on wages in some industries. Thailand also attracts nearly 2.5 million migrant workers from neighboring countries. The Thai government is implementing a nation-wide 300 baht ($10) per day minimum wage policy and deploying new tax reforms designed to lower rates on middle-income earners. The Thai economy has weathered internal and external economic shocks in recent years. The global economic severely cut Thailand's exports, with most sectors experiencing double-digit drops. In 2009, the economy contracted 2.3%. However, in 2010, Thailand's economy expanded 7.8%, its fastest pace since 1995, as exports rebounded. In late 2011 growth was interrupted by historic flooding in the industrial areas in Bangkok and its five surrounding provinces, crippling the manufacturing sector. Industry recovered from the second quarter of 2012 onward with GDP growth at 5.5% in 2012. The government has approved flood mitigation projects worth $11.7 billion, which were started in 2012, to prevent similar economic damage, and an additional $75 billion for infrastructure over the next seven years with a plan to start in 2013.
Source
: CIA
Company name
ADITYA BIRLA
CHEMICALS [THAILAND] LTD.
[FORMER :
THAI ORGANIC CHEMICALS
CO., LTD.]
SUMMARY
BUSINESS
ADDRESS : 16th FLOOR,
MAHATHUN PLAZA BUILDING,
888/160-161 PLOENCHIT
ROAD, LUMPINI,
PATHUMWAN, BANGKOK
10330
TELEPHONE : [66] 2253-6745-54
FAX :
[66] 2253-5030
E-MAIL
ADDRESS : epoxymktg@adityabirla.com
REGISTRATION
ADDRESS : SAME
AS BUSINESS ADDRESS
ESTABLISHED
: 1994
REGISTRATION
NO. : 0105537150963
[Former: 3283/2537]
TAX
ID NO. : 3011529300
CAPITAL REGISTERED : BHT. 1,700,000,000
CAPITAL PAID-UP : BHT.
1,700,000,000
SHAREHOLDER’S PROPORTION : THAI :
99.24%
FOREIGN :
0.76%
FISCAL YEAR CLOSING DATE : DECEMBER 31
LEGAL
STATUS : PRIVATE LIMITED
COMPANY
EXECUTIVE : MR.
LALITKUMAR SHANTARAM NAIK,
INDIAN
PRESIDENT
NO.
OF STAFF : 500
LINES
OF BUSINESS : INDUSTRIAL CHEMICALS
MANUFACTURER,
DISTRIBUTOR AND EXPORTER
CORPORATE PROFILE
OPERATING
TREND : STABLE
PRESENT
SITUATION : OPERATING NORMALLY
REPUTATION : GOOD
WITH NORMAL BUSINESS
ENGAGEMENT
MANAGEMENT
STANDARD : MANAGEMENT WITH
GOOD PERFORMANCE
HISTORY
The subject was
established on December 26,
1994 as a
private limited company under
the name style “Thai
Organic Chemicals Co.,
Ltd.” by a
joint investment between
Thai Rayon Public
Co., Ltd. and Thai Carbon Black
Public Co., Ltd., which
are members of Aditya Birla
Group, in order to
produce wide range
of industrial chemicals.
The plant is
situated in Eastern Industrial
Estate at Maptaphut,
Rayong Province.
At the beginning
of 2005, the
epoxy resin production
has been transferred
from Thai Epoxy
and Allied Products
Co., Ltd. to the
subject.
On December 30, 2005, subject’s
name was changed
to ADITYA BIRLA CHEMICALS
[THAILAND] LTD. It
currently employs approximately
500 staff.
The subject’s registered
address is 16th Flr., Mahathun
Plaza Bldg., 888/160-161 Ploenchit
Rd., Lumpini, Pathumwan,
Bangkok 10330, and
this is the
subject’s current operation
address.
THE BOARD OF
DIRECTORS
|
Name |
|
Nationality |
Age |
|
|
|
|
|
|
Mr. Pratheep Sajjatrakul |
|
Thai |
74 |
|
Mr. Kumar Mangalam
Birla |
: Chairman |
Indian |
45 |
|
Mrs. Rajcharee Birla |
|
Indian |
68 |
|
Mr. Khrisna Kischor Maheshwari |
|
Indian |
58 |
|
Mr. Hari Krishna
Agarwal |
|
Indian |
53 |
|
Mr. Lalitkumar Shantaram Naik |
|
Indian |
51 |
AUTHORIZED PERSON
Any of the
above directors can
sign on behalf
of the subject
with company’s affixed.
MANAGEMENT
Mr. Lalitkumar Shantaram Naik is the
President.
He is Indian nationality
with the age
of 51 years
old.
Mr. M. P. Pathak is
the Vice President
of Chlor-Alkali Division.
He is Indian
nationality.
Mr. P. K. Dubey is
the Vice President
of Epoxy Division.
He is Indian
nationality.
Mr. E. R. Raj Narayanan
is the Vice
President of Sulphite & Phosphates Division.
He is Indian
nationality.
Mr. Vinai Chaiburanond is
the Factory Manager.
He is Thai
nationality.
Mr. Pankaj Verma is
the Business Development
Manager.
He is Indian
nationality.
BUSINESS OPERATIONS
The subject’s activity
is a manufacturer
wide range of
industrial chemicals, such
as Caustic Soda 50%, Chlorine
99.9%, Epichlorohydrin 99.9%, Ally Chloride 99%, Hydrochloric
acid 35%, Sodium Hypochlorite 10-20%
and Epoxy Resin, Liquid Epoxy
Resin, Solid Epoxy
resin, Solvent Cut Epoxy
resin, Cycloliphatic Epoxy resin,
which are raw
materials of consumer
productions industries.
Ranges of products
are as follows:
Chlor Alkalis products
- Caustic soda
flakes
- Caustic soda
lye
- Chlorine
- Hydrogen
-
Hydrochloric acid,
- Sodium hypochlorite
Phosphate Products “Corino”,
“Gust” and “Pearl”
Food
grade phosphate
- Blended
phosphate
- Dipotassium phosphates
- Monosodium phosphate
- Sodium
acid pyrophosphate
- Sodium
hexametaphosphate
- Trisodium
phosphate
- Tetrasodium pyrophosphate
- Sodium
hexametaphosphate
Technical grade
phosphate
-
Chlorinated trisodium phosphate
-
Disodium phosphate
- Monosodium phosphate
- Sodium acid
pyrophosphate
- Sodium hexametaphosphate
- Sodium tripolyphosphate
- Tetrasodium pyrophosphate
- Trisodium phosphate
Sulphites Products
- Sodium
sulphite
- Sodium metabisulphite
- Sodium
bisulphite
Epoxy Resin Products
“Epotec”
- Cycloaliphatic epoxy
resin
- Epoxy
phenol novolac
- Epoxy
systems
- Liquid epoxy resin
- Reactive
diluents
- Solid
epoxy resin
- Solvent-cut epoxy
resin
- Waterborne
epoxy resins
- Curing
agents
PURCHASE
Most of raw
materials are purchased
from local suppliers,
and the remaining
is imported from United
States of America,
Japan, France, Singapore,
Switzerland, India, Republic
of China, Taiwan
and Germany.
MAJOR SUPPLIERS
Messo AG. : Switzerland
BASF Thai Ltd. : Thailand
IRPC Public Co.,
Ltd. : Thailand
SALES [LOCAL]
80% of the products
is sold locally to wholesalers
and manufacturers in
various industries such
as food, pharmaceutical, water
treatment, pulp &
paper, leather, textile
and etc.
EXPORT
20% of the
products is also
exported to over
60 countries worldwide
such as
United States of
America, Philippines, Taiwan, Republic of
China, India, Australia, Singapore, Korea,
Indonesia, Malaysia, Dubai,
Germany and Europe.
MAJOR CUSTOMERS
|
Name |
Country |
|
Unilever Thai Holding
Co., Ltd. |
Thailand |
|
Colgate - Palmolives [Thailand]
Ltd. |
Thailand |
|
Kao Industrial [Thailand]
Ltd. |
Thailand |
|
I C I Asiatic Chemical
Co., Ltd. |
Thailand |
|
Thai Rayon Public
Co., Ltd. |
Thailand |
RELATED COMPANIES
Birla Group
Aditya Birla Nuvo
Ltd.
Business Type :
Manufacturer and distributor
of industrial chemical
Bihar Caustic and
Chemicals Ltd.
Business Type :
Manufacturer and distributor
of industrial chemical
Grasim Industries Ltd.
Business Type :
Manufacturer of industrial
chemical
Tanfac Industries Ltd.
Business Type :
Manufacturer of industrial
chemical
Thai Peroxide Ltd.
Business Type :
Manufacturer of industrial
chemical
Thai Polyphosphate and
Chemicals Co., Ltd.
Business Type :
Manufacturer of industrial
chemical
LITIGATION
Bankruptcy and Receivership
There are no
litigation on bankruptcy
and receivership cases
filed against the
subject found at
Legal Execution Department
for the past
five years.
Others
The Company was sued for damages by one customer amounting to about 26 million baht.
Although the outcome of the case can not
be anticipated at this time, the Company's management believes that the outcome
of the case would not have a material impact on the financial statements of the
Company as a whole.
On September 29,
2009, The Central
Administrative Court has
ordered 8 government
sectors to stop
the 76 projects
temporarily, including company’s
three projects in
Map Ta Phut Industrial Estate
to suspend their operations, due to the pollution and
environmental problems. However, on
December 2, 2009
the Supreme Administrative Court
was ordered against
to stop only 56 projects,
including the company’s
two projects. The Government is
in the process to find a solution to
mitigate the impact of those projects. Affiliate company
believes that it
will be able to comply with new regulations and guidelines
to be issued
by the government.
CREDIT
Sales are by
cash or on the credits
term of 30-60
days.
Local bills are
paid on the
credits term of
30-60 days.
Imports are by
L/C at sight
or T/T.
Exports are against
T/T.
BANKING
The Siam Commercial
Bank Public Co.,
Ltd.
[Poochao Branch
: Poochaosamingprai Rd., Samrong, Phrapradaeng, Samutprakarn]
[Maptaphud Branch :
Pakornsongkrohraj Rd., Huaypong,
Muang, Rayong]
Bangkok Bank Public
Co., Ltd.
[Head Office :
333 Silom Rd.,
Silom, Bangrak, Bangkok
10500]
Kasikornbank Public Co., Ltd.
[Head Office :
1 Kasikorn Lane, Rajburana
Rd., Rajburana, Bangkok 10140]
EMPLOYMENT
The subject employs
approximately 500 staff.
[office staff and
factory workers]
LOCATION DETAILS
The premise is
rented for administrative office at
the heading address.
Premise is located
in an industrial
area.
Factories:
Chlor-Alkalis Factory
3 Soi G2,
Prakornsongkroh Rd., T.
Huaypong A. Muang,
Rayong 21150
Tel: [66] 38
687-356.
Epoxy Resin Factory
2 I-5 Rd., Mabtaphut
Industrial Estate, T. Mabtaphut,
A. Muang, Rayong 21150
Tel: [66] 38
685-233-4, Fax: [66] 38 683-982.
Phosphate Factory
77 Moo 6,
Poochaosamingprai Rd., T. Samrongtai, A. Phrapradaeng, Samutprakarn
Sulphites Factory
82 Moo 5,
Sudbantad Rd., T. Taldiew,
A. Kaengkoi, Saraburi
Bangkok Office
16th Floor, Mahathun
Plaza, 888/167 Ploenchit
Rd., Lumpini, Pathumwan,
Bangkok 10330
COMMENT
Aditya Birla
Chemicals is a leading
manufacture of industrial chemicals.
It is a leading manufacturer of bulk
and specialty chemicals and viscose filament yarn. The business is
spread across multiple
manufacturing locations in
three countries – India, Thailand
and China. The company is engaged in the production of five major
chemical groups, namely, chlor-alkali
products, epichlorohydrin, epoxy
resins, phosphates and sulphites. The
products have been
served in a large
number of industries such
as food, food processing, personal consumer
products, coating, civil
engineering, wind energy,
composites, electrical, pulp and
paper, detergents, water treatment, metal
treatment and more.
Since commencement subject
has excessively grown
in line with strong demand of the products
from both domestic and overseas
markets. The
company’s business has
built a strong global presence
with products that
are recognized the world over for their high quality.
FINANCIAL INFORMATION
The capital was
registered at Bht.
10,000 divided into
10 shares of
Bht. 1,000 each.
The capital were
increased and decreased
later as followings:
Increased were :
Bht. 370 million
on March 20,
1995
Bht.
650 million on
February 25, 1997
Bht. 2,240 million
on September 14,
2004
Decreased was : Bht.
1,040 million on
October 11, 2005
On October 26,
2005, the registered
capital was increased
to Bht. 1,700 million,
divided into 170,000,000
shares of Bht.
10 each with
fully paid.
MAIN SHAREHOLDERS
[As at
April 27, 2012]
|
NAME |
HOLDING |
% |
|
|
|
|
|
Thai Polyphosphate and
Chemicals Co., Ltd. Nationality: Thai Address : 77
Moo 6, Poochaosamingprai Rd.,
Samrong, Phrapradaeng, Samutprakarn |
64,140,251 |
37.73 |
|
Thai Carbon Black
Public Co., Ltd. Nationality: Thai Address : 888/160-161
Ploenchit Rd., Lumpini,
Pathumwan, Bangkok |
50,982,000 |
29.99 |
|
Thai Rayon Public
Co., Ltd. Nationality: Thai Address : 888/160-161
Ploenchit Rd., Lumpini,
Pathumwan, Bangkok 10330 |
50,960,605 |
29.98 |
|
Thai Industrial Management
Co., Ltd. Nationality: Thai Address : 77
Moo 6, Poochaosamingprai Rd.,
Samrong, Phrapradaeng, Samutprakarn |
2,618,000 |
1.54 |
|
Asseau Incorporate [Hong
Kong] Nationality: Chinese Address : Level
28, three Pacific
Place, 1 Queen’s
Road East, Hong Kong |
1,298,244 |
0.76 |
|
Others |
900 |
- |
Total Shareholders : 8
Share Structure [as
at April 27,
2012]
|
Nationality |
Shareholders |
No. of Share |
% Shares |
|
|
|
|
|
|
Thai |
5 |
168,701,556 |
99.24 |
|
Foreign |
3 |
1,298,444 |
0.76 |
|
Total |
8 |
170,000,000 |
100.00 |
NAME OF AUDITOR
& CERTIFIED PUBLIC
ACCOUNTANT NO. :
Mr. Narong Pantawong No. 3315
BALANCE SHEET [BAHT]
The
latest financial figures
published for December
31, 2011, 2010
& 2009 were:
ASSETS
|
Current Assets |
2011 |
2010 [Adjusted] |
2009 |
|
|
|
|
|
|
Cash in Hand
& at Bank |
464,341,165 |
86,548,313 |
233,014,505 |
|
Short-term Investment |
238,000,000 |
- |
- |
|
Trade Accounts &
Other Receivable |
1,971,875,426 |
1,936,859,130 |
1,468,518,387 |
|
Short-term Lending to Related Company |
26,000,000 |
- |
14,631,661 |
|
Inventories |
1,629,662,135 |
1,725,258,882 |
1,065,413,099 |
|
Other Current Assets
Prepayment for
Goods |
158,576,280 |
19,958,847 |
17,395,374 |
|
Refundable Input
Tax |
63,357,669 |
84,207,918 |
53,590,440 |
|
Deferred Compensation Export |
- |
- |
16,172,014 |
|
Deferred Compensation Damage |
- |
- |
31,341,548 |
|
Others |
61,148,379 |
56,510,338 |
16,820,465 |
|
|
|
|
|
|
Total Current Assets
|
4,612,961,054 |
3,909,343,428 |
2,916,897,493 |
|
Investment in Subsidiary |
159,128,044 |
137,131,844 |
137,131,844 |
|
Real Estate for
Investment |
41,935,350 |
41,935,350 |
4,017,556,764 |
|
Fixed Assets |
4,104,610,710 |
4,028,112,812 |
41,935,350 |
|
Intangible Assets |
7,879,538 |
9,048,086 |
9,866,295 |
|
Prepayment for Goods |
58,327,516 |
21,713,403 |
236,505 |
|
Other Assets |
8,095,011 |
26,016,686 |
31,872,999 |
|
Total Assets |
8,992,937,223 |
7,173,301,609 |
7,155,497,250 |
LIABILITIES &
SHAREHOLDERS' EQUITY [BAHT]
|
Current
Liabilities |
2011 |
2010 [Adjusted] |
2009 |
|
|
|
|
|
|
Bank Overdraft &
Short-term Loan from Financial Institution |
161,793,370 |
125,000,000 |
43,460,500 |
|
Trade Accounts &
Other Payable |
1,075,414,719 |
1,112,994,655 |
774,172,516 |
|
Current Portion of Long-term
Loan |
- |
50,000,000 |
100,000,000 |
|
Related-Company Payable |
- |
- |
71,782 |
|
Short-term Loan from Related Company |
217,000,000 |
96,000,000 |
- |
|
Accrued Expenses |
- |
- |
120,990,467 |
|
Accrued Income Tax |
129,068,800 |
21,404,065 |
- |
|
Other Current Liabilities |
36,731,712 |
37,965,499 |
23,070,617 |
|
|
|
|
|
|
Total Current Liabilities |
1,620,008,601 |
1,443,364,219 |
1,061,765,882 |
|
|
|
|
|
|
Long-term Loan, Net |
- |
- |
50,000,000 |
|
Reserve for Long-term
Employee Benefits |
100,453,211 |
31,734,637 |
34,809,959 |
|
Reserve for Assets
Demolishment |
31,673,213 |
30,750,691 |
- |
|
Total Liabilities |
1,752,135,025 |
1,505,849,547 |
1,146,575,841 |
|
|
|
|
|
|
Shareholders' Equity |
|
|
|
|
|
|
|
|
|
Share capital : Baht 10
par value authorized, issued
and fully paid share
capital 170,000,000 shares |
1,700,000,000 |
1,700,000,000 |
1,700,000,000 |
|
|
|
|
|
|
Capital Paid |
1,700,000,000 |
1,700,000,000 |
1,700,000,000 |
|
Retained Earning : Appropriated for
Statutory Reserve |
17,894,737 |
8,947,368 |
- |
|
Unappropriated |
5,522,907,461 |
4,958,504,694 |
4,308,921,409 |
|
Total Shareholders' Equity |
7,240,802,198 |
6,667,452,062 |
6,008,921,409 |
|
Total Liabilities &
Shareholders' Equity |
8,992,937,223 |
8,173,301,609 |
7,155,497,250 |
PROFIT & LOSS ACCOUNT
|
Revenue |
2011 |
2010 [Adjusted] |
2009 |
|
|
|
|
|
|
Sales |
12,457,637,098 |
10,526,524,712 |
8,257,919,072 |
|
Other Income |
|
|
|
|
Gain on Exchange Rate |
59,837,671 |
- |
13,264,856 |
|
Compensation Export |
- |
- |
34,174,747 |
|
Others |
67,926,105 |
60,505,225 |
62,064,433 |
|
Total Revenues |
12,585,400,874 |
10,587,029,937 |
8,367,423,108 |
|
Expenses |
|
|
|
|
|
|
|
|
|
Cost of Goods
Sold |
10,141,637,570 |
8,498,584,647 |
6,473,800,904 |
|
Selling Expenses |
1,004,217,954 |
828,249,808 |
624,320,133 |
|
Administrative Expenses |
314,591,846 |
295,823,310 |
283,833,650 |
|
Loss on Diminution
of Assets |
120,785,666 |
3,089,411 |
- |
|
Loss on Exchange Rate |
- |
7,652,175 |
- |
|
Total Expenses |
11,581,233,036 |
9,633,399,351 |
7,381,954,687 |
|
|
|
|
|
|
Profit Before Financial Cost & Income Tax |
1,004,167,838 |
953,630,586 |
985,468,421 |
|
Financial Cost |
[9,494,294] |
[10,981,471] |
[41,920,347] |
|
|
|
|
|
|
Profit Before Income Tax |
994,673,544 |
942,649,115 |
943,548,074 |
|
Income Tax |
[192,763,520] |
[97,005,537] |
- |
|
|
|
|
|
|
Net Profit / [Loss] |
801,910,024 |
845,643,578 |
943,548,074 |
FINANCIAL ANALYSIS
|
ITEM |
UNIT |
2011 |
2010 |
2009 |
|
|
|
|
|
|
|
LIQUIDITY RATIO |
|
|
|
|
|
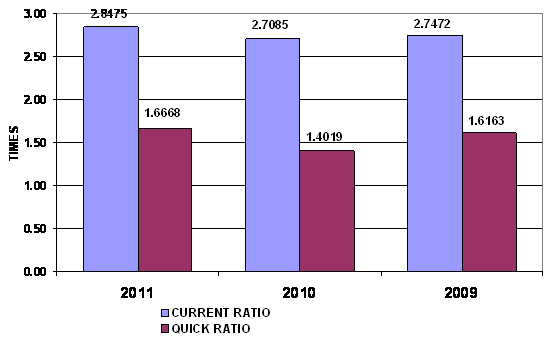
CURRENT RATIO |
TIMES |
2.85 |
2.71 |
2.75 |
|
QUICK RATIO |
TIMES |
1.67 |
1.40 |
1.62 |
|
|
|
|
|
|
|
ACTIVITY RATIO |
|
|
|
|
|
FIXED ASSETS TURNOVER |
TIMES |
3.04 |
2.61 |
196.92 |
|
TOTAL ASSETS TURNOVER |
TIMES |
1.39 |
1.47 |
1.15 |
|
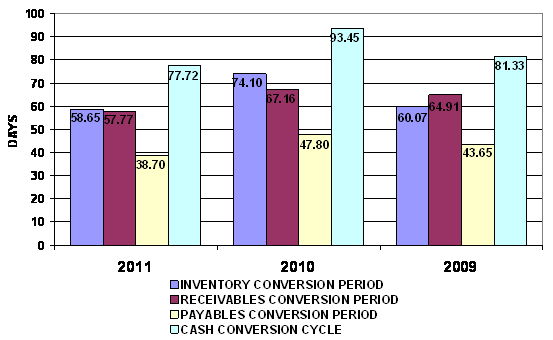
INVENTORY CONVERSION PERIOD |
DAYS |
58.65 |
74.10 |
60.07 |
|
INVENTORY TURNOVER |
TIMES |
6.22 |
4.93 |
6.08 |
|
RECEIVABLES CONVERSION PERIOD |
DAYS |
57.77 |
67.16 |
64.91 |
|
RECEIVABLES TURNOVER |
TIMES |
6.32 |
5.43 |
5.62 |
|
PAYABLES CONVERSION PERIOD |
DAYS |
38.70 |
47.80 |
43.65 |
|
CASH CONVERSION CYCLE |
DAYS |
77.72 |
93.45 |
81.33 |
|
|
|
|
|
|
|
PROFITABILITY
RATIO |
|
|
|
|
|
COST OF GOODS SOLD |
% |
81.41 |
80.73 |
78.40 |
|
SELLING & ADMINISTRATION |
% |
10.59 |
10.68 |
11.00 |
|
INTEREST |
% |
0.08 |
0.10 |
0.51 |
|
GROSS PROFIT MARGIN |
% |
19.62 |
19.84 |
22.93 |
|
NET PROFIT MARGIN BEFORE EX. ITEM |
% |
8.06 |
9.06 |
11.93 |
|
NET PROFIT MARGIN |
% |
6.44 |
8.03 |
11.43 |
|
RETURN ON EQUITY |
% |
11.07 |
12.68 |
15.70 |
|
RETURN ON ASSET |
% |
8.92 |
11.79 |
13.19 |
|
EARNING PER SHARE |
BAHT |
4.72 |
4.97 |
5.55 |
|
|
|
|
|
|
|
LEVERAGE RATIO |
|
|
|
|
|
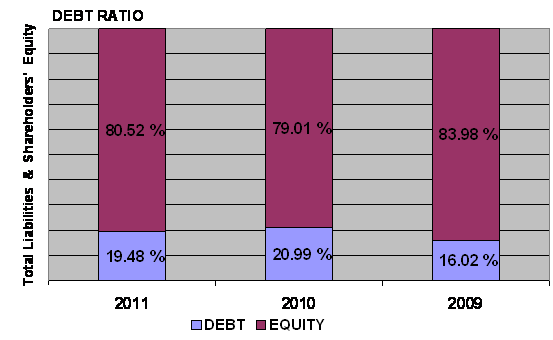
DEBT RATIO |
TIMES |
0.19 |
0.21 |
0.16 |
|
DEBT TO EQUITY RATIO |
TIMES |
0.24 |
0.23 |
0.19 |
|
TIME INTEREST EARNED |
TIMES |
105.77 |
86.84 |
23.51 |
|
|
|
|
|
|
|
ANNUAL GROWTH |
|
|
|
|
|
SALES GROWTH |
% |
18.35 |
27.47 |
|
|
OPERATING PROFIT |
% |
5.30 |
(3.23) |
|
|
NET PROFIT |
% |
(5.17) |
(10.38) |
|
|
FIXED ASSETS |
% |
1.90 |
9,505.53 |
|
|
TOTAL ASSETS |
% |
25.37 |
0.25 |
|
ANNUAL GROWTH :
IMPRESSIVE
An annual sales growth is 18.35%. Turnover has increased from THB
10,526,524,712.00 in 2010 to THB 12,457,637,098.00 in 2011. While net profit
has decreased from THB 845,643,578.00 in 2010 to THB 801,910,024.00 in 2011.
And total assets has increased from THB 7,173,301,609.00 in 2010 to THB
8,992,937,223.00 in 2011.
PROFITABILITY :
EXCELLENT

PROFITABILITY
RATIO
|
Gross Profit Margin |
19.62 |
Impressive |
Industrial
Average |
13.98 |
|
Net Profit Margin |
6.44 |
Impressive |
Industrial
Average |
4.31 |
|
Return on Assets |
8.92 |
Impressive |
Industrial
Average |
4.00 |
|
Return on Equity |
11.07 |
Impressive |
Industrial
Average |
7.52 |
Gross Profit Margin used to assess a firm's financial health by revealing
the proportion of money left over from revenues after accounting for the cost
of goods sold. Gross profit margin serves as the source for paying additional
expenses and future savings. The
company’s figure is 19.62%. When compared with the industry average, the
ratio of the company was higher, indicated that company was more profitable
than the same industry.
Net Profit Margin is the indicator of the company's efficiency in that
net profit takes into consideration all expenses of the company. A low profit
margin indicates a low margin of safety, higher risk that a decline in sales
will erase profits and result in a net loss. The company’s figure is 6.44%, higher
figure when compared with those of its average competitors in the same
industry, indicated that business was an efficient operator in a dominant position within its industry.
Return on Assets measures how efficiently profits are being generated
from the assets employed in the business when compared with the ratios of firms
in a similar business. A low ratio in comparison with industry averages
indicates an inefficient use of business assets. Return on Assets ratio is 8.92%, higher figure when compared
with those of its average competitors in the same industry, indicated that
business was an efficient profit in a
dominant position within its industry.
Return on Equity indicates how profitable a company is by comparing its
net income to its average shareholders' equity, ROE measures how much the
shareholders earned for their investment in the company. Return on Equity ratio
is 11.07%, higher figure when compared with those of its average competitors in
the same industry, indicated that business was an efficient profit in a dominant position within its industry.
Trend of the
average competitors in the same industry for last 5 years
Return on Assets Downtrend
Return on Equity Downtrend
LIQUIDITY :
SATISFACTORY
LIQUIDITY RATIO
|
Current Ratio |
2.85 |
Impressive |
Industrial
Average |
1.63 |
|
Quick Ratio |
1.67 |
|
|
|
|
Cash Conversion Cycle |
77.72 |
|
|
|
The Current Ratio is to ascertain whether a company's short-term assets
are readily available to pay off its short-term liabilities. The company's figure
is 2.85 times in 2011, increased from 2.71 times, then it is generally
considered to have good short-term financial strength. When compared with the
industry average, the ratio of the company was higher, indicated that company
was an efficient operator in a dominant position within its industry.
The Quick Ratio is a liquidity indicator that further refines the
current ratio by measuring the amount of the most liquid current assets there
are to cover current liabilities. The company's figure is 1.67 times in 2011,
increased from 1.4 times, although excluding inventory so the company still
have good short-term financial strength.
The Cash Conversion Cycle measures the number of days a company's cash
is tied up in the production and sales process of its operations and the
benefit from payment terms from its creditors. It meant the company could
survive when no cash inflow was received from sale for 78 days.
Trend of the
average competitors in the same industry for last 5 years
Current Ratio Uptrend
LEVERAGE :
EXCELLENT
LEVERAGE RATIO
|
Debt Ratio |
0.19 |
Impressive |
Industrial
Average |
0.41 |
|
Debt to Equity Ratio |
0.24 |
Impressive |
Industrial
Average |
0.75 |
|
Times Interest Earned |
105.77 |
Impressive |
Industrial
Average |
6.16 |
Debt to Equity Ratio a measurement of how much suppliers, lenders,
creditors and obligors have committed to the company versus what the
shareholders have committed. A lower the percentage means that the company is
using less leverage and has a stronger equity position.
Times Interest Earned measuring a company's ability to meet its debt
obligations. Ratio is 105.77 higher than 1, so the company can pay interest
expenses on outstanding debt.
Debt Ratio shows the proportion of a company's assets which are financed
through debt. The company's figure is 0.19 less than 0.5, most of the company's
assets are financed through equity.
Trend of the
average competitors in the same industry for last 5 years
Debt Ratio Downtrend
Times Interest Earned Uptrend
ACTIVITY :
EXCELLENT
ACTIVITY RATIO
|
Fixed Assets Turnover |
3.04 |
Impressive |
Industrial
Average |
1.65 |
|
Total Assets Turnover |
1.39 |
Impressive |
Industrial
Average |
0.94 |
|
Inventory Conversion Period |
58.65 |
|
|
|
|
Inventory Turnover |
6.22 |
Impressive |
Industrial
Average |
5.52 |
|
Receivables Conversion Period |
57.77 |
|
|
|
|
Receivables Turnover |
6.32 |
Impressive |
Industrial
Average |
4.67 |
|
Payables Conversion Period |
38.70 |
|
|
|
The company's Account Receivable Ratio is calculated as 6.32 and 5.43 in
2011 and 2010 respectively. This ratio measures the efficiency of the company in
managing its trade debtors to generate revenue. A lower ratio may indicate over
extension and collection problems. Conversely, a higher ratio may indicate an
overtly stringent policy. In this case, the company's A/R ratio in 2011
increased from 2010. This would suggest the company had good performance in the
management of its debt collections.
Inventory Turnover in Days Ratio indicates the liquidity of inventory.
It estimates the number of days that it will take to sell the current
inventory. Inventory is particularly sensitive to change in business
activities. The inventory turnover in days has decreased from 74 days at the
end of 2010 to 59 days at the end of 2011. This represents a positive trend.
And Inventory turnover has increased from 4.93 times in year 2010 to 6.22 times
in year 2011.
The company's Total Asset Turnover is calculated as 1.39 times and 1.47
times in 2011 and 2010 respectively. This ratio is determined by dividing total
assets into total sales turnover. The ratio measures the activity of the assets
and the ability of the firm to generate sales through the use of the assets.
Trend of the
average competitors in the same industry for last 5 years
Fixed Assets Turnover Downtrend
Total Assets Turnover Downtrend
Inventory Turnover Downtrend
Receivables Turnover Downtrend
FOREIGN EXCHANGE RATES
|
Currency |
Unit
|
Indian Rupees |
|
US Dollar |
1 |
Rs.54.17 |
|
|
1 |
Rs.82.45 |
|
Euro |
1 |
Rs.70.70 |
INFORMATION DETAILS
|
Report
Prepared by : |
NIT |
RATING EXPLANATIONS
|
RATING |
STATUS |
PROPOSED CREDIT LINE |
|
|
>86 |
Aaa |
Possesses an extremely sound financial base with the strongest
capability for timely payment of interest and principal sums |
Unlimited |
|
71-85 |
Aa |
Possesses adequate working capital. No caution needed for credit
transaction. It has above average (strong) capability for payment of interest
and principal sums |
Large |
|
56-70 |
A |
Financial & operational base are regarded healthy. General unfavourable
factors will not cause fatal effect. Satisfactory capability for payment of
interest and principal sums |
Fairly Large |
|
41-55 |
Ba |
Overall operation is considered normal. Capable to meet normal
commitments. |
Satisfactory |
|
26-40 |
B |
Capability to overcome financial difficulties seems comparatively
below average. |
Small |
|
11-25 |
Ca |
Adverse factors are apparent. Repayment of interest and principal sums
in default or expected to be in default upon maturity |
Limited with full
security |
|
<10 |
C |
Absolute credit risk exists. Caution needed to be exercised |
Credit not
recommended |
|
-- |
NB |
New Business |
-- |
This score serves as a reference to assess SC’s credit risk and
to set the amount of credit to be extended. It is calculated from a composite
of weighted scores obtained from each of the major sections of this report. The
assessed factors and their relative weights (as indicated through %) are as
follows:
Financial
condition (40%) Ownership
background (20%) Payment
record (10%)
Credit history
(10%) Market trend
(10%) Operational
size (10%)
This report is issued at your request without any
risk and responsibility on the part of MIRA INFORM PRIVATE LIMITED (MIPL)
or its officials.