MIRA INFORM REPORT
|
Report Date : |
29.04.2013 |
IDENTIFICATION DETAILS
|
Name : |
HASLE INDUSTRIES AS |
|
|
|
|
Registered Office : |
Kanegardsvej 1, 3700 Ronne |
|
|
|
|
Country : |
Denmark |
|
|
|
|
Financials (as on) : |
31.12.2011 |
|
|
|
|
Date of Incorporation : |
01.04.1992 |
|
|
|
|
Legal Form : |
Limited Company |
|
|
|
|
Line of Business : |
Manufacturer of refractory products |
|
|
|
|
No. of Employees : |
Not available |
RATING & COMMENTS
|
MIRA’s Rating : |
Ba |
|
RATING |
STATUS |
PROPOSED CREDIT LINE |
|
|
41-55 |
Ba |
Overall operation is considered normal. Capable to meet normal
commitments. |
Satisfactory |
|
Status : |
Satisfactory |
|
|
|
|
Payment Behaviour : |
No Complaints |
|
|
|
|
Litigation : |
Clear |
NOTES:
Any query related to this report can be made
on e-mail: infodept@mirainform.com
while quoting report number, name and date.
ECGC Country Risk Classification List – March 31st 2013
|
Country Name |
Previous Rating (31.12.2012) |
Current Rating (31.03.2013) |
|
Denmark |
A2 |
A2 |
|
Risk Category |
ECGC
Classification |
|
Insignificant |
A1 |
|
Low |
A2 |
|
Moderate |
B1 |
|
High |
B2 |
|
Very High |
C1 |
|
Restricted |
C2 |
|
Off-credit |
D |
denmark ECONOMIC OVERVIEW
This thoroughly modern market economy features a high-tech agricultural
sector, state-of-the-art industry with world-leading firms in pharmaceuticals,
maritime shipping and renewable energy, and a high dependence on foreign trade.
Denmark is a member of the European Union (EU); Danish legislation and
regulations conform to EU standards on almost all issues. Danes enjoy a high
standard of living and the Danish economy is characterized by extensive
government welfare measures and an equitable distribution of income. Denmark is
a net exporter of food and energy and enjoys a comfortable balance of payments
surplus but depends on imports of raw materials for the manufacturing sector.
Within the EU, Denmark is among the strongest supporters of trade
liberalization. After a long consumption-driven upswing, Denmark's economy
began slowing in 2007 with the end of a housing boom. Housing prices dropped
markedly in 2008-09 and, following a short respite in 2010, has since continued
to decline. The global financial crisis has exacerbated this cyclical slowdown
through increased borrowing costs and lower export demand, consumer confidence,
and investment. The global financial crisis cut Danish real GDP in 2008-09.
Denmark made a modest recovery in 2010 with real GDP growth of 1.3%, in part
because of increased government spending; however, the country experienced a
technical recession in late 2010-early 2011. Historically low levels of
unemployment rose sharply with the recession and have remained at about 6% in
2010-12, based on the national measure, about two-thirds average EU
unemployment. An impending decline in the ratio of workers to retirees will be
a major long-term issue. Denmark maintained a healthy budget surplus for many
years up to 2008, but the budget balance swung into deficit in 2009. In spite
of the deficits, the new coalition government delivered a modest stimulus to
the economy in 2012. Nonetheless, Denmark's fiscal position remains among the
strongest in the EU with public debt at about 45% of GDP in 2012. Despite
previously meeting the criteria to join the European Economic and Monetary
Union (EMU), so far Denmark has decided not to join, although the Danish krone
remains pegged to the euro. Denmark held the EU presidency during the first
half of 2012; priorities included promoting a responsible, dynamic, green, and
safe Europe, while working to steer Europe out of its euro zone economic
crisis.
|
Source : CIA |
Company name
HASLE INDUSTRIES A/S
Operative address
KANEGARDSVEJ 1
3700 RONNE
Denmark
Legal form Limited company -
A/S
Registration number Trade register
number: 20223707
Trade register
number: 20223707
VAT-number DK20 22 37 07
Contact information
Company name HASLE INDUSTRIES
A/S
Operative address KANEGARDSVEJ 1
3700 RONNE
Denmark
Correspondence address KANEGARDSVEJ 1
3700 RONNE
Denmark
Telephone number +45 56951800
Fax number +45 56953181
Email address hasle@hasle-refractories.dk
Web: www.hasle-refractories.com
Registration
Registration number Trade register
number: 20223707
Trade register
number: 20223707
VAT-number DK20 22 37 07
Status Active
Establishment date 1992-04-01
Legal form Limited company -
A/S
Subscribed share capital DKK 4.000.000
Activities
NACE Manufacture of
refractory products (2320)
Relations
Shareholders ULTIMATE GLOBAL
SHAREHOLDER
Name: DKB NR. 246 APS
National id number: 27021468
Address: Kanegårdsvej 1
Zipcode: 3700
City: RØNNE
Country: DK
Type: Industrial company
Share direct: 100.00%
Share TOTAL: 100.00%
TOTAL assets : 1.71 mil. EUR
Profit loss before tax: 0.1807 mil. EUR
Profit loss after tax net income: 0.1852
mil. EUR
Shareholders funds: 1.1924 mil. EUR
SHAREHOLDERS
Name: DKB NR. 246 APS
National id number: 27021468
Address: Kanegårdsvej 1
Zipcode: 3700
City: RØNNE
Country: DK
Type: Industrial company
Share direct: 100.00%
TOTAL assets : 1.71 mil. EUR
Profit loss before tax: 0.1807 mil. EUR
Profit loss after tax net income: 0.1852
mil. EUR
Shareholders funds: 1.1924 mil. EUR
Number of employees: 0
Structure SUBSIDIARIES
Name: HASLE REFRACTORIES (THAILAND) CO. LTD.
National id number: 20223707-DFA
Address: Langebjerg 23
Zipcode: 4000
City: ROSKILDE
Country: TH
Type: Industrial company
Share direct: 100.00%
National id number: 20223707-DFB
Address: Langebjerg 23
Zipcode: 4000
City: ROSKILDE
National id number: 20223707-1157
Address: Almindingsvej 76
Zipcode: 3700
City: RØNNE
National id number: 20223707-1158
Address: Almindingsvej 76
Zipcode: 3700
City: RØNNE
Branches Name: HASLE
INDUSTRI AF 1997 A/S
Country: DK
Name: HASLE INDUSTRI AF 1997 A/S (EKSPORT)
Country: DK
Name: HASLE INDUSTRI AF 1997 A/S HASLE
REFRACTORIES A/S - EXPORT
Country: DK
Name: HASLE INDUSTRI AF 1997 A/S HASLE
TEKNIK A/S
Country: DK
Bank details
Accounts Danske Ban
Management
Full name Mr. Jeppe Vangs Gaard
Address: Denmark
Number of involvements: 3
Function: Member of the board
Level of responsibility: Member
Appointment date: 2004/03/25
Fullname: Mr. Henrik Brok
Type: Individual
Gender: Male
Address: Denmark
Number of involvements: 1
Function: Member of the board
Level of responsibility: Member
Appointment date: 2012/04/22
Fullname: Mr. Soren Vinther
Type: Individual
Gender: Male
Address: Denmark
Number of involvements: 3
Function: Member of the board
Level of responsibility: Member
Appointment date: 2010/03/25
Fullname: Mr. Michael Jorgen Bladt
Type: Individual
Gender: Male
Country of nationality: Denmark
Address: Denmark
Number of involvements: 3
Function: Managing Director
Level of responsibility: Highest executive
Appointment date: 2003/06/11
Financials analysis
Trend Changeable
Profitability Positive
Solvability Limited
Liquidity Limited
Show amount in Euro
Key figures
|
Year |
2011 |
2010 |
2009 |
2008 |
2007 |
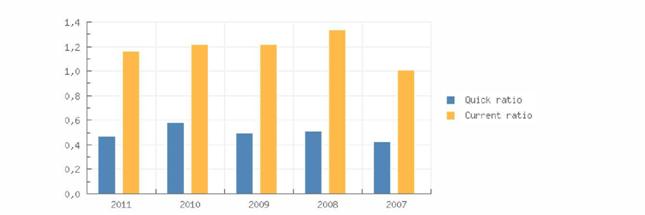
|
Quick ratio |
0,47 |
0,58 |
0,50 |
0,51 |
0,43 |
|
Current ratio |
1,16 |
1,22 |
1,22 |
1,34 |
1,01 |
|
|
|||||
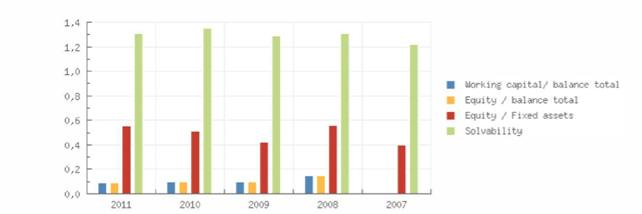
|
Working capital/ balance total |
0,09 |
0,10 |
0,10 |
0,15 |
0,01 |
|
Equity / balance total |
0,09 |
0,10 |
0,10 |
0,15 |
0,01 |
|
Equity / Fixed assets |
0,55 |
0,51 |
0,42 |
0,56 |
0,40 |
|
Solvability |
1,31 |
1,35 |
1,29 |
1,31 |
1,22 |
|
|
|||||
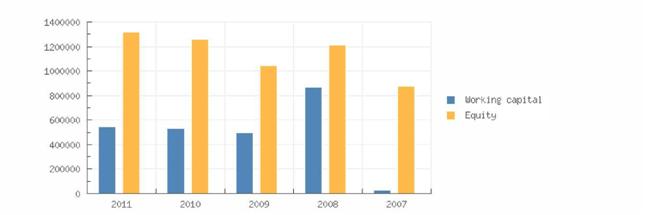
|
Working capital |
542.759 |
534.914 |
494.459 |
865.942 |
29.
178 |
|
Equity |
1.315.402 |
1.256.528 |
1.043.352 |
1.211.694 |
875.612 |
|
Mutation equity |
4,69 |
20,
43 |
-13,89 |
38,38 |
|
|
Mutation short term liabilities |
36,
50 |
11,
68 |
-13,89 |
-4,26 |
|
|
|
|||||
|
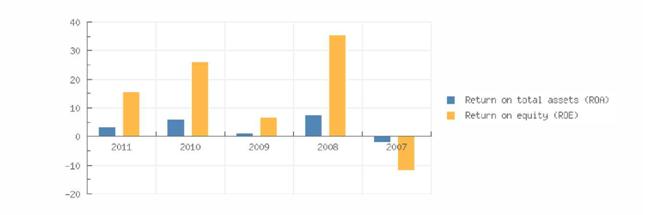
Return on total assets (ROA) |
3,27 |
6,02 |
1,33 |
7,68 |
-2,13 |
|
Return on equity (ROE) |
15,
67 |
26,
25 |
6,64 |
35,51 |
-11,94 |
Gross
margin 2.258.606 2.254.128 2.090.851 2.805.170
2. 202.682
Operating result 342.470 454.957 241.144 565.194 23.
824
Net res ult after taxes 152.403 248.267 50. 823 321.550 -77.362
Cashflow 493.662 537.579 312.297 549.831 142.143
EBITDA 683.729 744.269 502.617 793.475 243.330
Summary The 2011 financial result structure is a positive working capital of 542.759 euro,
which is in agreement with 9 % of the total assets of the company.
The working capital has increase with 1.47 % compared to previous year. The ratio with respect to the total assets of the company has however, declined.
The improvement between 2010 and 2011 has mainly been caused by a current
liabilities reduction.
The current ratio of the company in 2011 was 1.16. W hen the current ratio is below 1.5, the company may have problems meeting its short-term obligations.
The quick ratio in 2011 of the company was 0.47. A company with a Quick Ratio of less than 1 cannot current ly pay back its current liabilities.
The 2010 financial result structure is a postive working captial of 534.914 euro, which is in agreement with 10 % of the total assets of the company.
The working capital has increased with 8.18 % compared to previous year. The ratio with respect to the total assets of the company remains unchanged.
The improvement between 2009 and 2010 has mainly been caused by a current
liabilities reduction.
The current ratio of the company in 2010 was 1.22. W hen the current ratio is below
1.5, the company may have problems meeting its short-term obligations.
The quick ratio in 2010 of the company was 0.58. A company with a Quick Ratio of less than 1 cannot current ly pay back its current liabilities.
Financial statement
Auditor Name: Beierholm, Statsautoriseret Revisionspartnerselskab
Last annual account 2011
Remark annual account The company is
obligated to publish
Its annual
accounts
Type of annual account Corporate
Annual account HASLE
INDUSTRIES A/S
KANEGARDSVEJ 1
3700 RONNE
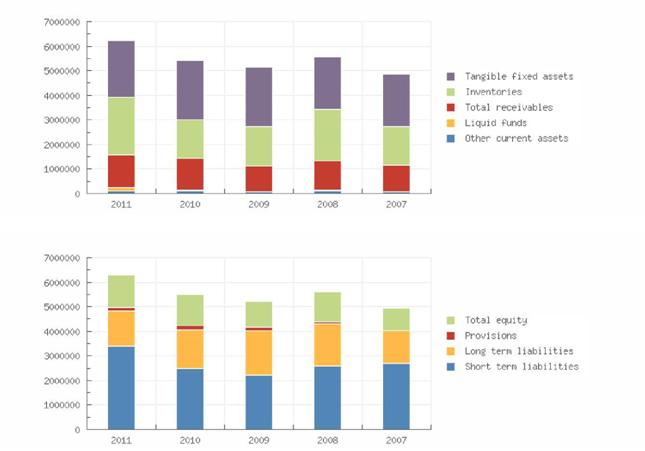
Balance sheet
|
Year |
2011 |
2010 |
2009 |
2008 |
2007 |
|
End date |
2011-12-31 |
2010-12-31 |
2009-12-31 |
2008-12-31 |
2007-12-31 |
|
Tangible
fixed assets |
2.308.914 |
2.399.117 |
2.438.858 |
2.110.404 |
2.153.160 |
|
Other fixed
assets |
63. 087 |
64. 232 |
44. 270 |
43. 508 |
40. 956 |
|
Fixed
assets |
2.372.000 |
2.463.349 |
2.483.128 |
2.153.911 |
2.194.116 |
|
|
|||||
|
Inventories |
2.350. 882 |
1.568.894 |
1.611.907 |
2.131.750 |
1.565.983 |
|
Total
receivables |
1.340.152 |
1.294.641 |
1.037.601 |
1.175.936 |
1.099.802 |
|
Liquid funds |
127.518 |
58.635 |
5.885 |
29. 096 |
3.212 |
|
Other current
assets |
111.242 |
94. 083 |
60. 854 |
109.314 |
55.010 |
|
Current
assets |
3.929.794 |
3.016.254 |
2.716.247 |
3.446.095 |
2.724.007 |
|
Total
assets |
6.301.794 |
5.479.603 |
5.199.375 |
5.600.006 |
4.918.124 |
|
|
|||||
|
Total
equity |
1.315.402 |
1.256.528 |
1.043.352 |
1.211.694 |
875.612 |
|
Provis ions |
165.451 |
153.918 |
114.353 |
97. 485 |
|
|
Long
term liabilities |
1.433.773 |
1.587.818 |
1.819.748 |
1.710.675 |
1.347.548 |
|
Accounts payable |
1.206.715 |
840.750 |
318.048 |
742.897 |
908.136 |
|
Short
term liabilities |
3.387.035 |
2.481.340 |
2.221.788 |
2.580.153 |
2.694.829 |
|
Total
liabilities |
6.301.794 |
5.479.603 |
5.199.375 |
5.600.006 |
4.918.124 |
Summary The total assets
of the company increased with 15 % between 2010 and
2011.
Despite the assets growth, the non current
assets decreased with -3.71 %.
In 2011 the assets of the company were 37.64
% composed of fixed assets and 62.36 % by current assets. The assets are being
financed by an equity of 20.87 %, and total debt of 79.13 %.
The total assets of the company increased
with 5.39 % between 2009 and 2010.
The total assets are entirely composed of
current assets.
In 2010 the assets of the company were 44.95
% composed of fixed assets and 55.05 % by current assets. The assets are being
financed by an equity of 22.93 %, and total debt of 77.07 %.
Profit & Loss A/C
|
Year |
2011 |
2010 |
2009 |
2008 |
2007 |
|
Gross margin |
2.258.606 |
2.254.128 |
2.090.851 |
2.805.170 |
2.202.682 |
|
|
|||||
|
Wages and
salaries |
1.574. 877 |
1.509.992 |
1.588.234 |
2.011.695 |
1.959.219 |
|
Amorization and
depreciation |
341.259 |
289.312 |
261.473 |
228.280 |
219.505 |
|
Operating
expenses |
1.916. 136 |
1.799.171 |
1.849.707 |
2.239. 975 |
2.178. 858 |
|
Operating
result |
342.470 |
454.957 |
241.144 |
565.194 |
23.824 |
|
|
|||||
|
Financial income |
15.469 |
18.657 |
535 |
29. 096 |
40. 689 |
|
Financial
expenses |
151.865 |
143.790 |
172.399 |
163.970 |
169.046 |
|
Financial result |
-136. 396 |
-125. 133 |
-171. 864 |
-134. 874 |
-128. 357 |
|
Result
on ordinary operations before taxes |
206.074 |
329.824 |
69.280 |
430.320 |
-104.533 |
|
|
|||||
|
Taxation on the
result of ordinary activities |
53.671 |
81.556 |
18.457 |
108.770 |
-27.170 |
|
Result
of ordinary activities after taxes |
152.403 |
248.267 |
50.823 |
321.550 |
-77.362 |
|
|
|||||
|
Net
result |
152.403 |
248.267 |
50.823 |
321.550 |
-77.362 |
summary
The gross profit of the company has remained the same between 2010 and
2011.
The operating result of the company declined with -24.72 % between 2010
and 2011.
This evolution implies an decrease of the company's economic
profitability.
The result of these changes is a reduction of the company's Economic
Profitability of -
45.68 % of the analysed period, being equal to 2010 % in the year 2011.
The Net Result of the company increased by -38.61 % between 2010 and
2011. The
company's Financial Profitability has been positively affected by the
financial activities
in comparison to the EBITs behaviour. The result of thes e variations is
a profitability
increase of -40.3 % of the analysed period, being 15.67 % in the year
2011.
The company's financial profitability has been positively affected by
its financial
structure.
The gross profit of the company grew with 7.81 % between 2009 and 2010.
The operating result of the company grew with 88.67 % between 2009 and
2010. This
evolution implies an increase of the company's economic profitability .
The result of these changes is an increase of the company's Economic
Profitability of
352.63 % of the analysed period, being equal to 2009 % in the year 2010.
The Net Result of the company decreased by 388.49 % between 2009 and
2010.
The company's Financial Profitability has been negatively affected by
the financial
activities in comparison to the EBITs behaviour. The result of thes e
variations is a
profitability reduction of 295.33 % of the analysed period, being 26.25
% in the year
2010.
The company's financial structure has slowed
down its financial profitability
Publications
Remarks Status: Active
Category: Medium sized company
Last year: 2011
Result last year: 152.403 EUR
TOTAL assets last year: 6.301.795 EUR
Number of employees: 30
Number of shareholders: 1
Number of subsidiaries: 1
Number of
branches: 4
FOREIGN EXCHANGE RATES
|
Currency |
Unit
|
Indian Rupees |
|
US Dollar |
1 |
Rs.54.29 |
|
UK Pound |
1 |
Rs.83.88 |
|
Euro |
1 |
Rs.70.68 |
INFORMATION DETAILS
|
Report Prepared
by : |
MNL |
RATING EXPLANATIONS
|
RATING |
STATUS |
PROPOSED CREDIT LINE |
|
|
>86 |
Aaa |
Possesses an extremely sound financial base with the strongest
capability for timely payment of interest and principal sums |
Unlimited |
|
71-85 |
Aa |
Possesses adequate working capital. No caution needed for credit
transaction. It has above average (strong) capability for payment of interest
and principal sums |
Large |
|
56-70 |
A |
Financial & operational base are regarded healthy. General
unfavourable factors will not cause fatal effect. Satisfactory capability for
payment of interest and principal sums |
Fairly Large |
|
41-55 |
Ba |
Overall operation is considered normal. Capable to meet normal
commitments. |
Satisfactory |
|
26-40 |
B |
Capability to overcome financial difficulties seems comparatively below
average. |
Small |
|
11-25 |
Ca |
Adverse factors are apparent. Repayment of interest and principal sums
in default or expected to be in default upon maturity |
Limited with
full security |
|
<10 |
C |
Absolute credit risk exists. Caution needed to be exercised |
Credit not
recommended |
|
---- |
NB |
New Business |
---- |
This score serves as a reference to assess
SC’s credit risk and to set the amount of credit to be extended. It is
calculated from a composite of weighted scores obtained from each of the major
sections of this report. The assessed factors and their relative weights (as
indicated through %) are as follows:
Financial
condition (40%) Ownership
background (20%) Payment
record (10%)
Credit history
(10%) Market trend (10%) Operational size
(10%)
This report is issued at your request without any
risk and responsibility on the part of MIRA INFORM PRIVATE LIMITED (MIPL)
or its officials.