MIRA INFORM REPORT
|
Report Date : |
30.04.2013 |
IDENTIFICATION DETAILS
|
Name : |
DK COMPANY VEJLE AS |
|
|
|
|
Registered Office : |
Edisonvej
4 7100 Vejle |
|
|
|
|
Country : |
Denmark |
|
|
|
|
Financials (as on) : |
31.12.2011 |
|
|
|
|
Date of Incorporation : |
31.07.1985 |
|
|
|
|
Legal Form : |
Limited Company |
|
|
|
|
Line of Business : |
Wholesaler of clothing and footwear |
|
|
|
|
No. of Employees : |
70 |
RATING & COMMENTS
|
MIRA’s Rating : |
B |
|
RATING |
STATUS |
PROPOSED CREDIT LINE |
|
|
26-40 |
B |
Capability to overcome financial difficulties seems comparatively
below average. |
Small |
|
Status : |
Moderate |
|
|
|
|
Payment Behaviour : |
Slow but Correct |
|
|
|
|
Litigation : |
Clear |
NOTES:
Any query related to this report can be made
on e-mail: infodept@mirainform.com
while quoting report number, name and date.
ECGC Country Risk Classification List – March 31st 2013
|
Country Name |
Previous Rating (31.12.2012) |
Current Rating (31.03.2013) |
|
Denmark |
A2 |
A2 |
|
Risk Category |
ECGC
Classification |
|
Insignificant |
A1 |
|
Low |
A2 |
|
Moderate |
B1 |
|
High |
B2 |
|
Very High |
C1 |
|
Restricted |
C2 |
|
Off-credit |
D |
denmark ECONOMIC OVERVIEW
This thoroughly modern market
economy features a high-tech agricultural sector, state-of-the-art industry
with world-leading firms in pharmaceuticals, maritime shipping and renewable
energy, and a high dependence on foreign trade. Denmark is a member of the
European Union (EU); Danish legislation and regulations conform to EU standards
on almost all issues. Danes enjoy a high standard of living and the Danish
economy is characterized by extensive government welfare measures and an
equitable distribution of income. Denmark is a net exporter of food and energy
and enjoys a comfortable balance of payments surplus but depends on imports of
raw materials for the manufacturing sector. Within the EU, Denmark is among the
strongest supporters of trade liberalization. After a long consumption-driven
upswing, Denmark's economy began slowing in 2007 with the end of a housing
boom. Housing prices dropped markedly in 2008-09 and, following a short respite
in 2010, has since continued to decline. The global financial crisis has
exacerbated this cyclical slowdown through increased borrowing costs and lower
export demand, consumer confidence, and investment. The global financial crisis
cut Danish real GDP in 2008-09. Denmark made a modest recovery in 2010 with
real GDP growth of 1.3%, in part because of increased government spending;
however, the country experienced a technical recession in late 2010-early 2011.
Historically low levels of unemployment rose sharply with the recession and
have remained at about 6% in 2010-12, based on the national measure, about
two-thirds average EU unemployment. An impending decline in the ratio of
workers to retirees will be a major long-term issue. Denmark maintained a
healthy budget surplus for many years up to 2008, but the budget balance swung
into deficit in 2009. In spite of the deficits, the new coalition government
delivered a modest stimulus to the economy in 2012. Nonetheless, Denmark's
fiscal position remains among the strongest in the EU with public debt at about
45% of GDP in 2012. Despite previously meeting the criteria to join the
European Economic and Monetary Union (EMU), so far Denmark has decided not to
join, although the Danish krone remains pegged to the euro. Denmark held the EU
presidency during the first half of 2012; priorities included promoting a
responsible, dynamic, green, and safe Europe, while working to steer Europe out
of its euro zone economic crisis.
|
Source : CIA |
Company name & address
|
Company
name |
DK
COMPANY VEJLE A/S |
|
Operative
address |
EDISONVEJ
4 7100 VEJLE Denmark |
|
Legal
form |
Limited
company - A/S |
|
Registration number |
Trade
register number: 76180113 Trade register number: 76180113 |
|
VAT-number |
DK76
18 01 13 |
Year 2011 Mutation 2010 Mutation 2009
|
Fixed
assets |
111.511 |
-58,96 |
271.721 |
-75,72 |
1.119. 186 |
|
Total
receivables |
5.027.823 ^ |
1,44 |
4.956. 283 |
-35,83 |
7.723. 162 |
|
|
|||||
|
Total
equity |
2.078. 359 |
90,
82 |
1.089. 151 |
1.354,
77 |
-86.801 |
|
Short
term liabilities |
9.610. 408 |
-29,76 |
13. 682. 683 |
-36,81 |
21. 654. 277 |
|
|
|||||
|
Net
res ult |
-222. 888 |
75,
93 |
-926. 038 |
59,
78 |
-2.302.571 |
|
|
|||||
|
W
orking capital |
1.966. 982 |
140,59 |
817.563 |
210,70 |
-738. 545 |
|
Quick
ratio |
0,95 |
26,
67 |
0,75 |
13,
64 |
0,66 |
ContACT INFORMATION
Company name DK
COMPANY VEJLE A/S
Operative address EDISONVEJ
4
7100 VEJLE
Denmark
Correspondence address EDISONVEJ
4
7100 VEJLE
Denmark
Telephone number +45
79433000
Fax number +45
79433001
Website www.blendofamerica.com
REGISTRATION
Registration number Trade
register number: 76180113
Trade
register number: 76180113
VAT-number
DK76 18 01 13
Status Active
Establishment date 1985-07-31
Legal form Limited
company - A/S
Subscribed share capital DKK
530.000
ACTIVITES
NACE Wholesale
of clothing and footwear (4642)
RELATIONS
Shareholders ULTIMATE
GLOBAL SHAREHOLDER
Name: JENS POULSEN
Country: DK
Type: One or more named
individuals or families
SHAREHOLDERS
Name: DK COMPANY A/S
National id number: 24431118
Address: La Cours Vej 6
Zipcode: 7430
City: IKAST
Country: DK
Phone: +45 96600700
FAX: +45 96600710
Website: www.dkcompany.dk
Type: Bank
Share direct: 100.00%
Turnover: 139.22 mil. EUR
TOTAL assets : 52.34 mil. EUR
Profit loss before tax:
15.7338 mil. EUR
Profit loss after tax net
income: 22.5696 mil. EUR
Shareholders funds: 9.4672
mil. EUR
Number
of employees: 396
Branches Name:
BLEND A/S KBH
National id number:
76180113-1208
Address: Lindgreens Alle 12
Zipcode: 2300
City: KØBENHAVN S
Country: DK
Name: BLUE GOOSE A/S
National id number:
76180113-B5B
Address: Nordlundvej 1
Zipcode: 7330
City: BRANDE
Country: DK
Management
Fullname: Mr. Jens Arne
Krojgaard Poulsen
Type: Individual
Gender: Male
date of birth: 1970/01/01
Age: 43
Country of nationality:
Denmark
Address: Denmark
Number of involvements: 29
Function: Chairman
Level of responsibility:
President / Chairman
Appointment date: 2012/07/02
Fullname: Mr. Jens Obel
Jorgensen
Type: Individual
Gender: Male
Address: Denmark
Number of involvements: 9
Function: Member of the board
Level of responsibility:
Member
Appointment date: 2012/07/02
Fullname: Mr. Soren Bak
Lauritsen
Type: Individual
Gender: Male
Country of nationality:
Denmark
Address: Denmark
Number of involvements: 10
Function: Member of the board
Level of responsibility:
Member
Appointment date: 2012/07/02
Fullname: Mr. Kasper Philipsen
Type: Individual
Gender: Male
Country of nationality:
Denmark
Address: Denmark
Number of involvements: 11
Function: Member of the board
Level of responsibility:
Member
Appointment date: 2012/07/02
Fullname: Mr. Knud
Hjort-Madsen
Type: Individual
Gender: Male
date of birth: 1953/07/27
Age: 59
Country of nationality:
Denmark
Address: Denmark
Number of involvements: 6
Function: General Manager
Level of responsibility:
Highest executive
Relation
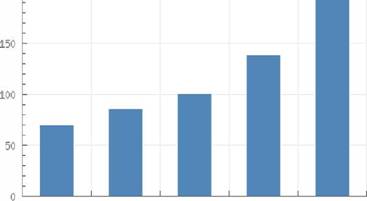
Employees
|
Year |
2011 |
2010 |
2009 |
2008 |
2007 |
|
Total |
70 |
86 |
101 |
139 |
193 |
2011 2010
2009 2008 2007
financial analysis
|
Trend |
Changeable |
|
|
|
|
|
Profitability |
Negative |
|
|
|
|
|
Solvability |
Limited |
|
|
|
|
|
Liquidity |
Satis factory |
|
|
|
|
|
Show amount in |
Euro |
|
|
|
|
Key figures
|
|
|||||
|
Year |
2011 |
2010 |
2009 |
2008 |
2007 |
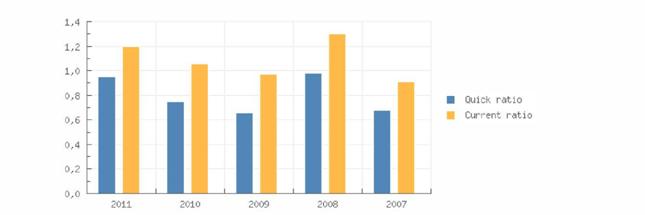
|
Quick
ratio |
0,95 |
0,75 |
0,66 |
0,98 |
0,68 |
|
Current
ratio |
1,20 |
1,06 |
0,97 |
1,30 |
0,91 |
|
|
|||||
|
W
orking capital/ balance total |
0,17 |
0,06 |
-0,03 |
0,21 |
-0,09 |
|
Equity
/ balance total |
0,17 |
0,06 |
-0,03 |
0,21 |
-0,09 |
|
Equity
/ Fixed assets |
18,64 |
4,01 |
-0,08 |
2,83 |
0,04 |
|
Solvability |
1,22 |
1,08 |
1,00 |
1,41 |
1,00 |
|
|
|||||
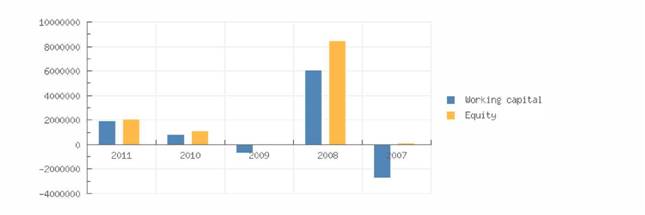
|
W
orking capital |
1.966.982 |
817.563 |
-738. 545 |
6.111. 496 |
-2.773.931 |
|
Equity |
2.078. 359 |
1.089.151 |
-86.801 |
8.465.679 |
121.397 |
|
Mutation
equity |
90, 82 |
1.354, 77 |
-101,03 |
6.873, 55 |
|
|
Mutation
short term liabilities |
-29,76 |
-36,81 |
8,01 |
-37,99 |
|
|
|
|||||
|
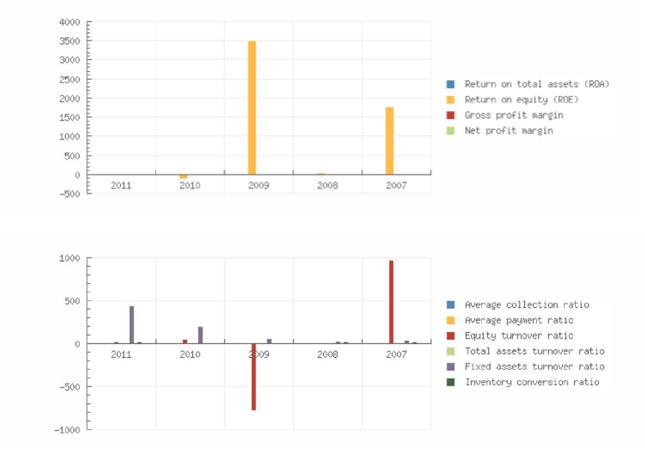
Return
on total assets (ROA) |
-2,54 |
-8,37 |
-13,82 |
13, 02 |
6,63 |
|
Return
on equity (ROE) |
-14,30 |
-113,50 |
3.509, 25 |
44, 84 |
1.772, 33 |
|
Gross
profit margin |
-0,38 |
-2,41 |
-3,70 |
3,63 |
1,02 |
|
Net
profit margin |
-0,45 |
-1,70 |
-3,38 |
3,06 |
1,60 |
|
|
|||||
|
Average
collection ratio |
5,10 |
3,98 |
3,14 |
5,18 |
3,66 |
Average payment ratio 9,76 11, 00 8,81 8,57
9,14
|
Equity
turnover ratio |
23, 61 |
50, 06 |
-784,12 |
12, 27 |
973,90 |
|
T
otal assets turnover ratio |
4,20 |
3,69 |
3,09 |
3,56 |
3,64 |
|
Fixed
assets turnover ratio |
439,96 |
200,66 |
60, 81 |
34, 77 |
40, 83 |
|
Inventory
convers ion ratio |
19, 93 |
12,87 |
10, 44 |
16, 00 |
15,53 |
|
|
|||||
|
T
urnover |
49. 060. 484 |
54. 524. 042 |
68. 062. 261 |
103.906.169 |
118.228.771 |
|
Gross
margin |
19.072.449 |
20. 124. 438 |
22. 966. 994 |
37. 053. 340 |
35. 222. 571 |
|
Operating
result |
-188.856 |
-1.313.964 |
-2.515.361 |
3.766. 966 |
1.209.956 |
Summary
The 2011 financial result structure is a postive working
captial of 1.966.982 euro, which
is in agreement with 17 % of the total assets of the
company.
The working capital has increased with 140.59 % compared
to previous year. The ratio,
with respect to the total assets of the company has
however, increased.
The improvement between 2010 and 2011 has mainly been
caused by an increase of
the current assets.
The current ratio of the company in 2011 was 1.2. W hen
the current ratio is below 1.5,
the company may have problems meeting its short-term
obligations.
The quick ratio in 2011 of the company was 0.95. A company
with a Quick Ratio of
less than 1 cannot current ly pay back its current
liabilities.
The 2010 financial result structure is a postive working
captial of 817.563 euro, which
is in agreement with 6 % of the total assets of the
company.
The working capital has increased with 210.7 % compared to
previous year. The ratio,
with respect to the total assets of the company has
however, increased.
The improvement between 2009 and 2010 has mainly been
caused by an increase of
the current assets.
The current ratio of the company in 2010 was 1.06. W hen
the current ratio is below
1.5, the company may have problems meeting its short-term
obligations.
The quick ratio in 2010 of the company was 0.75. A company
with a Quick Ratio of
less than 1 cannot current ly pay back its current
liabilities.
FINANCAL STATEMENTS
Auditor Name: Ernst & Young P/S
Last annual account 2011
Remark annual account The
company is obligated to publish its annual accounts
Type of annual account Corporate
Annual account DK COMPANY VEJLE
A/S
EDISONVEJ 4
7100 VEJLE
Denmark
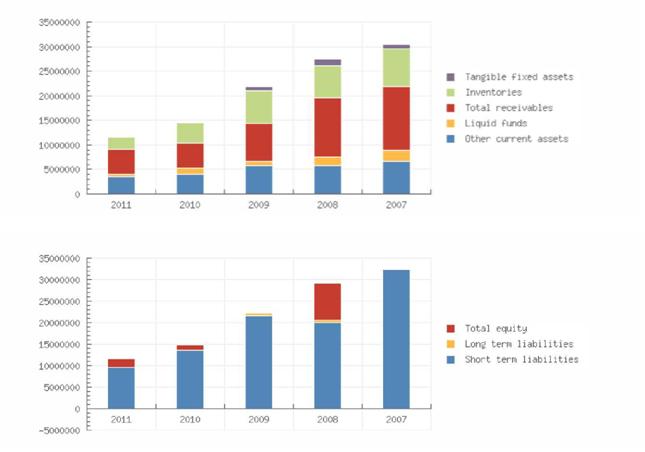
Balance sheet
|
Year |
2011 |
2010 |
2009 |
2008 |
2007 |
|
End
date |
2011-12-31 |
2010-12-31 |
2009-12-31 |
2008-12-31 |
2007-12-31 |
|
Tangible fixed assets |
94.563 |
232.542 |
1.020.214 |
1.395.787 |
848.575 |
|
Other
fixed assets |
16.949 |
39. 179 |
98. 972 |
1.592.252 |
2.046. 753 |
|
Fixed assets |
111.511 |
271.721 |
1.119.186 |
2.988.039 |
2.895.329 |
|
|
|||||
|
Inventories |
2.461.586 |
4.237. 467 |
6.520.518 |
6.494. 501 |
7.612.150 |
|
Total receivables |
5.027.823 |
4.956.283 |
7.723.162 |
12.121.020 |
12.936.492 |
|
Liquid
funds |
668.798 |
1.350.078 |
832.970 |
1.711.763 |
2.302. 129 |
|
Other
current assets |
3.419.183 |
3.956. 418 |
5.839.082 |
5.833.453 |
6.709. 903 |
|
Current assets |
11.577.390 |
14.500.246 |
20.915.732 |
26.160.737 |
29.560.673 |
|
Total assets |
11.688.901 |
14.771.967 |
22.034.918 |
29.148.776 |
32.456.001 |
|
|
|||||
|
Total equity |
2.078.359 |
1.089.151 |
-86.801 |
8.465.679 |
121.397 |
|
Long term
liabilities |
|
467.442 |
633.991 |
|
|
|
Accounts
payable |
2.932. 650 |
2.860.337 |
3.127. 249 |
5.570.503 |
8.861.590 |
|
Short term
liabilities |
9.610.408 |
13.682.683 |
21.654.277 |
20.049.241 |
32.334.604 |
|
Total liabilities |
11.688.901 |
14.771.967 |
22.034.918 |
29.148.776 |
32.456.001 |
Summary
The total assets of the company decreased with -20.87 %
between 2010 and 2011.
This downturn is mainly retrievable in the fixed asset
decrease of -58.96 %.
In 2011 the assets of the company were 0.95 % composed of fixed
assets and 99.05
% by current assets. The assets are being financed by an
equity of 17.78 %, and total
debt of 82.22 %.
The total assets of the company decreased with -32.96 %
between 2009 and 2010.
This downturn is mainly retrievable in the fixed asset
decrease of -75.72 %.
In 2010 the assets of the company were 1.84 % composed of
fixed assets and 98.16
% by current assets. The assets are being financed by an
equity of 7.37 %, and total
debt of 92.63 %.
Profit & loss
|
Year |
2011 |
2010 |
2009 |
2008 |
2007 |
|
Net turn over |
49.060.484 |
54.524.042 |
68.062.261 |
103.906.169 |
118.228.771 |
|
|
|||||
|
Cost
of s ales |
29. 988. 035 |
34. 399. 604 |
45.095.267 |
66.852.830 |
83.006.200 |
|
Gross
margin |
19.072.449 |
20.124.438 |
22.966.994 |
37.053.340 |
35.222.571 |
|
|
|||||
|
Wages
and salaries |
3.995. 974 |
4.904. 311 |
6.034. 485 |
7.658. 065 |
9.968.218 |
|
Amorization
and depreciation |
148.771 |
306.236 |
504.222 |
841.197 |
294.191 |
|
Operating
expenses |
19.261.305 |
21.438.402 |
25.482.355 |
33.286.374 |
34. 012. 615 |
|
Operating result |
-188.856 |
-1.313.964 |
-2.515.361 |
3.766.966 |
1.209.956 |
|
|
|||||
|
Financial
income |
145.139 |
283.582 |
222.955 |
1.615.230 |
2.961.983 |
|
Financial
expenses |
253.557 |
205.757 |
753.659 |
1.586.406 |
2.020. 386 |
|
Financial
res ult |
-108.417 |
77. 825 |
-530.704 |
28. 824 |
941.597 |
|
Result
on ordinary operations
before taxes |
-297.273 |
-1.236.139 |
-3.046.065 |
3.795.790 |
2.151.554 |
|
|
|||||
|
Taxation
on the res ult of ordinary activities |
-74.386 |
-310. 101 |
-743. 494 |
616.996 |
265.682 |
|
Result
of ordinary activities after
taxes |
-222.888 |
-926.038 |
-2.302.571 |
3.178.794 |
1.885.872 |
|
|
|||||
|
Net result |
-222.888 |
-926.038 |
-2.302.571 |
3.178.794 |
1.885.872 |
Summary
The turnover of the company decreased by -10.02 % between
2010 and 2011.
The gross profit of the company decreased by -5.23 %
between 2010 and 2011.
The operating result of the company grew with 85.63 %
between 2010 and 2011. This
evolution implies an increase of the company's economic
profitability .
The result of these changes is an increase of the
company's Economic Profitability of
69.65 % of the analysed period, being equal to 2010 % in
the year 2011.
This growth has contributed to the increase in assets
turnover, increasing by 13.82 %
reaching 4.2.
The Net Result of the company decreased by 75.93 % between
2010 and 2011. The
company's Financial Profitability has been positively
affected by the financial activities
in comparison to the EBITs behaviour. The result of thes e
variations is a profitability
increase of 87.4 % of the analysed period, being -14.3 %
in the year 2011. The
company's financial structure has slowed down its
financial profitability.
The turnover of the company decreas ed by -19.89 % between
2009 and 2010.
The gross profit of the company decreased by -12.38 %
between 2009 and 2010.
The operating result of the company grew with 47.76 %
between 2009 and 2010. This
evolution implies an increase of the company's economic
profitability .
The result of these changes is an increase of the
company's Economic Profitability of
39.44 % of the analysed period, being equal to 2009 % in
the year 2010.
This growth has contributed to the increase in assets
turnover, increasing by 19.42 %
reaching 3.69.
The Net Result of the company decreased by 59.78 % between
2009 and 2010. The
company's Financial Profitability has been negatively
affected by the financial
activities in comparison to the EBITs behaviour. The
result of thes e variations is a
profitability reduction of -103.23 % of the analysed
period, being -113.5 % in the year
2010.
The company's financial profitability has been positively
affected by its financial
structure.
Publications
Remarks Status:
Active
Category: Large company
Last year: 2011
Turnover last year: 49.060.484
EUR
Result last year: -222.888 EUR
TOTAL assets last year: 11.688.901
EUR
Number of employees: 70
Number of shareholders: 1
Number of subsidiaries: 0
Number of branches: 2
FOREIGN EXCHANGE RATES
|
Currency |
Unit
|
Indian Rupees |
|
US Dollar |
1 |
Rs.54.27 |
|
UK Pound |
1 |
Rs.84.23 |
|
Euro |
1 |
Rs.70.90 |
INFORMATION DETAILS
|
Report Prepared
by : |
MNL |
RATING EXPLANATIONS
|
RATING |
STATUS |
PROPOSED CREDIT LINE |
|
|
>86 |
Aaa |
Possesses an extremely sound financial base with the strongest capability
for timely payment of interest and principal sums |
Unlimited |
|
71-85 |
Aa |
Possesses adequate working capital. No caution needed for credit
transaction. It has above average (strong) capability for payment of interest
and principal sums |
Large |
|
56-70 |
A |
Financial & operational base are regarded healthy. General
unfavourable factors will not cause fatal effect. Satisfactory capability for
payment of interest and principal sums |
Fairly Large |
|
41-55 |
Ba |
Overall operation is considered normal. Capable to meet normal
commitments. |
Satisfactory |
|
26-40 |
B |
Capability to overcome financial difficulties seems comparatively
below average. |
Small |
|
11-25 |
Ca |
Adverse factors are apparent. Repayment of interest and principal sums
in default or expected to be in default upon maturity |
Limited with
full security |
|
<10 |
C |
Absolute credit risk exists. Caution needed to be exercised |
Credit not
recommended |
|
---- |
NB |
New Business |
---- |
This score serves as a reference to assess
SC’s credit risk and to set the amount of credit to be extended. It is
calculated from a composite of weighted scores obtained from each of the major
sections of this report. The assessed factors and their relative weights (as
indicated through %) are as follows:
Financial
condition (40%) Ownership
background (20%) Payment
record (10%)
Credit history
(10%) Market trend (10%) Operational size
(10%)
This report is issued at your request without any
risk and responsibility on the part of MIRA INFORM PRIVATE LIMITED (MIPL)
or its officials.