RIME

MIRA INFORM REPORT


Report Date :

30.04.2013


IDENTIFICATION DETAILS


Correct Name :

DYES AND CHEMICALS MANUFACTURING


Registered Office :

Zone Industrielle Ouled Saleh Nº I3G12, Bouskoura, Casablanca 20180


Country :

Morocco


Financials (as on) :

31.12.2011


Date of Incorporation :

27.04.1994


Com. Reg. No.:

73901


Legal Form :

Societe A Responsibilite Limitee


Line of Business :

·         Wholesaler of chemical products

·         Manufacturer of dyes and pigments


No. of Employees :

25


RATING & COMMENTS


MIRA’s Rating :

Ba


RATING

STATUS

PROPOSED CREDIT LINE

41-55

Ba

Overall operation is considered normal. Capable to meet normal commitments.

Satisfactory


Status :

Good


Payment Behaviour :

No  Complaints 


Litigation :

Clear 


NOTES:

Any query related to this report can be made on e-mail: infodept@mirainform.com  while quoting report number, name and date.


ECGC Country Risk Classification List – March 31st 2013


Country Name

Previous Rating

(31.12.2012)

Current Rating

(31.03.2013)

Morocco

A2

A2


Risk Category

ECGC Classification

Insignificant


A1

Low


A2

Moderate


B1

High


B2

Very High


C1

Restricted


C2

Off-credit


D


morocco ECONOMIC OVERVIEW


Morocco has capitalized on its proximity to Europe and relatively low labor costs to build a diverse, open, market-oriented economy. In the 1980s Morocco was a heavily indebted country before pursuing austerity measures and pro-market reforms, overseen by the IMF. Since taking the throne in 1999, King MOHAMMED VI has presided over a stable economy marked by steady growth, low inflation, and gradually falling unemployment, although a poor harvest and economic difficulties in Europe contributed to an economic slowdown in 2012. Industrial development strategies and infrastructure improvements - most visibly illustrated by a new port and free trade zone near Tangier - are improving Morocco's competitiveness. Morocco also seeks to expand its renewable energy capacity with a goal of making renewable 40% of electricity output by 2020. Key sectors of the economy include agriculture, tourism, phosphates, textiles, apparel, and subcomponents. To boost exports, Morocco entered into a bilateral Free Trade Agreement with the United States in 2006 and an Advanced Status agreement with the European Union in 2008. Despite Morocco's economic progress, the country suffers from high unemployment, poverty, and illiteracy, particularly in rural areas. In 2011 and 2012, high prices on fuel - which is subsidized and almost entirely imported - strained the government's budget and widened the country's current account deficit. Key economic challenges for Morocco include fighting corruption and reforming the education system, the judiciary, and the government's costly subsidy program.


Source : CIA


Company name


DYES AND CHEMICALS MANUFACTURING


Payment Record


NO COMPLAINTS


This rating is based on available data. In the event of additional information a  possibility for a different rating applies.


Registration Briefing


Registration Number:                             73901

Registration Date:                                   27/04/1994

Legal Form:                                            SOCIETE A RESPONSIBILITE LIMITEE

Latest Financials:                                   December 31, 2011


Financial Briefing


Nominal Capital:                                     7,000,000 Moroccan Dirham

Issued Capital:                                       N/A

Turnover:                                               68,715,297 Moroccan Dirham

Net Profit:                                               3,189,934 Moroccan Dirham

Net Worth:                                              34,757,691 Moroccan Dirham


Original Investigation Details


Company Name:                                         DYECHEM

Country:                                                      MO

Street Name:                                               DYES & CHEMICAL MANUFATURING ZONE INDL OULED

                                                                  SALEH

City Code:

Post Code:                                                 NO 13912 201

Phone Number:                                           21252293570


Company Details


Company Name:                                         DYES AND CHEMICALS MANUFACTURING

Also trades as:                                            DYECHEM

Headquarter Address:                                  Zone Industrielle Ouled Saleh Nº I3G12,

                                                                  Bouskoura,

                                                                  Casablanca 20180,

                                                                  Morocco


Telephone:                                                  +212522 593570

                                                                  +212522 593580

Fax:                                                            +212522 592731


E‑Mail:                                                        info@dyechem‑colours.com 

Web Site:                                                    www.dyechem‑colours.com  (under construction)


Company was originally started on 27/04/1994


Registration & Legal Details


Current Legal Form:                                   SOCIETE A RESPONSIBILITE LIMITEE

Registration Address:                                147 Route de Zenata ‑ Ain Sebaa,

                                                                Casablanca

Registration Number:                                 73901

Registration Date:                                     27/04/1994

Year/Date Company Established:               27/04/1994

Registration Town:                                     Casablanca

Tax Registration Number:                           01640806


Capital


Currency:                                                                Moroccan Dirham

Authorized Capital:                                                              7,000,000

Paid Up Capital:                                                                  7,000,000


Authorized Capital Breakdown


Number of Shares: 70,000                         Type of Shares:  None Selected

Issued Shares: 70,000                               Value per share: MDH 100.00              

                                                                Value of this type: 7,000,000.00


Shareholders / Owners


Shareholders:


Name/Other Information                                                   Shares Held                              % of

                                                                                                                                      Voting/Non‑Voting

                                                                                                                                      capital

Mr. Hammad Taoudi Ben Chekroun,                               17,150                                      24.50% (VOTING)

22, Rue Zahraoui Andal,

Casablanca,

Morocco

Mr. Youssef Taoudi Ben Chekroun,                                3,500                                        5.00% (VOTING)

22, Rue Zahraoui Andal,

Casablanca,

Morocco

Mr. Hicham Taoudi Ben Chekroun,                                 3,500                                        5.00% (VOTING)

22, Rue Zahraoui Andal,

Casablanca,

Morocco

Mr. Mohamed Ben Abdellah Taoudi Ben                        3,500                                        5.00% (VOTING)

Chekroun,

74, Lotissement Dr. Faraj,

Fes,

Morocco

Mr. Mohamed Ben Hammad Taoudi Ben                        10,500                                      15.00% (VOTING)

Chekroun,

34, Rue Normandie, Maarif,

Casablanca,

Morocco

Mr. Abdellatif Taoudi Ben Chekroun,                              18,550                                      26.50% (VOTING)

74, Lotissement Dr. Faraj,

Fes,

Morocco

Mr. Ali Taoudi Ben Chekroun,                                        13,300                                      19.00% (VOTING)

40, Résidence Des Oranges,

Fes,

Morocco


Principals


Name:                                                       Mr Hammad Taoudi Ben Chekroun

Position within the company:                     President and managing director

Date of Birth:                                            1939

Town of Birth:                                           Fes

Country of Birth:                                        Morocco

Nationality:                                                Moroccan

Can fluently speak:                                    Arabic & French


Name:                                                       Mr Mohamed Taoudi Ben Chekroun

Position within the company:                     General Director

Additional Information:                              Mail : m.benchekroun@dyechem‑colours.com

Date of Birth:                                            13/04/1967

Town of Birth:                                           Casablanca

Country of Birth:                                        Morocco

Nationality:                                                Moroccan

Can fluently speak:                                    Arabic, French & English


Name:                                                       Mr Mustapha El Hilali

Position within the company:                     Financial Manager

Additional Information:                              Mail : m.elhilali@dyechem‑colours.com

Country of Birth:                                        Morocco

Nationality:                                                Moroccan

Can fluently speak:                                    Arabic & French


Name:                                                       Mr Nabil Diouri

Position within the company:                     Commercial Manager

Country of Birth:                                        Morocco

Nationality:                                                Moroccan

Can fluently speak:                                    Arabic & French


Company Activities


NACE Codes:         4675           Wholesale of chemical products ‑ 80%

                              2012           Manufacture of dyes and pigments ‑ 20%


DYECHEM is engaged in manufacture and marketing of dyes and chemicals.


Local Reporters consider the investigated company to be MEDIUM in their field of concern.


Operations


Employees                                               Company Employs: 25


HQ Premises                                            Operates from:    Rented Offices , Shop, Factory, Warehouse

                                                                Location:            Industrial Area

Imports


                                                                                                              Imports Raw Materials, Imports Finished Goods

                                                              Imports From:                           Europe, South East Asia

                                                              Importing Terms:                       60‑90 days credit, letters of credit

Subject's Suppliers:                                  Company Name: SYRAL


                                                                Company Name: CABOT


                                                                Company Name: OLEON


                                                                Company Name: SINOCHEM


                                                                Company Name: KEMIRA


Exports

                                                              Export % and type of product:   10%

                                                              Exports To:                               Europe, Africa

                                                              Exporting Terms:                       60‑90 days credit, letters of credit


Trading & Selling


                                                               Territory:                                  90% Nationally, 10% International

                                                              Type of Customer:                    Resellers & Industrial Companies :

                                                                                                              BIMO, AIGUEBELLE, PASTOR,

                                                                                                              MARGAFRIQUE


Vehicles:                                                  Total number of vehicles: 6

                                                                2 trucks

                                                                2 vans

                                                                4 cars


Related Companies


Subsidiaries

Affiliates

Information on Related Companies is not available/applicable


Bankers


Crédit Du Maroc,

Branch: Strasbourg

1 Rue de Strasbourg,

Casablanca,

Morocco

Account Number:                                        021780 0000 040 030 153374 63


Financial Information


Source:                                                     Mr. Mustapha El Hilali Financial Manager

Figures are:                                               Official Figures

Currency:                                                  Moroccan Dirham


Months                       Sales Figures         Sales                                    Gross Profit/Loss           Net

                                                                                                                                                  Profit/Loss

               12                31/12/2012              68,715,297                                                                 3,189,934

               12                31/12/2011              63,774,357                           6,596,284                        4,669,933

               12                31/12/2010              56,984,740                           6,829,537                        4,861,331

               12                31/12/2009              49,743,103                           5,514,298                        3,897,224

               12                31/12/2008              45,318,452                           3,732,118                        2,628,617

               12                31/12/2007              35,297,353                           2,956,683                        1,932,757

               12                31/12/2006              30,550,104                           2,616,442                        1,711,335

               12                31/12/2005              20,062,187                           1,997,094                        1,230,122


Balance Sheet & Profit & Loss


BALANCE SHEET

As at:                                                               31‑Dec‑2011                  31‑Dec‑2010                 31‑Dec‑2009

  Fixed Assets

  Land & Buildings

  Plant & Machinery                                                   420,390                                    215,023                                    179,448

  Furniture & Equipment                                             540,771                                    577,914                                    455,088

  Motor Vehicles                                                        104,472                                    172,858                                      96,846

  Misc. Fixed Assets                                                  649,117

  Total Fixed Assets                                               1,714,750                                    965,795                                    731,382


  Financial Assets

  Shares in Related Companies

  Loans to related companies

  Investments                                                             231,700                                      50,617                                       2,917

  Deposits

  Misc. Financial Assets                                                2,000                                       2,000                                       2,000

  Total Financial Assets                                            233,700                                      52,617                                       4,917


  Intangibles

  Goodwill

  Organisational Expenses                                           34,171                                      82,141                                    138,416

  Patents                                                                    69,815                                      95,241                                      17,301

  Misc. Intangible Assets

  Total Intangible Assets                                          103,986                                    177,382                                    155,717


  Current Assets

  Stock                                                                 17,184,344                               12,447,068                               11,697,749

  Stock & Work in Progress                                        247,448                                    114,868                                    150,085

  Trade Debtors & receivables                               27,782,773                               24,861,471                               21,130,995

  Provision for bad debs

  Other receivables                                                    155,742                                    126,718                                    122,521

  Due from related companies

  Owed by shareholders

  Prepaid expenses                                                   632,803                                    244,371                                      34,466

  Cash                                                                    3,290,602                                 2,729,185                                 3,151,429

  Tax recoverable                                                    3,229,274                                 1,447,121                                 1,410,512

  Marketable Securities

  Misc. Current Assets                                               138,008                                      21,827                                      32,771

  Total Current Assets                                          52,660,994                               41,992,629                               37,730,528

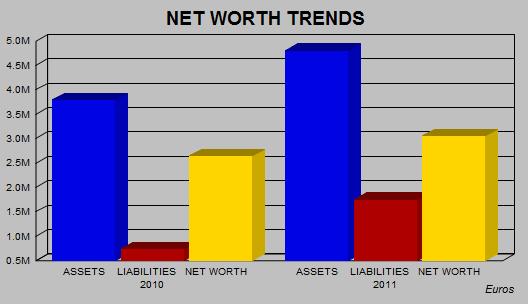
  Total Assets                                                      54,713,430                               43,188,423                               38,622,544

  Owner's Equity & Liabilities

  Issued and paid up capital                                    7,000,000                                 7,000,000                                 7,000,000

  Share premium account

  Retained earnings                                               21,933,370                               17,315,105                               13,612,743

  Net profit/Loss for the year                                   4,669,933                                 4,861,331                                 3,897,224

  Revaluation reserves

  Legal Reserves                                                    1,154,388                                    911,322                                    716,460

  Other reserves

  Net Worth                                                          34,757,691                               30,087,758                               25,226,427


  Deffered Taxation

  Provisions/allowances

  Mortgages/Loans                                                 2,912,159

  Hire purchase

  Due to group of companies

  Minority interest

  Misc. deferred liabilities

  Total Long Term Liabilities                                 2,912,159                                              0                                              0


  Current Liabilities

  Creditors                                                            12,690,110                                 6,484,700                                 6,013,159

  Other creditors                                                           9,072                                       4,500                                    134,541

  Accruals                                                                                                                    6,402                                       6,402

  Bank overdrafts/Loans

  Misc. Loans

  Directors accounts

  Owing to shareholders                                                                                         2,912,160                                 2,912,160

  Owing to related companies

  Proposed dividend

  Long Term‑due 1 year

  Hire Purchase‑under 1 year

  Taxation                                                               4,148,043                                 3,493,406                                 3,654,898

  Advance receipts                                                        5,100                                                                                   501,575

  Misc. Current Liabilities                                            191,255                                    199,497                                    173,382

  Total Current Liabilities                                     17,043,580                               13,100,665                               13,396,117

  Owner's Equity & Liabilities                              54,713,430                               43,188,423                               38,622,544


PROFIT & LOSS


Figures are:                               Figures are:               Figures are:

Fiscal Year                                Fiscal Year                Fiscal Year


01/01/2011-                               01/01/2010                 01/01/2009

31/12/2011                                -31/12/2010                 31/12/2009

  Total Income/Turnover                                         63,774,357                               56,984,740                               49,743,103

  Cost of sales                                                     42,574,719                               33,117,160                               29,737,291


  Gross Profit/(Loss)                                             21,199,638                               23,867,580                               20,005,812


  Admin/selling expenses                                        8,059,528                               10,719,307                                 8,226,918

  Services                                                              2,500,302                                 2,631,176                                 2,064,893

  Salaries                                                               4,028,416                                 3,532,221                                 3,463,198

  Auditors Fee                                                             80,334                                      71,495                                      85,626

  Stock Depreciation                                                 ‑470,215                                      ‑9,931                                    373,684

  Depreciation                                                           430,761                                    326,499                                    341,114

  Misc. Operating Expenses

  Misc. Operating Income                                                                                                                                           15,324

  Net Operating Profit/(Loss)                                  6,570,512                                 6,596,813                                 5,465,703


  Interest Receivable/Finance Income

  Group related income

  Misc. Financial Income                                            272,949                                    523,459                                    375,570

  Total Financial Income                                          272,949                                    523,459                                    375,570


  Interest Payable/Finance costs                                  30,076                                       4,440                                      63,110

  Misc. financial expenses                                         217,101                                    286,295                                    263,865

  Total Financial Expenses                                       247,177                                    290,735                                    326,975


  Profit/(Loss) before taxes                                    6,596,284                                 6,829,537                                 5,514,298


  Income Tax                                                          1,926,351                                 1,968,206                                 1,617,074

  Other Tax

  Profit/(Loss) after taxes                                       4,669,933                                 4,861,331                                 3,897,224


  Extraordinary items

  Exceptional items

  Misc. Items


  Net Profit/(Loss)                                                  4,669,933                                 4,861,331                                 3,897,224


  Previous years retained earnings

  Current years net income                                      4,669,933                                 4,861,331                                 3,897,224

  Misc. additions in current year

  Current years net loss

  Dividends in current year

  Withdrawals in current year

  Misc. deductions in current year


  Retained earnings at end of                                 4,669,933                                 4,861,331                                 3,897,224

  financial period


  Average employees


  Directors fee

  Earnings per share

  Earnings per share‑previous year


Auditors Comments


Date accounts obtained:                           19/03/2013

Accounts obtained from:                          Companies registry


Auditors Opinion:                                    The audited financial statement gives a true and fair view of the state

                                                                of affairs of the subject


                                                                Financial Statements have been prepared on an on‑going basis.

                                                                Assuming support of: shareholders


FINANCIAL RATIOS / COMPARATIVE DATA


                                      Actual Company      Industrial Averages      Actual Company      Industrial Averages

                                        Results (2011)                   (2011)                  Results (2010)                   (2010)

  Liquidity Ratios

  Current Ratio                                      3.09                            1.54                           3.21                            1.51

  Acid Test Ratio                                   2.07                            1.03                           2.25                            1.00

  Accounts                                           0.20                            0.37                           0.11                            0.39

  Payable/Sales Ratio

  Current Liabilities/Net                          0.49                            0.56                           0.44                            4.08

  Worth

  Current                                               0.98                            2.27                           1.04                            2.69

  Liabilities/Inventory

  Total Liabilities/Net                             0.57                           ‑0.14                           0.44                            4.25

  Worth

  Fixed Assets/Net                                4.93                         ‑27.89                           3.21                          41.11

  Worth (%)


  Profitability Ratios

  Gross Profit Ratio (%)                       33.24                          26.40                          41.88                          25.85

  Return on Capital                              17.51                          21.18                          22.70                          22.80

  Employed (ROCE)(%)

  Net Profit/Sales (%)                          10.34                            3.66                          11.98                           ‑1.47

  Return on Assets (%)                        12.06                            5.35                          15.81                            4.16


  Efficiency Ratios

  Sales/Working Capital                         1.79                            8.39                           1.97                            7.89

  Assets/Sales(%)                               85.79                        133.81                          75.79                        121.74

  Shareholders                                    18.98                          40.04                          22.70                          21.80

  Return(%)

  Average Inventory                           127.02                        176.07                        133.06                        268.40

  Period

  Average Collection                          150.65                        237.82                        147.30                        140.59

  Period

  Sales/Inventory                                   3.66                            4.17                           4.54                            4.56


  Leverage Ratios

  Capital Employed                               1.84                            5.11                           1.91                            6.69

  Capital Structure (%)                           7.73                          44.17                           0.00                           ‑1.76


  Number of                                                                            634                                                              634

  Companies within the

  industry (NACE G)

  Statistics based on                                       Wholesale and retail                                      Wholesale and retail

  NACE(G)                                                      trade;repair of motor                                     trade;repair of motor

                                                                     vehicles and                                                 vehicles and

                                                                     motorcycles                                                 motorcycles


The statistical Industrial Average results are calculated against Companies within the database for the specific country.


INDUSTRY SECTOR COMPARATIVE DATA


        Elements Taken              Result for specific                    RANKING                Total Companies Used

                                                      company

DATE OF REGISTRATION                        27/04/1994                                    545                                  1397

TOTAL EMPLOYEES                                            25                                    366                                  1232

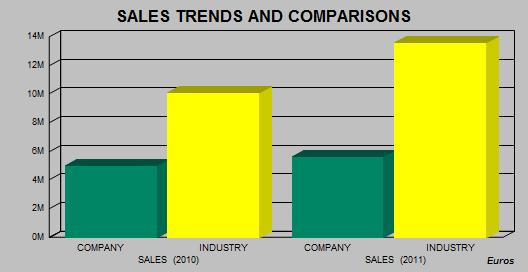
SALES (2011)                                            5,607,041                                    102                                    344

SALES (2010)                                            5,010,098                                    149                                    603

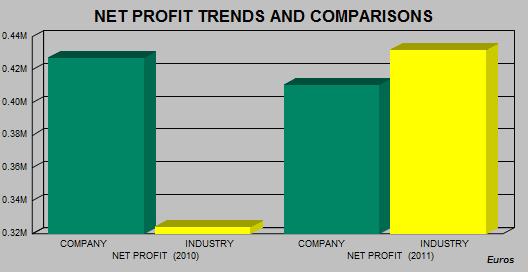
NET PROFIT (2011)                                      410,581                                      48                                    315

NET PROFIT (2010)                                      427,408                                      74                                    616

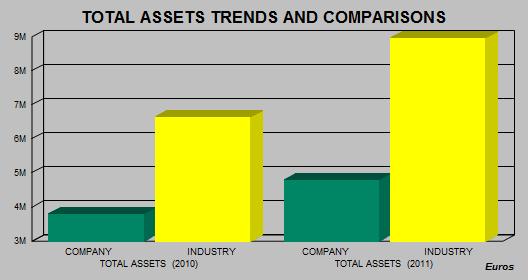
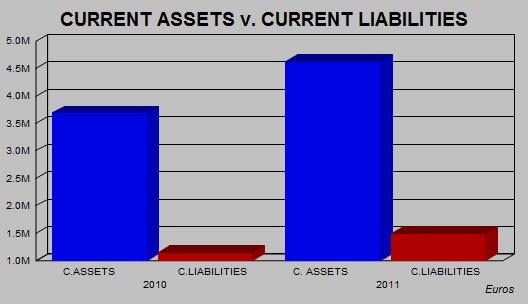
TOTAL ASSETS (2011)                              4,810,405                                      93                                    306

TOTAL ASSETS (2010)                              3,797,126                                    170                                    618


                                                                                                                                        Currency: EUROS


Rankings:

The results given below are calculated against companies with the Database for the specific country.


Scale: 1 is the highest result found in our database.

Example: Ranking 5: Total Companies used to generate the Ranking : 20

This means that this company is the 5th largest company out of 20 found in our database in the specific industry


Charts of Financial Trends and Industry Comparisons


PLEASE NOTE THAT CHARTS ARE SHOWN IN EUROS FOR TREND AND COMPARISON PURPOSES


The statistical Industrial Average results are calculated against companies within the database for the specific country.


Payments


Subject's payments reported to be:        NO COMPLAINTS


Representation


Auditors:           REVISCONTROLE

Rue Ibn El Mouataz, Résidence le Joyau 4, First Floor

Tel:                   212522 242304


Other Comments


Other Comments:          Patent : 31504535


Interview & Reporter Comments


Name/Title:                                            Mr. Mustapha El Hilali Financial Manager

Comment:                                             Subject has confirmed the general details shown in the report.


Reporter Comment Date:                       26/04/2013

Reporter Comment:                               All legal forms in Morocco are obliged by law to be registered with the

                                                            Registry Office (OMPIC :


                                                            Office Marocain De La Propriete Industrielle Et Commerciale) which is

                                                            publicly available.


Subject was found registered and Information obtained from above official source is as follows :


Registered name /  registration number / date of registration  / registered address / legal form / capital / main principals – administrators / shareholders / shareholders% / financial information.


Any other data stated in the report was obtained directly from the subject company and/or other publicly available information. Therefore it should be used as a point of reference as it is not possible to verify such data with official sources.


Conclusions


Local Reputation:                                      The company being investigated is considered by local reporters to be

                                                                a Fair / Normal Trade Risk.


General Conclusion:                                  Local informants consider granting of credit to be a fair trade risk.


Owner/Shareholders Comments:                Some of the owners / shareholders have an active participation in the

                                                                running of the business.


Financial Results Trend:                             Financial Information indicates that the business activities of the

                                                                company are declining in strength.


Age of Business:                                      The company is a long established family run business.


FOREIGN EXCHANGE RATES


Currency

Unit

Indian Rupees

US Dollar

1

Rs.54.27

UK Pound

1

Rs.84.23

Euro

1

Rs.70.90


INFORMATION DETAILS


Report Prepared by :

MNL


RATING EXPLANATIONS


RATING

STATUS


PROPOSED CREDIT LINE

>86

Aaa

Possesses an extremely sound financial base with the strongest capability for timely payment of interest and principal sums


Unlimited

71-85

Aa

Possesses adequate working capital. No caution needed for credit transaction. It has above average (strong) capability for payment of interest and principal sums


Large

56-70

A

Financial & operational base are regarded healthy. General unfavourable factors will not cause fatal effect. Satisfactory capability for payment of interest and principal sums


Fairly Large

41-55

Ba

Overall operation is considered normal. Capable to meet normal commitments.


Satisfactory

26-40

B

Capability to overcome financial difficulties seems comparatively below average.


Small

11-25

Ca

Adverse factors are apparent. Repayment of interest and principal sums in default or expected to be in default upon maturity


Limited with full security

<10

C

Absolute credit risk exists. Caution needed to be exercised


Credit not recommended

----

NB

New Business

----


This score serves as a reference to assess SC’s credit risk and to set the amount of credit to be extended. It is calculated from a composite of weighted scores obtained from each of the major sections of this report. The assessed factors and their relative weights (as indicated through %) are as follows:

Financial condition (40%)            Ownership background (20%)                  Payment record (10%)

Credit history (10%)                   Market trend (10%)                                Operational size (10%)

PRIVATE & CONFIDENTIAL : This information is provided to you at your request, you having employed MIPL for such purpose. You will use the information as aid only in determining the propriety of giving credit and generally as an aid to your business and for no other purpose. You will hold the information in strict confidence, and shall not reveal it or make it known to the subject persons, firms or corporations or to any other. MIPL does not warrant the correctness of the information as you hold it free of any liability whatsoever. You will be liable to and indemnify MIPL for any loss, damage or expense, occasioned by your breach or non observance of any one, or more of these conditions

This report is issued at your request without any risk and responsibility on the part of MIRA INFORM PRIVATE LIMITED (MIPL) or its officials.