MIRA INFORM REPORT
|
Report Date : |
09.08.2013 |
IDENTIFICATION DETAILS
|
Name : |
ROHM AND HAAS EUROPE TRADING APS |
|
|
|
|
Registered Office : |
Sorgenfrivej 15 2800 Kgs.Lyngby |
|
|
|
|
Country : |
Denmark |
|
|
|
|
Date of Incorporation : |
24.10.2006 |
|
|
|
|
Com. Reg. No.: |
29973881 |
|
|
|
|
Legal Form : |
Private Limited Company - ApS |
|
|
|
|
Line of Business : |
Wholesale of chemical products |
|
|
|
|
No. of Employees : |
157 |
RATING & COMMENTS
|
MIRA’s Rating : |
Ba |
|
RATING |
STATUS |
PROPOSED CREDIT LINE |
|
|
41-55 |
Ba |
Overall operation is considered normal. Capable to meet normal
commitments. |
Satisfactory |
|
Status : |
Satisfactory |
|
Payment Behaviour : |
No Complaints |
|
Litigation : |
Clear |
NOTES :
Any query related to this report can be made
on e-mail: infodept@mirainform.com
while quoting report number, name and date.
ECGC Country Risk Classification List – March 31st, 2013
|
Country Name |
Previous Rating (31.12.2012) |
Current Rating (31.03.2013) |
|
Denmark |
A2 |
A2 |
|
Risk Category |
ECGC
Classification |
|
Insignificant |
A1 |
|
Low |
A2 |
|
Moderate |
B1 |
|
High |
B2 |
|
Very High |
C1 |
|
Restricted |
C2 |
|
Off-credit |
D |
DENMARK - ECONOMIC OVERVIEW
This thoroughly modern market economy features a high-tech agricultural sector, state-of-the-art industry with world-leading firms in pharmaceuticals, maritime shipping and renewable energy, and a high dependence on foreign trade. Denmark is a member of the European Union (EU); Danish legislation and regulations conform to EU standards on almost all issues. Danes enjoy a high standard of living and the Danish economy is characterized by extensive government welfare measures and an equitable distribution of income. Denmark is a net exporter of food and energy and enjoys a comfortable balance of payments surplus but depends on imports of raw materials for the manufacturing sector. Within the EU, Denmark is among the strongest supporters of trade liberalization. After a long consumption-driven upswing, Denmark's economy began slowing in 2007 with the end of a housing boom. Housing prices dropped markedly in 2008-09 and, following a short respite in 2010, has since continued to decline. The global financial crisis has exacerbated this cyclical slowdown through increased borrowing costs and lower export demand, consumer confidence, and investment. The global financial crisis cut Danish real GDP in 2008-09. Denmark made a modest recovery in 2010 with real GDP growth of 1.3%, in part because of increased government spending; however, the country experienced a technical recession in late 2010-early 2011. Historically low levels of unemployment rose sharply with the recession and have remained at about 6% in 2010-12, based on the national measure, about two-thirds average EU unemployment. An impending decline in the ratio of workers to retirees will be a major long-term issue. Denmark maintained a healthy budget surplus for many years up to 2008, but the budget balance swung into deficit in 2009. In spite of the deficits, the new coalition government delivered a modest stimulus to the economy in 2012. Nonetheless, Denmark's fiscal position remains among the strongest in the EU with public debt at about 45% of GDP in 2012. Despite previously meeting the criteria to join the European Economic and Monetary Union (EMU), so far Denmark has decided not to join, although the Danish krone remains pegged to the euro. Denmark held the EU presidency during the first half of 2012; priorities included promoting a responsible, dynamic, green, and safe Europe, while working to steer Europe out of its euro zone economic crisis.
Source
: CIA
Summary
Company name ROHM AND HAAS EUROPE TRADING APS
Operative address SORGENFRIVEJ 15
2800 KGS.LYNGBY
Denmark
Risk Average risk
Status Active
Specification This company can
meet all its obligations.
Legal form Private limited
company - ApS
Registration number Trade register
number: 29973881
Trade register number: 29973881
VAT-number DK29 97 38 81
Year 2012 Mutation 2011 Mutation 2010
Fixed assets 150.965.032 -15,43 178.515.960 -20,58 224.780.992
Total receivables 199.675.046 -3,94 207.872.996 -1,58 211.213.981
Total equity 59.783.973 63,58 36.547.960 -56,41 83.837.965
Short term liabilities 371.926.025 -54,90 824.739.974 190,21 284.190.954
Net result 17.116.052 141,31 -41.433.065 -284,14 -10.785.965
Working capital -51.699.053 48,47 -100.324.962 -263,31 61.434.080
Quick ratio 0,86 -2,27 0,88 -27,87 1,22
Contact information
Company name ROHM AND HAAS
EUROPE TRADING APS
Operative address SORGENFRIVEJ 15
2800 KGS.LYNGBY
Denmark
Correspondence address SORGENFRIVEJ 15
2800 KGS.LYNGBY
Denmark
Telephone number +45 35444301
Registration
Registration number Trade register
number: 29973881
Trade register number: 29973881
VAT-number DK29 97 38 81
Status Active
Establishment date 2006-10-24
Legal form Private limited
company - ApS
Subscribed share capital DKK 620.000
Activities
NACE Wholesale of
chemical products (4675)
Relations
Shareholders ULTIMATE GLOBAL
SHAREHOLDER
Name: DOW CHEMICAL COMPANY (THE)
National id number: 24224864
Address: Sorgenfrivej 15
Zipcode: 2800
City: MIDLAND
Country: US
Type: Industrial company
Turnover: 56786 mil. EUR
TOTAL assets: 69605 mil. EUR
Profit loss before tax: -2.62427 mil. EUR
Profit loss after tax net income: -2.38289 mil. EUR
Shareholders funds: 245.12872 mil. EUR
ULTIMATE DOMESTIC SHAREHOLDER
Name: ROHM AND HAAS EUROPEAN HOLDING APS
National id number: 38-1285128
Address: 2030, Dow Center
Zipcode: 48674
City: KGS.LYNGBY
Country: DK
Phone: +1 989 636 1000
FAX: +1 989 636 1830
Website: www.dow.com
Type: Industrial company
TOTAL assets: 245.75 mil. EUR
Profit loss before tax: 1665 mil. EUR
Profit loss after tax net income: 842 mil. EUR
Shareholders funds: 20877 mil. EUR
SHAREHOLDERS
Name: ROHM AND HAAS DENMARK HOLDING COMPANY APS
National id number: 28128444
Address: Sorgenfrivej 15
Zipcode: 2800
City: KGS.LYNGBY
Country: DK
Phone: +45 35444333
Website: www.rohmhaas.com
Type: Industrial company
Share direct: 100.00%
TOTAL assets: 1166.25 mil. EUR
Profit loss before tax: 1.83404 mil. EUR
Profit loss after tax net income: 2.6559 mil. EUR
Shareholders funds: 1108.56387 mil. EUR
Number of employees: 0
Structure SUBSIDIARIES
Name: RH DEUTSCHLAND PRODUKTION GMBH AND CO KG
Country: DE
Type: Industrial company
Share direct: 100.00%
Name: RH DEUTSCHLAND PRODUKTION HOLDING GMBH
Country: DE
Type: Industrial company
Share direct: 100.00%
Name: RH DEUTSCHLAND PRODUKTION HOLDING GMBH
Country: DE
Type: Industrial company
Share direct: 100.00%
Name: RH ELECTRONIC MATERIALS SCHWEIZ GMBH
Country: CH
Type: Industrial company
Share direct: 100.00%
Name: RH NORDISKA AB
Country: SE
Type: Industrial company
Share direct: 100.00%
Name: RH SOUTH AFRICA (PTY)LIMITED
Country: ZA
Type: Industrial company
Share direct: 100.00%
Name: RH SWITZERLAND PRODUCTION HOLDING GMBH
National id number: CH-100.4.787.168-9
Address: Grossmatte 4
Zipcode: 6014
City: LUZERN
Country: CH
Type: Industrial company
Phone: +41 41 2594444
Fax: +41 41 2594400
Share direct: 100.00%
Number of employees: 4
Name: ROHM AND HAAS DEUTSCHLAND PRODUKTION GMBH & CO. KG
National id number: HRA 3356 (Königstein im Taunus)
Address: Am Kronberger Hang 4
Zipcode: 65824
City: SCHWALBACH
Country: DE
Type: Industrial company
Phone: +49 6196 5660
Fax: +49 6196 566444
Website: www.dow.com
Share direct: 100.00%
Turnover: 7.67 mil. EUR
Total assets: 32.36 mil. EUR
Profit loss before tax: -0.14408 mil. EUR
Profit loss after tax net income: -0.14408 mil. EUR
Shareholders funds: 18.27309 mil. EUR
Number of employees: 74
Name: ROHM AND HAAS NORDISKA AKTIEBOLAG
National id number: 556070-9288
Address: Box 45
Zipcode: 261 22
City: LANDSKRONA
Country: SE
Type: Industrial company
Phone: +46 418 450400
Website: www.dow.com
Share direct: 100.00%
Turnover: 10.32 mil. EUR
Total assets: 28.87 mil. EUR
Profit loss before tax: 1.23207 mil. EUR
Profit loss after tax net income: 0.89938 mil. EUR
Shareholders funds: 23.37981 mil. EUR
Number of employees: 44
Name: ROHM AND HAAS SOUTH AFRICA (PTY) LTD
National id number: 1997/019822/07
Address: 8 SCHAFFER ROAD
Zipcode: 3610
City: PINETOWN
Country: ZA
Type: Industrial company
Phone: +27 31 7165900
Fax: +27 31 7165965
Share direct: 100.00%
Number of employees: 70
Bank details
Accounts Citibank
International Plc.
Management
Management Fullname: Miss
Nicola Jayne Ephgrave
Type: Individual
Gender: Female
date of birth: 1975/05/18
Age: 38
Country of nationality: United Kingdom
Address: Switzerland
Number of involvements: 39
Function: Chairman
Level of responsibility: President / Chairman
Appointment date: 2013/05/01
Fullname: Mr. Thomas Just Karberg
Type: Individual
Gender: Male
date of birth: 1964/03/01
Age: 49
Country of nationality: Denmark
Address: Switzerland
Number of involvements: 36
Function: Member of the board
Level of responsibility: Member
Appointment date: 2013/05/01
Fullname: Mrs. Johanna West
Type: Individual
Gender: Female
date of birth: 1971/01/19
Age: 42
Country of nationality: United Kingdom
Address: United Kingdom
Number of involvements: 41
Function: Member of the board
Level of responsibility: Member
Appointment date: 2013/05/01
Fullname: Mrs. Johanna West
Type: Individual
Gender: Female
date of birth: 1971/01/19
Age: 42
Country of nationality: United Kingdom
Address: United Kingdom
Number of involvements: 41
Function: General Manager
Level of responsibility: Highest executive
Appointment date: 2013/05/01
Employees
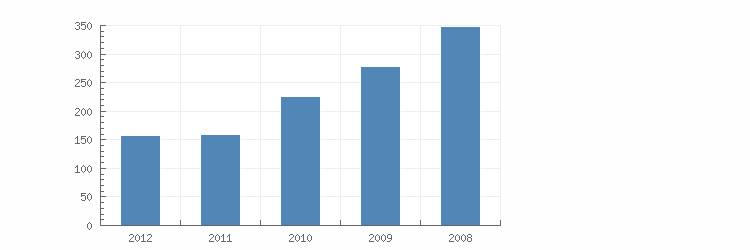
Year 2012 2011 2010 2009 2008
Total 157 160 226 279 349
Financial analysis
Trend Fluctuating
Profitability More than sufficient
Solvability Limited
Liquidity Negative
Show amount in Euro
Key figures
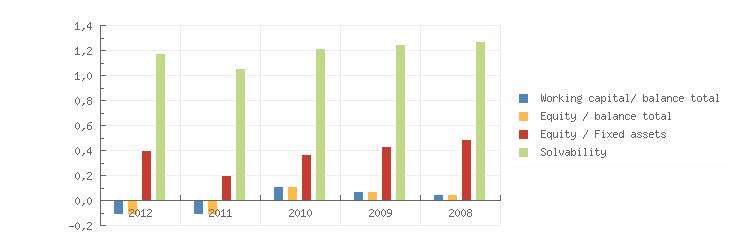
Year 2012 2011 2010 2009 2008
Quick ratio 0,86 0,88 1,22 1,14 1,10
Current ratio 0,86 0,88 1,22 1,14 1,10
Working capital/ balance total -0,11 -0,11 0,11 0,07 0,05
Equity / balance total -0,11 -0,11 0,11 0,07 0,05
Equity / Fixed assets 0,40 0,20 0,37 0,43 0,49
Solvability 1,18 1,06 1,22 1,25 1,27
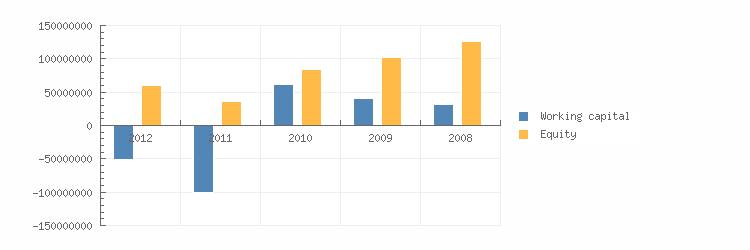
Working capital -51.699.053 -100.324.962 61.434.080 40.982.980 32.231.036
Equity 59.783.973 36.547.960 83.837.965 102.453.035 125.929.988
Mutation equity 63,58 -56,41 -18,17 -18,64
Mutation short term liabilities -54,90 190,21 -2,50 -11,57
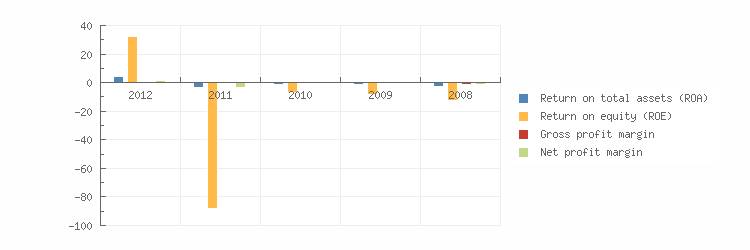
Return on total assets (ROA) 4,11 -3,56 -0,99 -1,50 -2,58
Return on equity (ROE) 32,41 -88,03 -6,75 -8,35 -12,68
Gross profit margin 1,06 0,19 -0,12 0,35 -1,38
Net profit margin 1,33 -3,12 -0,86 -0,92 -1,11
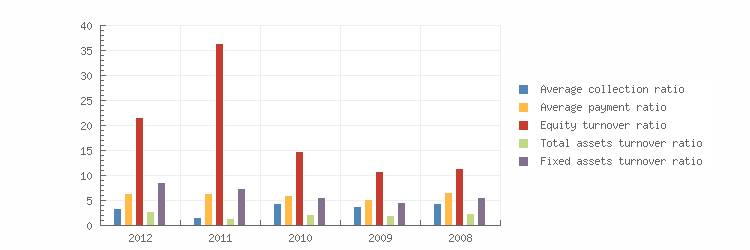
Average collection ratio 3,47 1,61 4,39 3,77 4,34
Average payment ratio 6,47 6,40 5,91 5,14 6,57
Equity turnover ratio 21,60 36,37 14,88 10,72 11,37
Total assets turnover ratio 2,74 1,47 2,19 1,92 2,32
Fixed assets turnover ratio 8,55 7,45 5,55 4,59 5,58
Turnover 1.291.422.959 1.329.424.006 1.247.528.048 1.098.114.983 1.432.155.957
Gross margin 46.245.980 49.841.062 74.333.048 85.949.048 109.600.941
Operating result 13.741.967 2.547.943 -1.517.055 3.839.045 -19.817.018
Net result after taxes 17.116.052 -41.433.065 -10.785.965 -10.147.040 -15.958.006
Cashflow 31.205.031 -26.838.012 3.817.025 4.433.947 -1.679.948
EBITDA 27.830.946 17.142.996 13.085.935 18.420.032 -5.538.959
Summary The 2012 financial
result structure is a negative working captial of -51.699.053 euro, which is in
agreement with -11 % of the total assets of the company.
The working capital has increased with 48.47 % compared to previous year. The
ratio with respect to the total assets of the company remains unchanged.
The improvement between 2011 and 2012 has mainly been caused by a current
liabilities reduction.
The current ratio of the company in 2012 was 0.86. When the current ratio is
below 1.5, the company may have problems meeting its short-term obligations.
The quick ratio in 2012 of the company was 0.86. A company with a Quick Ratio
of less than 1 cannot currently pay back its current liabilities.
The 2011 financial result structure is a negative working captial of
-100.324.962 euro, which is in agreement with -11 % of the total assets of the
company.
The working capital has diminished with -263.31 % compared to previous year.
The ratio, with respect to the total assets of the company has however,
declined.
The deterioration between 2010 and 2011 has mainly been caused by an increase
of the current liabilities.
The current ratio of the company in 2011 was 0.88. When the current ratio is
below 1.5, the company may have problems meeting its short-term obligations.
The quick ratio in 2011 of the company was 0.88. A company with a Quick Ratio
of less than 1 cannot currently pay back its current liabilities.

Financial statement
Auditor Name: DELOITTE
Statsautoriseret Revisionspartnerselskab
Last annual account 2012
Remark annual account The company is
obliged to file its financial statements.
Type of annual account Corporate
Annual account ROHM AND HAAS EUROPE TRADING APS
SORGENFRIVEJ 15
2800 KGS.LYNGBY
Denmark
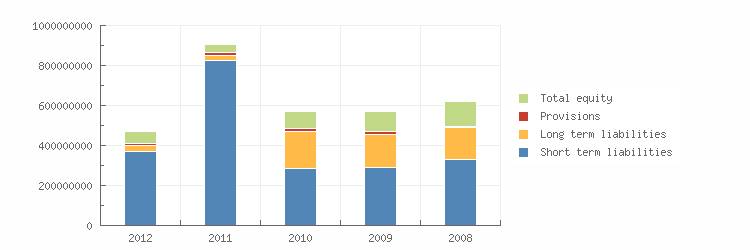
Balance
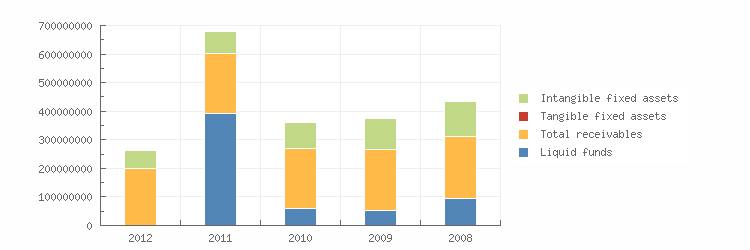
Year 2012 2011 2010 2009 2008
End date 2012-12-31 2011-12-31 2010-12-31 2009-12-31 2008-12-31
Intangible fixed
assets 62.948.994 77.034.054 91.627.000 106.230.022 120.651.940
Tangible fixed
assets 21.027 25.961 33.049 115.022 135.962
Other fixed assets 87.993.939 101.455.946 133.120.943 133.122.059 135.893.018
Fixed assets 150.965.032 178.515.960 224.780.992 239.468.039 256.681.055
Total receivables 199.675.046 207.872.996 211.213.981 213.458.056 218.072.989
Liquid funds 668.040 393.598.040 59.197.009 53.525.009 93.805.002
Current assets 320.226.972 724.415.012 345.625.034 332.453.998 361.850.040
Total assets 471.192.004 902.930.973 570.406.026 571.922.036 618.530.960
Total equity 59.783.973 36.547.960 83.837.965 102.453.035 125.929.988
Provisions 12.845.042 15.897.003 17.416.952 13.595.948 3.996.062
Long term
liabilities 26.636.027 25.746.978 184.960.021 164.402.035 158.986.042
Accounts payable 4.455.967 9.059.040 6.370.993 7.417.954 7.245.963
Short term
liabilities 371.926.025 824.739.974 284.190.954 291.471.018 329.619.004
Total liabilities 471.192.004 902.930.973 570.406.026 571.922.036 618.530.960
Summary The total assets
of the company decreased with -47.82 % between 2011 and 2012.
This total assets decrease has been reflected in a reduction of non current
assets of -15.43 %.
In 2012 the assets of the company were 32.04 % composed of fixed assets and
67.96 % by current assets. The assets are being financed by an equity of 12.69
%, and total debt of 87.31 %.
The total assets of the company increased with 58.3 % between 2010 and 2011.
Despite the assets growth, the non current assets decreased with -20.58 %.
In 2011 the assets of the company were 19.77 % composed of fixed assets and
80.23 % by current assets. The assets are being financed by an equity of 4.05
%, and total debt of 95.95 %.
Profit and loss
Year 2012 2011 2010 2009 2008
Net turnover 1.291.422.959 1.329.424.006 1.247.528.048 1.098.114.983 1.432.155.957
Cost of sales 1.245.176.979 1.279.582.944 1.173.195.000 1.012.165.935 1.322.555.015
Gross margin 46.245.980 49.841.062 74.333.048 85.949.048 109.600.941
Wages and salaries 17.714.985 17.562.003 30.566.987 34.196.039 37.403.034
Amorization and depreciation 14.088.979 14.595.052 14.602.991 14.580.987 14.278.058
Operating expenses 32.504.013 47.293.119 75.850.104 82.110.003 129.417.959
Operating result 13.741.967 2.547.943 -1.517.055 3.839.045 -19.817.018
Financial income 11.009.940 4.538.061 2.226.942 3.177.938 15.594.987
Financial expenses 5.376.063 39.260.950 6.364.063 15.572.981 11.749.979
Financial result 5.634.011 -34.723.024 -4.136.988 -12.395.043 3.845.008
Result on ordinary operations
before taxes 19.375.978 -32.174.946 -5.654.976 -8.555.998 -15.972.010
Taxation on the result of ordinary
activities 2.259.926 9.258.119 5.130.989 1.591.042 -14.004
Result of ordinary activities
after taxes 17.116.052 -41.433.065 -10.785.965 -10.147.040 -15.958.006
Net result 17.116.052 -41.433.065 -10.785.965 -10.147.040 -15.958.006
Summary The turnover of
the company decreased by -2.86 % between 2011 and 2012.
The gross profit of the company decreased by -7.21 % between 2011 and 2012.
The operating result of the company grew with 439.34 % between 2011 and 2012.
This evolution implies an increase of the company's economic profitability.
The result of these changes is an increase of the company's Economic
Profitability of 215.45 % of the analysed period, being equal to 2011 % in the
year 2012.
This growth has contributed to the increase in assets turnover, increasing by
86.39 % reaching 2.74.
The Net Result of the company decreased by 141.31 % between 2011 and 2012.
The company's Financial Profitability has been positively affected by the
financial activities in comparison to the EBITs behaviour. The result of these
variations is a profitability increase of 136.82 % of the analysed period,
being 32.41 % in the year 2012.
The company's financial structure has slowed down its financial profitability.
The turnover of the company grew with 6.56 % between 2010 and 2011.
The gross profit of the company decreased by -32.95 % between 2010 and 2011.
The operating result of the company grew with 267.95 % between 2010 and 2011.
This evolution implies an increase of the company's economic profitability.
The result of these changes is a reduction of the company's Economic
Profitability of -259.6 % of the analysed period, being equal to 2010 % in the
year 2011.
This fall has contributed to a asset turnover decrease, whose index evolved
from -32.88 to a level of 1.47.
The Net Result of the company increased by -284.14 % between 2010 and 2011.
The company's Financial Profitability has been positively affected by the
financial activities in comparison to the EBITs behaviour. The result of these
variations is a profitability increase of -1204.15 % of the analysed period,
being -88.03 % in the year 2011.
The company's financial profitability has been positively affected by its
financial structure.
Publications
Remarks Status: Active
Category: Very large company
Last year: 2012
Turnover last year: 1.291.422.959 EUR
Result last year: 17.116.052 EUR
TOTAL assets last year: 471.192.004 EUR
Number of employees: 157
Number of shareholders: 1
Number of subsidiaries: 10
Number of branches: 0
FOREIGN EXCHANGE RATES
|
Currency |
Unit
|
Indian Rupees |
|
US Dollar |
1 |
Rs.61.11 |
|
|
1 |
Rs.94.77 |
|
Euro |
1 |
Rs.81.54 |
INFORMATION DETAILS
|
Report
Prepared by : |
PRL |
RATING EXPLANATIONS
|
RATING |
STATUS |
PROPOSED CREDIT LINE |
|
|
>86 |
Aaa |
Possesses an extremely sound financial base with the strongest
capability for timely payment of interest and principal sums |
Unlimited |
|
71-85 |
Aa |
Possesses adequate working capital. No caution needed for credit transaction.
It has above average (strong) capability for payment of interest and
principal sums |
Large |
|
56-70 |
A |
Financial & operational base are regarded healthy. General
unfavourable factors will not cause fatal effect. Satisfactory capability for
payment of interest and principal sums |
Fairly Large |
|
41-55 |
Ba |
Overall operation is considered normal. Capable to meet normal
commitments. |
Satisfactory |
|
26-40 |
B |
Capability to overcome financial difficulties seems comparatively below
average. |
Small |
|
11-25 |
Ca |
Adverse factors are apparent. Repayment of interest and principal sums
in default or expected to be in default upon maturity |
Limited with
full security |
|
<10 |
C |
Absolute credit risk exists. Caution needed to be exercised |
Credit not
recommended |
|
-- |
NB |
New Business |
-- |
This score serves as a reference to assess
SC’s credit risk and to set the amount of credit to be extended. It is
calculated from a composite of weighted scores obtained from each of the major
sections of this report. The assessed factors and their relative weights (as
indicated through %) are as follows:
Financial
condition (40%) Ownership
background (20%) Payment
record (10%)
Credit history
(10%) Market trend (10%) Operational size
(10%)
This report is issued at your request without any
risk and responsibility on the part of MIRA INFORM PRIVATE LIMITED (MIPL)
or its officials.