MIRA INFORM REPORT
|
Report Date : |
21.08.2013 |
IDENTIFICATION DETAILS
|
Name : |
INDUSTRIE TEXTILE |
|
|
|
|
Registered Office : |
541 Route de Médiouna, Casablanca |
|
|
|
|
Country : |
Morocco |
|
|
|
|
Financials (as on) : |
31.12.2011 |
|
|
|
|
Date of Incorporation : |
08.06.1977 |
|
|
|
|
Com. Reg. No.: |
35553 |
|
|
|
|
Legal Form : |
Societe Anonyme |
|
|
|
|
Line of Business : |
Preparation and
spinning of textile fibres |
|
|
|
|
No. of Employees : |
1000 |
RATING & COMMENTS
|
MIRA’s Rating : |
B |
|
RATING |
STATUS |
PROPOSED CREDIT LINE |
|
|
26-40 |
B |
Capability to overcome financial difficulties seems comparatively
below average. |
Small |
|
Status : |
Moderate |
|
|
|
|
Payment Behaviour : |
No complaints |
|
|
|
|
Litigation : |
Clear |
NOTES:
Any query related to this report can be made
on e-mail: infodept@mirainform.com
while quoting report number, name and date.
ECGC Country Risk Classification List – March 31st 2013
|
Country Name |
Previous Rating (31.12.2012) |
Current Rating (31.03.2013) |
|
Morocco |
A2 |
A2 |
|
Risk Category |
ECGC
Classification |
|
Insignificant |
A1 |
|
Low |
A2 |
|
Moderate |
B1 |
|
High |
B2 |
|
Very High |
C1 |
|
Restricted |
C2 |
|
Off-credit |
D |
Morocco ECONOMIC OVERVIEW
Morocco has capitalized on its proximity to Europe and relatively low
labor costs to build a diverse, open, market-oriented economy. In the 1980s
Morocco was a heavily indebted country before pursuing austerity measures and
pro-market reforms, overseen by the IMF. Since taking the throne in 1999, King
MOHAMMED VI has presided over a stable economy marked by steady growth, low
inflation, and gradually falling unemployment, although a poor harvest and
economic difficulties in Europe contributed to an economic slowdown in 2012.
Industrial development strategies and infrastructure improvements - most
visibly illustrated by a new port and free trade zone near Tangier - are
improving Morocco's competitiveness. Morocco also seeks to expand its renewable
energy capacity with a goal of making renewable 40% of electricity output by
2020. Key sectors of the economy include agriculture, tourism, phosphates,
textiles, apparel, and subcomponents. To boost exports, Morocco entered into a
bilateral Free Trade Agreement with the United States in 2006 and an Advanced
Status agreement with the European Union in 2008. Despite Morocco's economic
progress, the country suffers from high unemployment, poverty, and illiteracy,
particularly in rural areas. In 2011 and 2012, high prices on fuel - which is
subsidized and almost entirely imported - strained the government''s budget and
widened the country''s current account deficit. Key economic challenges for
Morocco include fighting corruption and reforming the education system, the
judiciary, and the government''s costly subsidy program.
|
Source : CIA |
Company name
INDUSTRIE TEXTILE
Rating Briefing
This rating is based on available data. In the
event of additional information a possibility
for a different rating applies.
Registration Briefing
Registration Number: 35553
Registration Date: 08/06/1977
Legal Form: SOCIETE ANONYME
Latest Financials: December 31, 2011
Financial Briefing
Nominal Capital: 280,000,000 Moroccan
Dirham
Issued Capital: N/A
Turnover: 201,982,838
Moroccan Dirham
Net Loss: 22,666,715
Net Worth: 186,374,461
Moroccan Dirham
Company Details
Company Name: INDUSTRIE TEXTILE
Also trades as: ITEX SA
Headquarter Address: Km 9, Route d'El Jadida,
Zone
Industrielle Lissasfa,
Casablanca,
Morocco
Telephone: +212522
914890
+212522
914891
+212522
914892
+212522
914893
+212522
914894
+212522
914895
+212522
914896
+212522
914897
+212522
914898
Fax: +212522
914756
E‑Mail: itex1@menara.ma
Company was originally started on 08/06/1977
Registration & Legal Details
Current Legal Form: SOCIETE ANONYME
Registration Address: 541 Route de Médiouna,
Casablanca
Registration Number: 35553
Registration Date: 08/06/1977
Year/Date Company Established: 08/06/1977
Registration Town: Casablanca
Tax Registration Number: 02520156
Capital
Currency: Moroccan
Dirham
Authorized Capital: 280,000,000
Paid Up Capital: 280,000,000
Previous Capital amount:
200,000,000
Capital to increase to:
80,000,000
Capital increase on 2010 to 80,000,000
Authorized Capital Breakdown
Number of Shares: 280,000 Type of Shares: None Selected
Issued Shares: 280,000 Value per share: MDH
1,000.00 Value of this type:
280,000,000.00
Shareholders / Owners
Shareholders:
Name/Other
Information Shares
Held % of
Voting/Non‑Voting capital
Mr. Ahmed Jamai
Ghazlani, 152,127 54.33%
(VOTING)
50, Rue du Golf
Comores,
Casablanca,
Morocco
Mrs. Ilham Lahlou,
1,151 0.41%
(VOTING)
50, Rue du Golf
Comores,
Casablanca,
Morocco
Mr. Anas Jamai
Ghazlani, 1,151 0.41%
(VOTING)
50, Rue du Golf
Comores,
Casablanca,
Morocco
Ms. Sara Jamai
Ghazlani, 1,143 0.41%
(VOTING)
50, Rue du Golf
Comores,
Casablanca,
Morocco
Ms. Sofia Jamai
Ghazlani, 1,143 0.41%
(VOTING)
50, Rue du Golf
Comores,
Casablanca,
Morocco
Mr. Ismail Jamai
Ghazlani, 1,143 0.41%
(VOTING)
50, Rue du Golf
Comores,
Casblanca,
Morocco
SOCIETE ANASSI, 85,657 30.59%
(VOTING)
Ahl Loghlam,
Casablanca,
Morocco
SOCIETE MOULAY
ISMAIL, 36,485 13.03%
(VOTING)
541, Avenue
Mohamed VI,
Casablanca,
Morocco
Principals
Name: Mr
Ahmed Jamai Ghazlani
Position within the company: President and chief
executive
Country of Birth: Morocco
Nationality: Moroccan
Can fluently speak: Arabic & French
Name: Mr
Ilham Lahlou
Position within
the company: General
Director
Country of Birth: Morocco
Nationality: Moroccan
Can fluently
speak: Arabic
& French
Name: Mr
Lahcen Maghrab
Position within
the company: Administration
& Financial Director
Country of Birth: Morocco
Nationality: Moroccan
Can fluently
speak: Arabic
& French
Company Activities
NACE Codes: 1310 Preparation
and spinning of textile fibres
ITEX specialises in
spinning, weaving, knitting of textile fibres and clothing manufacture and
export.
Local Reporters consider the investigated company
to be LARGE in their field of concern.
Operations
Employees Company Employs:
1000
HQ Premises Operates from: Owned Offices , Factory, Warehouse
Premises Size: 80000 square
meters
Location: Industrial
Area
Branches Chemin des Dahlias
‑ Beausite,
Ain
Sebaa,
Casablanca,
Morocco
Branch
is: Rented
Description
of branch: Workshop
Imports
Import % and type
of product: 100% Raw
Materials
Imports From: China,
Germany, Italy, Spain, India
Importing Terms: 90 days
credit, bills of exchange
Additional
Information: Letters of
credit
Exports
Export % and type
of product: 60%
Exports To: France,
Spain, Italy
Exporting Terms: 90 days
credit, bank transfer
Additional
Information: Letters
of credit
Trading &
Selling
Territory: 40%
Nationally, 60% International
Type of Customer: Distributors
& Supermarkets
Number of
accounts:
30
Related Companies
Subsidiaries
Affiliates
Information on Related Companies is not
available/applicable
Bankers
Attijariwafa Bank,
Branch: Centre
d'Affaires Mechouar
Place Hamidou El
Watani Angle Rue Bergerac,
Casablanca,
Morocco
Banque Populaire,
Branch: Centre
d'Affaires Moukaouama
131 Boulevard
Moukaouama ‑ex Résistance,
Casablanca,
Morocco
BMCE Bank,
Branch: Centre
d'Affaires Zenith
Lot Attaoufik,
Immeuble Zenith
Millenium N° 2 Bis ‑ Sidi Maarouf,
Casablanca,
Morocco
Financial Information
Source: Companies
Registry
Figures are: Official
Figures
Currency: Moroccan
Dirham
Months Sales Figures Sales Gross
Profit/Loss Net Profit/Loss
12 31/12/2011 201,982,838 (21,954,991) (22,666,715)
12 31/12/2010 154,952,735 (25,333,790) (25,928,862)
12 31/12/2009 140,179,031 (46,786,773) (47,513,541)
12 31/12/2008 175,066,338 (68,763,769) (69,670,289)
Balance Sheet & Profit &
Loss
BALANCE SHEET
As
at: 31‑Dec‑2011 As at: 31‑Dec‑2010 As at:
31‑Dec‑2009
Fixed
Assets
Land & Buildings 46,019,800 48,012,668 51,846,043
Plant & Machinery 49,118,895 44,485,953 52,781,624
Furniture & Equipment 808,336 1,111,610 1,418,841
Motor Vehicles 17,955 40,690 63,425
Misc. Fixed
Assets
Total Fixed Assets 95,964,986 93,650,921 106,109,933
Financial
Assets
Shares in Related Companies 521,497 521,497 521,497
Loans to
related companies
Investments
Deposits
Misc. Financial Assets 223,229 223,229 223,229
Total Financial Assets 744,726 744,726 744,726
Intangibles
Goodwill
Organisational Expenses 596,659 860,679 204,699
Patents
Misc.
Intangible Assets
Total Intangible Assets 596,659 860,679 204,699
Current
Assets
Stock 62,411,975 62,900,485 73,924,763
Stock & Work in Progress 9,043,410 22,626,225 11,910,674
Trade Debtors & receivables 61,430,558 59,912,615 54,537,100
Provision
for bad debs
Other receivables 12,506,167 11,453,066 8,628,445
Due from
related companies
Owed by
shareholders
Prepaid expenses 103,291 271,692 6,331
Cash 46,190,888 65,089,138 6,496,774
Tax recoverable 6,097,145 5,508,412 4,484,438
Marketable
Securities
Misc. Current Assets 474,748 3,167,757 1,291,703
Total Current Assets 198,258,182 230,929,390 161,280,228
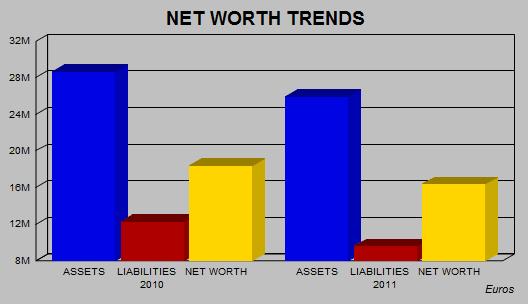
Total Assets 295,564,553 326,185,716 268,339,586
Owner's
Equity & Liabilities
Issued and paid up capital 280,000,000 280,000,000 200,000,000
Share
premium account
Retained earnings ‑73,896,374 ‑47,967,512 ‑453,971
Net profit/Loss for the year ‑22,666,715 ‑25,928,862 ‑47,513,541
Revaluation
reserves
Legal Reserves 2,000,000 2,000,000 2,000,000
Other reserves 937,550 937,550 937,550
Net Worth 186,374,461 209,041,176 154,970,038
Deffered
Taxation
Provisions/allowances
Mortgages/Loans 605,117 3,871,951 7,993,081
Hire
purchase
Due to group
of companies
Minority
interest
Misc.
deferred liabilities
Total Long Term Liabilities 605,117 3,871,951 7,993,081
Current
Liabilities
Creditors 42,874,408 45,032,627 29,436,805
Other
creditors
Accruals 1,552,045 1,656,884 1,494,285
Bank overdrafts/Loans 62,258,464 64,364,953 64,287,329
Misc. Loans
Directors
accounts
Owing to shareholders 312,458 340,624 7,627,557
Owing to
related companies
Proposed
dividend
Long Term‑due
1 year
Hire
Purchase‑under 1 year
Taxation 146,832 28,761 468,645
Advance
receipts
Misc. Current Liabilities 1,440,768 1,848,740 2,061,846
Total Current Liabilities 108,584,975 113,272,589 105,376,467
Owner's Equity & Liabilities 295,564,553 326,185,716 268,339,586
PROFIT & LOSS
Figures
are: Figures
are: Figures
are:
Fiscal
Year Fiscal
Year Fiscal
Year
01/01/2011
to 31/12/2011 01/01/2010 to
31/12/2010 01/01/2009 to
31/12/2009
Total Income/Turnover 201,982,838 154,952,735 140,179,031
Cost of
sales
Gross Profit/(Loss) 201,982,838 154,952,735 140,179,031
Admin/selling expenses 128,109,905 78,201,893 83,546,986
Services 10,137,019 10,953,950 11,745,810
Salaries 41,679,810 40,202,033 38,674,718
Auditors Fee 816,687 103,293 914,603
Stock Depreciation ‑12,327,693 6,841,159 ‑5,373,960
Depreciation 10,192,945 15,684,720 15,227,341
Misc.
Operating Expenses 413,829
Misc. Operating Income 3,352,746 4,061,760 3,739,770
Net Operating Profit/(Loss) 26,726,911 7,027,447 ‑1,230,526
Interest Receivable/Finance Income 50,328 25,130 45,041
Group related income 18,350 500,310
Misc. Financial Income 3,460,963 8,696,766 1,825,666
Total Financial Income 3,529,641 9,222,206 1,870,707
Interest Payable/Finance costs 4,530,280 4,486,761 5,023,109
Misc. financial expenses 47,681,263 37,096,682 42,403,845
Total Financial Expenses 52,211,543 41,583,443 47,426,954
Profit/(Loss) before taxes ‑21,954,991 ‑25,333,790 ‑46,786,773
Income Tax 711,724 595,072 726,768
Other Tax
Profit/(Loss) after taxes ‑22,666,715 ‑25,928,862 ‑47,513,541
Extraordinary
items
Exceptional
items
Misc. Items
Net Profit/(Loss) ‑22,666,715 ‑25,928,862 ‑47,513,541
Previous
years retained earnings
Current
years net income
Misc.
additions in current year
Current years net loss ‑22,666,715 ‑25,928,862 ‑47,513,541
Dividends in
current year
Withdrawals
in current year
Misc.
deductions in current year
Retained earnings at end of ‑22,666,715 ‑25,928,862 ‑47,513,541
financial
period
Average
employees
Directors
fee
Earnings per
share
Earnings per
share‑previous year
Auditors Comments
Date accounts obtained: 15/08/2013
Accounts obtained from: Companies registry
Auditors Opinion: The audited
financial statement gives a true and fair view of the state of affairs
of the subject
Financial
Statements have been prepared on an on‑going basis.
Assuming
support of: shareholders
FINANCIAL RATIOS / COMPARATIVE DATA
Actual
Company Industrial Averages Actual Company Industrial Averages
Results
(2011) (2011) Results (2010) (2010)
Liquidity
Ratios
Current Ratio 1.83 1.64 2.04 1.49
Acid Test Ratio 1.17 1.07 1.28 0.98
Accounts 0.21 0.39 0.29 0.67
Payable/Sales
Ratio
Current Liabilities/Net 0.58 1.54 0.54 3.15
Worth
Current 1.52 2.66 1.32 3.09
Liabilities/Inventory
Total Liabilities/Net 0.59 1.65 0.56 3.39
Worth
Fixed Assets/Net 51.49 38.93 44.80 18.54
Worth (%)
Profitability
Ratios
Gross Profit Ratio (%) 100.00 91.95 100.00 93.45
Return on Capital ‑11.74 12.58 ‑11.90 ‑22.50
Employed
(ROCE)(%)
Net Profit/Sales (%) ‑10.87 ‑6.13 ‑16.35 ‑13.23
Return on Assets (%) ‑7.43 3.95 ‑7.77 3.63
Efficiency
Ratios
Sales/Working Capital 2.25 120.96 1.32 13.17
Assets/Sales(%) 146.33 183.07 210.51 245.51
Shareholders ‑11.78 19.91 ‑12.12 ‑21.99
Return(%)
Average Collection 109.64 108.80 134.80 117.42
Period
Sales/Inventory 2.83 6.26 1.81 5.96
Leverage
Ratios
Capital Employed 1.09 4.41 0.74 5.54
Capital Structure (%) 0.32 34.10 1.82 26.48
Number of 400 400
Companies
within the
industry
(NACE C)
Statistics
based on Manufacturing Manufacturing
NACE(C)
The statistical Industrial Average results are calculated against companies within the database for the specific country.
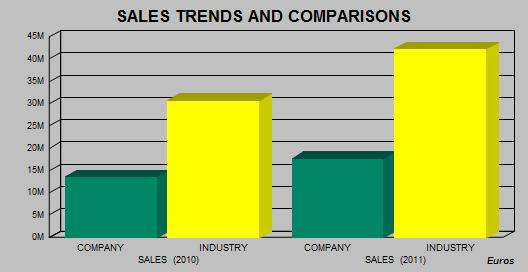
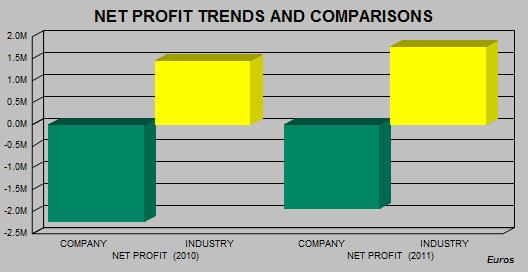
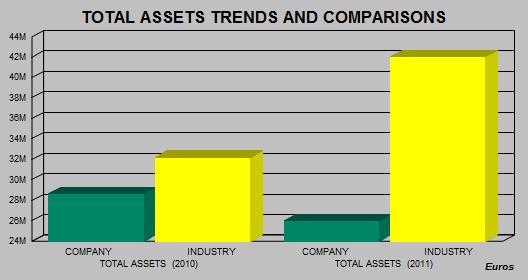
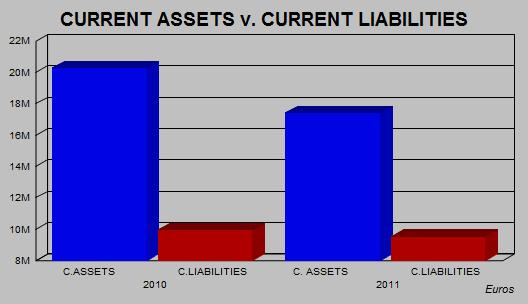
INDUSTRY SECTOR COMPARATIVE DATA
Elements Taken Result for specific RANKING Total Companies Used
company
DATE OF REGISTRATION 08/06/1977 312 863
TOTAL EMPLOYEES 1,000 40 832
SALES (2011) 17,758,331 75 283
SALES (2010) 13,623,444 112 378
NET PROFIT (2011) ‑1,930,283 259 267
NET PROFIT (2010) ‑2,227,347 376 385
TOTAL ASSETS (2011) 25,986,035 66 267
TOTAL ASSETS (2010) 28,678,248 78 389
Currency:
EUROS
Rankings:
The results given below are calculated against companies with the Database for the specific country.
Scale: 1 is the highest result found in our database.
Example: Ranking 5: Total Companies used to generate the Ranking : 20
This means that this company is the 5th largest company out of 20 found in our database in the specific industry
Charts of Financial Trends and Industry Comparisons
PLEASE NOTE THAT CHARTS ARE SHOWN IN EUROS
FOR TREND AND COMPARISON PURPOSES
The statistical Industrial Average results are
calculated against companies within the database for the
specific country.
Payments
Subject's payments reported to be: UNDETERMINED
Representation
Other Comments
Other Comments: Patent N° : 33608151
Interview & Reporter Comments
Name/Title: Mr.
Lahcen Maghrab Financial Director
Comment: We
have been unable to contact a company official.
Reporter Comment: All legal forms in Morocco are obliged by law to be registered with the Registry Office (OMPIC: Office Marocain de la Propriete Industrielle et Commerciale) which is publicly available.
Subject was found registered and Information obtained from above official source is as follows :
Registered name / registration number / date of registration / registered address / legal form / capital / main principals – administrators / shareholders / shareholders % / financial information.
According to the Casablanca Commercial Court, the company capital is : 160,000,000.00 MAD.
Any other data stated in the report was obtained directly from the subject company and/or other publicly available information. Therefore it should be used as a point of reference as it is not possible to verify such data with official sources.
Note that the company is registered as : " INDUSTRIE TEXTILE "
The address mentioned in the enquiry : " 541, Route de Mediouna, Casablanca " is the registration address of the subject company.
We contacted the subject, they confirmed that Mr. Lahcen Maghrab, Financial Director, who can submit information is on leave.
The above mentioned information is from a previous report on 17/12/2012.
Conclusions
Local Reputation: The company being investigated
is believed by local reporters to be a Medium
Trade
Risk.
Owner/Shareholders Comments: Some of the owners /
shareholders have an active participation in the running
of
the business.
Financial Results Trend: Financial
Information indicates that the business activities of the company are
showing
an upward turn.
Age of Business: The company is a long
established family run business.
FOREIGN EXCHANGE RATES
|
Currency |
Unit
|
Indian Rupees |
|
US Dollar |
1 |
Rs.63.73 |
|
UK Pound |
1 |
Rs.99.79 |
|
Euro |
1 |
Rs.85.07 |
INFORMATION DETAILS
|
Report Prepared
by : |
MNL |
RATING EXPLANATIONS
|
RATING |
STATUS |
PROPOSED CREDIT LINE |
|
|
>86 |
Aaa |
Possesses an extremely sound financial base with the strongest
capability for timely payment of interest and principal sums |
Unlimited |
|
71-85 |
Aa |
Possesses adequate working capital. No caution needed for credit transaction.
It has above average (strong) capability for payment of interest and
principal sums |
Large |
|
56-70 |
A |
Financial & operational base are regarded healthy. General
unfavourable factors will not cause fatal effect. Satisfactory capability for
payment of interest and principal sums |
Fairly Large |
|
41-55 |
Ba |
Overall operation is considered normal. Capable to meet normal
commitments. |
Satisfactory |
|
26-40 |
B |
Capability to overcome financial difficulties seems comparatively below
average. |
Small |
|
11-25 |
Ca |
Adverse factors are apparent. Repayment of interest and principal sums
in default or expected to be in default upon maturity |
Limited with
full security |
|
<10 |
C |
Absolute credit risk exists. Caution needed to be exercised |
Credit not
recommended |
|
---- |
NB |
New Business |
---- |
This score serves as a reference to assess
SC’s credit risk and to set the amount of credit to be extended. It is
calculated from a composite of weighted scores obtained from each of the major
sections of this report. The assessed factors and their relative weights (as
indicated through %) are as follows:
Financial
condition (40%) Ownership
background (20%) Payment
record (10%)
Credit history
(10%) Market trend (10%) Operational size
(10%)
This report is issued at your request without any
risk and responsibility on the part of MIRA INFORM PRIVATE LIMITED (MIPL)
or its officials.