MIRA INFORM REPORT
|
Report Date : |
24.08.2013 |
IDENTIFICATION DETAILS
|
Name : |
AKZO
NOBEL COATINGS LTD |
|
|
|
|
Formerly Known As : |
METROPOLITAN PAINT
FACTORY CO., LTD |
|
|
|
|
Registered Office : |
34 Moo 4, Petchkasem
Rd., KM. 28.5,
Omyai, Sampran, Nakornpathom 73160 |
|
|
|
|
Country : |
Thailand |
|
|
|
|
Financials (as on) : |
31.12.2012 |
|
|
|
|
Date of Incorporation : |
22.10.1963 |
|
|
|
|
Com. Reg. No.: |
0105506002130 |
|
|
|
|
Legal Form : |
Private Limited Company |
|
|
|
|
Line of Business : |
Manufacturer of industrial paints and
coating products, including
varnishing oil &
lacquer for automobile,
furniture, structural steel
and general industries,
as well as
interior decorative paints. |
|
|
|
|
No. of Employees : |
480 |
RATING & COMMENTS
|
MIRA’s Rating : |
Ba |
|
RATING |
STATUS |
PROPOSED CREDIT LINE |
|
|
41-55 |
Ba |
Overall operation is considered normal. Capable to meet
normal commitments. |
Satisfactory |
|
Status : |
Satisfactory |
|
Payment Behaviour : |
Regular |
|
Litigation : |
Clear |
NOTES
:
Any query related to this report
can be made on e-mail: infodept@mirainform.com while quoting report
number, name and date.
ECGC Country Risk Classification List – March 31st,
2013
|
Country Name |
Previous Rating (31.12.2012) |
Current Rating (31.03.2013) |
|
Thailand |
B1 |
B1 |
|
Risk Category |
ECGC
Classification |
|
Insignificant |
A1 |
|
Low |
A2 |
|
Moderate |
B1 |
|
High |
B2 |
|
Very High |
C1 |
|
Restricted |
C2 |
|
Off-credit |
D |
THAILAND - ECONOMIC OVERVIEW
With a well-developed infrastructure, a free-enterprise economy,
generally pro-investment policies, and strong export industries, Thailand
achieved steady growth due largely to industrial and agriculture exports -
mostly electronics, agricultural commodities, automobiles and parts, and
processed foods. Thailand is trying to maintain growth by encouraging domestic
consumption and public investment to offset weak exports in 2012. Unemployment,
at less than 1% of the labor force, stands as one of the lowest levels in the
world, which puts upward pressure on wages in some industries. Thailand also
attracts nearly 2.5 million migrant workers from neighboring countries. The
Thai government is implementing a nation-wide 300 baht ($10) per day minimum
wage policy and deploying new tax reforms designed to lower rates on
middle-income earners. The Thai economy has weathered internal and external
economic shocks in recent years. The global economic crisis severely cut
Thailand's exports, with most sectors experiencing double-digit drops. In 2009,
the economy contracted 2.3%. However, in 2010, Thailand's economy expanded
7.8%, its fastest pace since 1995, as exports rebounded. In late 2011 growth
was interrupted by historic flooding in the industrial areas in Bangkok and its
five surrounding provinces, crippling the manufacturing sector. Industry
recovered from the second quarter of 2012 onward with GDP growth at 5.5% in
2012. The government has approved flood mitigation projects worth $11.7
billion, which were started in 2012, to prevent similar economic damage, and an
additional $75 billion for infrastructure over the next seven years with a plan
to start in 2013.
|
Source : CIA |
Company name
AKZO NOBEL COATINGS LTD.
SUMMARY
BUSINESS
ADDRESS : 34
MOO 4, PETCHKASEM
ROAD,
KM. 28.5,
OMYAI, SAMPRAN,
NAKORNPATHOM 73160,
THAILAND
TELEPHONE : [66] 2429-0031,
2429-0507, 2812-7110
FAX : [66] 2429-0463
E-MAIL
ADDESS : narongchai.kaptum@akzonobel.com
REGISTRATION
ADDRESS : SAME
AS BUSINESS ADDRESS
ESTABLISHED
: 1963
REGISTRATION
NO. : 0105506002130
[Former : 288/2506]
TAX
ID NO. : 3101055092
CAPITAL REGISTERED : BHT.
59,993,000
CAPITAL PAID-UP : BHT.
59,993,000
SHAREHOLDER’S PROPORTION : DUTCH :
100%
FISCAL YEAR CLOSING DATE : DECEMBER
31
LEGAL
STATUS : PRIVATE
LIMITED COMPANY
EXECUTIVE : MR.
ANAWAT CHAKRANONT, THAI
GENERAL MANAGER
NO.
OF STAFF : 480
LINES
OF BUSINESS : INDUSTRIAL
PAINTS AND COATING
PRODUCTS
MANUFACTURER AND
DISTRIBUTOR
CORPORATE PROFILE
OPERATING
TREND : STABLE
PRESENT
SITUATION : OPERATING NORMALLY
REPUTATION : GOOD WITH
NORMAL BUSINESS ENGAGEMENT
MANAGEMENT
STANDARD : MANAGEMENT WITH
GOOD PERFORMANCE
HISTORY
The subject was
established on October
22, 1963 as
a private limited
company under the registered
name Metropolitan Paint
Factory Co., Ltd. by
Dutch groups.
On December 4,
1987 subject’s name was
changed to Akzo
Coatings [Thailand] Ltd. and
finally changed to Akzo
Nobel Coatings Ltd., on
June 20, 1994.
It currently employs
approximately 480 staff.
The subject is
a subsidiary of
Akzo Nobel Coatings
International B.V., in
the Netherlands, and
also a member
of Akzo Nobel
Group of companies.
The subject’s registered
address is 34 Moo
4, Petchkasem Rd., KM.
28.5, Omyai, Sampran,
Nakornpathom 73160, and
this is the
subject’s current operation
address.
THE BOARD
OF DIRECTORS
|
Name |
|
Nationality |
Age |
|
|
|
|
|
|
Mr. Neil Galloway |
|
New Zealander |
59 |
|
Ms. Patchara Thongprapai |
|
Thai |
50 |
|
Mr. Anawat Chakranont |
|
Thai |
49 |
AUTHORIZED PERSON
Two of the
above directors can
jointly sign on
behalf of the
subject with company’s
affixed.
MANAGEMENT
Mr. Anawat Chakranont is the
General Manager.
He is Thai
nationality with the
age of 49
years old.
Ms. Patchara Thongprapai is
the Finance and
Account Manager.
She is Thai
nationality with the
age of 50
years old.
Mr. Taveesak Vuthipornphan is
the Factory Manager.
He is Thai
nationality.
BUSINESS OPERATIONS
The subject’s activity
is a manufacturer of industrial
paints and coating products,
including varnishing oil
& lacquer for
automobile, furniture, structural
steel and general
industries, as well
as interior decorative
paints.
MAJOR BRANDS
“AKZO NOBEL”, “SIKKENS”
and “RELIANCE”
PURCHASE
70% of its raw
materials mainly chemical
are purchased locally,
and the remaining
30% is imported
from Germany, Netherlands, India,
Republic of China, United Kingdom, Taiwan and
Japan.
MAJOR SUPPLIERS
Akzo Nobel Coating
BV. : Netherlands
Akzo Nobel NV. : Netherlands
SALES [LOCAL]
100% of the products is
sold locally to
wholesalers.
PARENT COMPANY
Akzo Nobel Coatings
International B.V. :
Netherlands
OVERSEAS BRANCHES
There are Akzo
Nobel Group of
companies in more
than 75 countries
worldwide.
RELATED/AFFILIATED COMPANIES
Inter Vet Co.,
Ltd.
Business Type : Distributor
of health products
Eka Chemical Co.,
Ltd.
Business Type : Manufacturer
of paper chemical
Akzo Nobel Coatings
Paints [Thailand] Co., Ltd.
Business Type : Manufacturer
and distributor of
paints and coating
products
LITIGATION
Bankruptcy and Receivership
There are no
litigation on bankruptcy
and receivership cases
filed against the
subject found at
Legal Execution Department
for the past
five years.
Others
There are no
legal suits filed
against the subject
according to the
past two years.
CREDIT
Sales are by
cash or on
the credits term
of 30-60 days.
Local bills are
paid by cash
or on the
credits term of
30-60 days.
Imports are by
L/C at sight & T/T.
BANKING
Kasikornbank Public Co., Ltd.
[Head Office : 1 Kasikorn Lane,
Rajburana Rd., Rajburana,
Bangkok 10140]
Bangkok Bank Public
Co., Ltd.
[Head Office : 333 Silom
Rd., Silom, Bangrak,
Bangkok 10500]
The Siam Commercial
Bank Public Co.,
Ltd.
[Omyai Branch,
Petchkasem Rd., Omyai,
Sampran, Nakornpathom]
EMPLOYMENT
The subject employs
approximately 480 staff
[office staff and
factory workers].
LOCATION DETAILS
The premise is
owned for administrative office, factory I and
warehouse at the
heading address. Premise
is located in
an industrial area.
Factory II is
located at 2
Soi G9, Pakornsongkrohraj Rd.,
T. Mabtaphut, A. Muang, Rayong
21150.
Branch office is
located at Room
A, 12th Floor,
Pairoj Kijja Building,
400 Moo 11,
Bangna-Trad Rd., Bangna,
Bangkok 10260.
COMMENT
The
subject was formed
in 1963 as
a manufacturer and
distributor of industrial
coating and lacquer for
industrial users. Strong growth of industrial sector has resulted with consistently increased
of paints and coating products, aided
by the continuous expansion of
the economy and
industry.
Subject
reported good sales
in 2012. However,
sale has slightly
declined since the second
quarter of the year 2013.
FINANCIAL INFORMATION
The capital was
registered at Bht.
10 million, divided
into 10,000 shares
of Bht. 1,000
each.
The capital was
increased later as
followings :
Bht. 30,000,000
on October 5,
1983
Bht. 60,000,000
on September 2,
1985
On December 21, 2011, the
registered capital was
decreased to Bht. 59,993,000, divided into
59,993 shares of
Bht. 1,000 each
with fully paid.
THE SHAREHOLDERS
LISTED WERE
[as
at April 30,
2013]
|
NAME |
HOLDING |
% |
|
|
|
|
|
Akzo Nobel Coatings
International B.V. Nationality: Dutch Address : Velperweg 79
6824 BM Arnhem,
Netherlands |
57,035 |
95.07 |
|
Panter B.V. Nationality : Dutch Address : Rijksstraatweg 31
2171 AJ Sassenheim, Netherlands |
2,957 |
4.93 |
|
Akzo Nobel [C]
Holdings B.V. Nationality: Dutch Address : Velperweg 79
6824 BM Arnhem, Netherlands |
1 |
- |
Total Shareholders : 3
Share Structure [as
at April 30,
2013]
|
Nationality |
Shareholders |
No. of Share |
% Shares |
|
|
|
|
|
|
Thai |
- |
- |
- |
|
Foreign-Dutch |
3 |
59,993 |
100.00 |
|
Total |
3 |
59,993 |
100.00 |
NAME OF AUDITOR
& CERTIFIED PUBLIC
ACCOUNTANT NO.:
Mr. Sathien Wongsanan No.
3495
BALANCE SHEET [BAHT]
The latest financial figures published
as at December
31, 2012, 2011
& 2010 were:
ASSETS
|
Current Assets |
2012 |
2011 |
2010 [Adjusted] |
|
|
|
|
|
|
Cash and Cash Equivalents |
356,377,862.53 |
288,737,919.73 |
707,685,382.60 |
|
Trade Accounts & Other Receivable |
181,014,292.52 |
173,458,731.51 |
124,190,164.96 |
|
Deferred Dividend |
- |
59,280,000.00 |
- |
|
Short-term Loan and Deferred Interest to Related Company |
- |
1,110,477,779.02 |
563,499,142.04 |
|
Inventories |
80,218,430.00 |
109,740,153.90 |
49,459,244.36 |
|
|
|
|
|
|
Total Current Assets
|
617,610,585.05 |
1,741,694,584.16 |
1,444,833,933.96 |
|
Investment in Associated
Company |
61,750.00 |
61,750.00 |
61,750.00 |
|
Fixed Assets |
32,680,238.75 |
27,471,146.59 |
29,168,342.61 |
|
Deposit |
678,242.99 |
844,480.49 |
851,092.64 |
|
Total Assets |
651,030,816.79 |
1,770,071,961.24 |
1,474,915,119.21 |
LIABILITIES &
SHAREHOLDERS’ EQUITY [BAHT]
|
Current
Liabilities |
2012 |
2011 |
2010 [Adjusted] |
|
|
|
|
|
|
Trade Accounts & Other
Payable |
440,937,150.51 |
399,939,470.43 |
320,988,445.19 |
|
Accrued Income Tax |
19,756,907.46 |
11,110,061.26 |
10,301,416.34 |
|
Short-term Estimated Liabilities |
9,062,728.76 |
7,928,540.07 |
12,074,595.43 |
|
|
|
|
|
|
Total Current Liabilities |
469,756,786.73 |
418,978,071.76 |
343,364,456.96 |
|
|
|
|
|
|
Employee Benefits Obligation |
35,444,537.00 |
35,160,400.00 |
32,523,000.00 |
|
Total Liabilities |
505,201,323.73 |
454,138,471.76 |
375,887,456.96 |
|
|
|
|
|
|
Shareholders' Equity |
|
|
|
|
|
|
|
|
|
Share capital : Baht 1,000
par value authorized, issued
and fully paid share
capital 59,993 shares
in 2012 & 2011; &
60,000 shares in 2010 respectively |
59,993,000.00 |
59,993,000.00 |
60,000,000.00 |
|
|
|
|
|
|
Capital Paid |
59,993,000.00 |
59,993,000.00 |
60,000,000.00 |
|
Retained Earnings Appropriated Statutory Reserve |
5,999,300.00 |
- |
- |
|
Unappropriated |
79,837,193.06 |
1,255,940,489.48 |
1,039,027,662.25 |
|
Total Shareholders' Equity |
145,829,493.06 |
1,315,933,489.48 |
1,099,027,662.25 |
|
Total Liabilities & Shareholders' Equity |
651,030,816.78 |
1,770,071,961.24 |
1,474,915,119.21 |
PROFIT &
LOSS ACCOUNT
|
Revenue |
2012 |
2011 |
2010 [Adjusted] |
|
|
|
|
|
|
Sales Income |
895,872,422.90 |
780,509,238.59 |
721,693,262.85 |
|
Other Income |
|
|
|
|
Interest Income |
9,456,343.83 |
27,591,912.12 |
16,812,163.10 |
|
Dividend Income |
9,731,800.00 |
118,560,000.00 |
- |
|
Others |
6,685,720.13 |
11,339,948.93 |
20,589,751.97 |
|
Total Revenues |
921,746,286.86 |
938,001,099.64 |
759,095,177.92 |
|
Expenses |
|
|
|
|
|
|
|
|
|
Cost of Goods
Sold |
517,146,227.53 |
461,046,513.84 |
415,757,723.50 |
|
Selling Expenses |
120,700,434.37 |
88,930,298.41 |
83,261,698.87 |
|
Administrative Expenses |
98,452,904.38 |
127,349,746.15 |
102,834,841.78 |
|
Loss on Exchange Rate |
- |
- |
1,024,683.01 |
|
Total Expenses |
736,299,566.28 |
677,326,558.40 |
602,878,947.16 |
|
|
|
|
|
|
Profit / [Loss] before
Financial Cost & Income
Tax |
185,446,720.58 |
260,674,541.24 |
156,216,230.76 |
|
Financial Costs |
- |
- |
[8,545.66] |
|
Profit before Income
Tax |
185,446,720.58 |
260,674,541.24 |
156,207,685.10 |
|
Income Tax |
[41,704,017.00] |
[43,761,714.01] |
[42,894,710.06] |
|
|
|
|
|
|
Net Profit / [Loss] |
143,742,703.58 |
216,912,827.23 |
113,312,975.04 |
FINANCIAL ANALYSIS
|
ITEM |
UNIT |
2012 |
2011 |
2010 |
|
|
|
|
|
|
|
LIQUIDITY RATIO |
|
|
|
|
|
CURRENT RATIO |
TIMES |
1.31 |
4.16 |
4.21 |
|
QUICK RATIO |
TIMES |
1.14 |
3.90 |
4.06 |
|
|
|
|
|
|
|
ACTIVITY RATIO |
|
|
|
|
|
FIXED ASSETS TURNOVER |
TIMES |
27.41 |
28.41 |
24.74 |
|
TOTAL ASSETS TURNOVER |
TIMES |
1.38 |
0.44 |
0.49 |
|
INVENTORY CONVERSION PERIOD |
DAYS |
56.62 |
86.88 |
43.42 |
|
INVENTORY TURNOVER |
TIMES |
6.45 |
4.20 |
8.41 |
|
RECEIVABLES CONVERSION PERIOD |
DAYS |
73.75 |
81.12 |
62.81 |
|
RECEIVABLES TURNOVER |
TIMES |
4.95 |
4.50 |
5.81 |
|
PAYABLES CONVERSION PERIOD |
DAYS |
311.21 |
316.62 |
281.80 |
|
CASH CONVERSION CYCLE |
DAYS |
(180.84) |
(148.63) |
(175.57) |
|
|
|
|
|
|
|
PROFITABILITY RATIO |
|
|
|
|
|
COST OF GOODS SOLD |
% |
57.73 |
59.07 |
57.61 |
|
SELLING & ADMINISTRATION |
% |
24.46 |
27.71 |
25.79 |
|
INTEREST |
% |
- |
- |
0.00 |
|
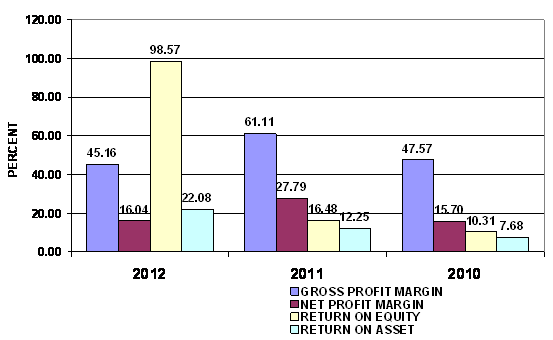
GROSS PROFIT MARGIN |
% |
45.16 |
61.11 |
47.57 |
|
NET PROFIT MARGIN BEFORE EX. ITEM |
% |
20.70 |
33.40 |
21.65 |
|
NET PROFIT MARGIN |
% |
16.04 |
27.79 |
15.70 |
|
RETURN ON EQUITY |
% |
98.57 |
16.48 |
10.31 |
|
RETURN ON ASSET |
% |
22.08 |
12.25 |
7.68 |
|
EARNING PER SHARE |
BAHT |
2,395.99 |
3,615.64 |
1,888.55 |
|
|
|
|
|
|
|
LEVERAGE RATIO |
|
|
|
|
|
DEBT RATIO |
TIMES |
0.78 |
0.26 |
0.25 |
|
DEBT TO EQUITY RATIO |
TIMES |
3.46 |
0.35 |
0.34 |
|
TIME INTEREST EARNED |
TIMES |
- |
- |
18,280.18 |
|
|
|
|
|
|
|
ANNUAL GROWTH |
|
|
|
|
|
SALES GROWTH |
% |
14.78 |
8.15 |
|
|
OPERATING PROFIT |
% |
(28.86) |
66.87 |
|
|
NET PROFIT |
% |
(33.73) |
91.43 |
|
|
FIXED ASSETS |
% |
18.96 |
(5.82) |
|
|
TOTAL ASSETS |
% |
(63.22) |
20.01 |
|
ANNUAL GROWTH :
ACCEPTABLE
An annual sales growth is 14.78%. Turnover has increased from THB
780,509,238.59 in 2011 to THB 895,872,422.90 in 2012. While net profit has
decreased from THB 216,912,827.23 in 2011 to THB 143,742,703.58 in 2012. And
total assets has decreased from THB 1,770,071,961.24 in 2011 to THB
651,030,816.79 in 2012.
PROFITABILITY :
IMPRESSIVE
PROFITABILITY
RATIO
|
Gross Profit Margin |
45.16 |
Acceptable |
Industrial
Average |
65.90 |
|
Net Profit Margin |
16.04 |
Impressive |
Industrial
Average |
3.84 |
|
Return on Assets |
22.08 |
Impressive |
Industrial
Average |
4.93 |
|
Return on Equity |
98.57 |
Impressive |
Industrial
Average |
10.12 |
Gross Profit Margin used to assess a firm's financial health by revealing
the proportion of money left over from revenues after accounting for the cost
of goods sold. Gross profit margin serves as the source for paying additional
expenses and future savings. The company's figure is 45.16%. When compared with
the industry average, the ratio of the company was lower. This indicated that
company may have problems with control over its costs.
Net Profit Margin is the indicator of the company's efficiency in that
net profit takes into consideration all expenses of the company. A low profit
margin indicates a low margin of safety, higher risk that a decline in sales
will erase profits and result in a net loss. The company's figure is 16.04%,
higher figure when compared with those of its average competitors in the same
industry, indicated that business was an efficient operator in a dominant position within its industry.
Return on Assets measures how efficiently profits are being generated
from the assets employed in the business when compared with the ratios of firms
in a similar business. A low ratio in comparison with industry averages
indicates an inefficient use of business assets. Return on Assets ratio is
22.08%, higher figure when compared with those of its average competitors in
the same industry, indicated that business was an efficient profit in a dominant position within its industry.
Return on Equity indicates how profitable a company is by comparing its
net income to its average shareholders' equity, ROE measures how much the shareholders
earned for their investment in the company. Return on Equity ratio is 98.57%,
higher figure when compared with those of its average competitors in the same
industry, indicated that business was an efficient profit in a dominant position within its industry.
Trend of the
average competitors in the same industry for last 5 years
Return on Assets Uptrend
Return on Equity Downtrend
LIQUIDITY :
SATISFACTORY

LIQUIDITY RATIO
|
Current Ratio |
1.31 |
Satisfactory |
Industrial
Average |
1.66 |
|
Quick Ratio |
1.14 |
|
|
|
|
Cash Conversion Cycle |
(180.84) |
|
|
|
The Current Ratio is to ascertain whether a company's short-term assets
are readily available to pay off its short-term liabilities. The company's figure
is 1.31 times in 2012, decreased from 4.16 times, then it is generally
considered to have good short-term financial strength. When compared with the
industry average, the ratio of the company was lower.
The Quick Ratio is a liquidity indicator that further refines the
current ratio by measuring the amount of the most liquid current assets there
are to cover current liabilities. The company's figure is 1.14 times in 2012,
decreased from 3.9 times, although excluding inventory so the company still have
good short-term financial strength.
The Cash Conversion Cycle measures the number of days a company's cash
is tied up in the production and sales process of its operations and the
benefit from payment terms from its creditors. It meant the company could
survive when no cash inflow was received from sale for -181 days.
Trend of the
average competitors in the same industry for last 5 years
Current Ratio Uptrend
LEVERAGE : RISKY


LEVERAGE RATIO
|
Debt Ratio |
0.78 |
Acceptable |
Industrial Average |
0.50 |
|
Debt to Equity Ratio |
3.46 |
Risky |
Industrial
Average |
0.99 |
|
Times Interest Earned |
- |
|
Industrial
Average |
2.03 |
Debt to Equity Ratio a measurement of how much suppliers, lenders, creditors
and obligors have committed to the company versus what the shareholders have
committed. A lower the percentage means that the company is using less leverage
and has a stronger equity position.
Debt Ratio shows the proportion of a company's assets which are financed
through debt. The company's figure is 0.78 greater than 0.5, most of the
company's assets are financed through debt.
Trend of the
average competitors in the same industry for last 5 years
Debt Ratio Downtrend
Times Interest Earned Downtrend
ACTIVITY :
EXCELLENT

ACTIVITY RATIO
|
Fixed Assets Turnover |
27.41 |
Impressive |
Industrial
Average |
0.71 |
|
Total Assets Turnover |
1.38 |
Impressive |
Industrial
Average |
1.27 |
|
Inventory Conversion Period |
56.62 |
|
|
|
|
Inventory Turnover |
6.45 |
Impressive |
Industrial
Average |
4.82 |
|
Receivables Conversion Period |
73.75 |
|
|
|
|
Receivables Turnover |
4.95 |
Impressive |
Industrial
Average |
2.67 |
|
Payables Conversion Period |
311.21 |
|
|
|
The company's Account Receivable Ratio is calculated as 4.95 and 4.50 in
2012 and 2011 respectively. This ratio measures the efficiency of the company
in managing its trade debtors to generate revenue. A lower ratio may indicate
over extension and collection problems. Conversely, a higher ratio may indicate
an overtly stringent policy. In this case, the company's A/R ratio in 2012
increased from 2011. This would suggest the company had good performance in the
management of its debt collections.
Inventory Turnover in Days Ratio indicates the liquidity of inventory.
It estimates the number of days that it will take to sell the current
inventory. Inventory is particularly sensitive to change in business
activities. The inventory turnover in days has decreased from 87 days at the
end of 2011 to 57 days at the end of 2012. This represents a positive trend.
And Inventory turnover has increased from 4.2 times in year 2011 to 6.45 times
in year 2012.
The company's Total Asset Turnover is calculated as 1.38 times and 0.44
times in 2012 and 2011 respectively. This ratio is determined by dividing total
assets into total sales turnover. The ratio measures the activity of the assets
and the ability of the firm to generate sales through the use of the assets.
Trend of the
average competitors in the same industry for last 5 years
Fixed Assets Turnover Downtrend
Total Assets Turnover Downtrend
Inventory Turnover Downtrend
Receivables Turnover Downtrend
FOREIGN EXCHANGE RATES
|
Currency |
Unit
|
Indian
Rupees |
|
US Dollar |
1 |
Rs.64.68 |
|
UK Pound |
1 |
Rs.100.79 |
|
Euro |
1 |
Rs.86.30 |
INFORMATION DETAILS
|
Report
Prepared by : |
NLM |
RATING EXPLANATIONS
|
RATING |
STATUS |
PROPOSED CREDIT LINE |
|
|
>86 |
Aaa |
Possesses an extremely sound financial base with the
strongest capability for timely payment of interest and principal sums |
Unlimited |
|
71-85 |
Aa |
Possesses adequate working capital. No caution needed for credit
transaction. It has above average (strong) capability for payment of interest
and principal sums |
Large |
|
56-70 |
A |
Financial & operational base are regarded healthy.
General unfavourable factors will not cause fatal effect. Satisfactory capability
for payment of interest and principal sums |
Fairly
Large |
|
41-55 |
Ba |
Overall operation is considered normal. Capable to meet
normal commitments. |
Satisfactory |
|
26-40 |
B |
Capability to overcome financial difficulties seems comparatively
below average. |
Small |
|
11-25 |
Ca |
Adverse factors are apparent. Repayment of interest and
principal sums in default or expected to be in default upon maturity |
Limited
with full security |
|
<10 |
C |
Absolute credit risk exists. Caution needed to be
exercised |
Credit
not recommended |
|
-- |
NB |
New
Business |
-- |
This score serves as a reference to assess SC’s
credit risk and to set the amount of credit to be extended. It is calculated from
a composite of weighted scores obtained from each of the major sections of this
report. The assessed factors and their relative weights (as indicated through
%) are as follows:
Financial
condition (40%) Ownership
background (20%) Payment
record (10%)
Credit
history (10%) Market
trend (10%) Operational
size (10%)
This report is issued at your request without any
risk and responsibility on the part of MIRA INFORM PRIVATE LIMITED (MIPL)
or its officials.