MIRA
INFORM REPORT
|
Report Date : |
24.08.2013 |
IDENTIFICATION DETAILS
|
Name : |
MTS SYSTEMS CORPORATION |
|
|
|
|
Registered Office : |
Technology Drive 14000 Eden Prairie 55344 Minnesota |
|
|
|
|
Country : |
United States |
|
|
|
|
Financials (as on) : |
30.03.2013 |
|
|
|
|
Date of Incorporation : |
12.09.1966 |
|
|
|
|
Com. Reg. No.: |
1K-817 |
|
|
|
|
Legal Form : |
Corporation for Profit |
|
|
|
|
Line of Business : |
Testing and Sensing Solutions |
|
|
|
|
No. of Employees : |
2 147 |
RATING & COMMENTS
|
MIRA’s Rating : |
Ba |
|
RATING |
STATUS |
PROPOSED CREDIT LINE |
|
|
41-55 |
Ba |
Overall operation is considered normal. Capable to meet normal
commitments. |
Satisfactory |
|
Status : |
Good |
|
Payment Behaviour : |
Regular |
|
Litigation : |
Clear |
NOTES :
Any query related to this report can be made
on e-mail: infodept@mirainform.com
while quoting report number, name and date.
ECGC Country Risk Classification List – March 31st, 2013
|
Country Name |
Previous Rating (31.12.2012) |
Current Rating (31.03.2013) |
|
United States |
A1 |
A1 |
|
Risk Category |
ECGC
Classification |
|
Insignificant |
A1 |
|
Low |
A2 |
|
Moderate |
B1 |
|
High |
B2 |
|
Very High |
C1 |
|
Restricted |
C2 |
|
Off-credit |
D |
UNITED STATES - ECONOMIC OVERVIEW
The US has the largest and most technologically powerful
economy in the world, with a per capita GDP of $49,800. In this market-oriented
economy, private individuals and business firms make most of the decisions, and
the federal and state governments buy needed goods and services predominantly
in the private marketplace. US business firms enjoy greater flexibility than
their counterparts in Western Europe and Japan in decisions to expand capital
plant, to lay off surplus workers, and to develop new products. At the same
time, they face higher barriers to enter their rivals' home markets than
foreign firms face entering US markets. US firms are at or near the forefront
in technological advances, especially in computers and in medical, aerospace,
and military equipment; their advantage has narrowed since the end of World War
II. The onrush of technology largely explains the gradual development of a
"two-tier labor market" in which those at the bottom lack the
education and the professional/technical skills of those at the top and, more
and more, fail to get comparable pay raises, health insurance coverage, and
other benefits. Since 1975, practically all the gains in household income have
gone to the top 20% of households. Since 1996, dividends and capital gains have
grown faster than wages or any other category of after-tax income. Imported oil
accounts for nearly 55% of US consumption. Crude oil prices doubled between
2001 and 2006, the year home prices peaked; higher gasoline prices ate into
consumers' budgets and many individuals fell behind in their mortgage payments.
Oil prices climbed another 50% between 2006 and 2008, and bank foreclosures more
than doubled in the same period. Besides dampening the housing market, soaring
oil prices caused a drop in the value of the dollar and a deterioration in the
US merchandise trade deficit, which peaked at $840 billion in 2008. The
sub-prime mortgage crisis, falling home prices, investment bank failures, tight
credit, and the global economic downturn pushed the United States into a
recession by mid-2008. GDP contracted until the third quarter of 2009, making
this the deepest and longest downturn since the Great Depression. To help
stabilize financial markets, in October 2008 the US Congress established a $700
billion Troubled Asset Relief Program (TARP). The government used some of these
funds to purchase equity in US banks and industrial corporations, much of which
had been returned to the government by early 2011. In January 2009 the US
Congress passed and President Barack OBAMA signed a bill providing an
additional $787 billion fiscal stimulus to be used over 10 years - two-thirds
on additional spending and one-third on tax cuts - to create jobs and to help
the economy recover. In 2010 and 2011, the federal budget deficit reached
nearly 9% of GDP. In 2012 the federal government reduced the growth of spending
and the deficit shrank to 7.6% of GDP. Wars in Iraq and Afghanistan required
major shifts in national resources from civilian to military purposes and
contributed to the growth of the budget deficit and public debt. Through 2011,
the direct costs of the wars totaled nearly $900 billion, according to US
government figures. US revenues from taxes and other sources are lower, as a
percentage of GDP, than those of most other countries. In March 2010, President
OBAMA signed into law the Patient Protection and Affordable Care Act, a health
insurance reform that will extend coverage to an additional 32 million American
citizens by 2016, through private health insurance for the general population
and Medicaid for the impoverished. Total spending on health care - public plus
private - rose from 9.0% of GDP in 1980 to 17.9% in 2010. In July 2010, the
president signed the DODD-FRANK Wall Street Reform and Consumer Protection Act,
a law designed to promote financial stability by protecting consumers from
financial abuses, ending taxpayer bailouts of financial firms, dealing with
troubled banks that are "too big to fail," and improving
accountability and transparency in the financial system - in particular, by
requiring certain financial derivatives to be traded in markets that are
subject to government regulation and oversight. In December 2012, the Federal
Reserve Board announced plans to purchase $85 billion per month of
mortgage-backed and Treasury securities in an effort to hold down long-term
interest rates, and to keep short term rates near zero until unemployment drops
to 6.5% from the December rate of 7.8%, or until inflation rises above 2.5%.
Long-term problems include stagnation of wages for lower-income families,
inadequate investment in deteriorating infrastructure, rapidly rising medical
and pension costs of an aging population, energy shortages, and sizable current
account and budget deficits - including significant budget shortages for state
governments.
Source
: CIA
REGISTERED NAME & COMPANY
SUMMARY
|
IDENTIFICATION |
|||
|
Legal Name: |
MTS SYSTEMS CORPORATION |
||
|
Legal Address |
Technology Drive 14000 |
||
|
Postal Town |
Eden Prairie |
||
|
Post Code |
55344 |
||
|
Primary Geographic Area |
Minnesota |
||
|
Country |
US |
||
|
Location Status |
Headquarters,Legal
Address, |
||
|
Operative Address |
Technology Drive 14000,
55344 Eden Prairie, MN, USA. |
||
|
Telephone: |
+1 (952) 937-4000 / +1
(800) 328-2255 |
Registration Number : |
1K-817 |
|
Fax: |
+1 (952) 937-4515 |
Legal Form: |
Corporation for Profit |
|
Email: |
info@mts.com |
Registered in: |
US |
|
Website: |
www.mts.com |
Date Created: |
1966 |
|
Manager: |
Jeffrey A. Graves - President and Chief Executive Officer |
Date Incorporated: |
September 12, 1966 |
|
Staff: |
2 147 |
Stock: |
15 694 491 |
|
|
|
Value: |
USD
0.25 par value |
|
Activity: |
Testing and Sensing
Solutions. |
||
DIRECTORS/MANAGEMENT
|
Management: |
JEFFREY A. GRAVES
President and Chief
Executive Officer
SUSAN E. KNIGHT
Chief Financial Officer
and Senior Vice President
DAVID J. ANDERSON
Non- Executive Chair of
the Board
JEAN-LOU CHAMEAU
Director
BRENDAN C. HEGARTY
Director
EMILY M. LIGGETT
Director
WILLIAM V. MURRAY
Director
BARB J. SAMARDZICH
Director
GAIL P. STEINEL
Director
NEGATIVE INFORMATION
Legal Fillings
|
There are several UCC**
files listed with the Secretary of State of Minnesota such as: There are various
claims, lawsuits, and pending actions against the Company and its
subsidiaries incident to the operations of its business. It is the opinion of
management, after consultation with counsel, that the ultimate resolution of
such claims, lawsuits and pending actions will not have a material adverse
effect on the Company’s consolidated financial position, results of
operations or liquidity. THE COMPANY IS NOT
LISTED ON THE OFAC LIST.* For information: * The Specially
Designated Nationals (SDN) List is a publication of OFAC which lists
individuals and organizations with whom United States citizens and permanent
residents are prohibited from doing business. ** The Uniform
Commercial Code (UCC) is one of a number of uniform acts that have been
promulgated in conjunction with efforts to harmonize the law of sales and
other commercial transactions in all 50 states within the United States of
America. The UCC deals primarily
with transactions involving personal property (movable property), not real
property (immovable property). It allows a creditor to
notify other creditors about a debtor’s assets used as collateral for a
secured transaction by filing a public notice (financing statement) with a
particular filing office. The Uniform Commercial
Code Bureau files and maintains on financial obligations (including IRS
liens) incurred by individuals (in business as a sole proprietor), business
entities and corporations. |
|
Public |
YES |
SHARE & SHARE CAPITAL
INFORMATION
|
Shareholders |
|
|
Listed at the stock
exchange: |
|
|
|
YES |
|
Capital: |
|
|
|
Breakdown % of Shares Held by All
Insider and 5% Owners: 1% % of Shares Held by
Institutional & Mutual Fund Owners: 90% % of Float Held by
Institutional & Mutual Fund Owners: 91% Number of Institutions
Holding Shares: 170 |
Shareholders Parent
Company(ies):
Major Direct Holders
Holder Shares
SAMARDZICH
BARB J 21,261
KNIGHT SUSAN E 18,528
HELLWIG JOACHIM 12,530
ANDERSON
DAVID J 11,482
MURRAY WILLIAM V 11,401
Top Institutional Holders
Holder Shares
Vanguard Group, Inc. (The) 961,400
Wellington Management
Company, LLP 906,962
New South Capital
Manangement Inc. 786,458
BlackRock Fund Advisors 758,902
Royce & Associates,
LLC 660,207
BlackRock Institutional
Trust Company, N.A. 476,330
Price (T.Rowe) Associates
Inc 439,340
Schroder Investment
Management Group 427,800
Dimensional Fund Advisors
LP 402,881
Mairs & Power Inc 1,786,960
Top Mutual Fund Holders
Holder Shares
Mairs & Power Growth
Fund Inc 1,200,000
Pennsylvania Mutual Fund
Inc 471,275
Price (T.Rowe) Small-Cap
Value Fund 424,200
iShares Core S&P
Smallcap ETF 277,721
iShares Russell 2000 Index
Fund 250,826
Vanguard Small-Cap Index
Fund 234,028
Vanguard Total Stock
Market Index Fund 219,672
Vanguard Small-Cap Growth
Index Fund 187,960
Victory Portfolios-Victory
Small Company
Opportunity Fund 177,789
Royce Total Return Fund 168,722
PAYMENT INFORMATION
|
Payments |
REGULAR |
GROUP STRUCTURE & AFFILIATED
COMPANIES
|
Related Companies: |
Subsidiaries of the
Registrant
MTS
Japan Ltd. - Japan
MTS Sensor Technology K.K.
- Japan
MTS Korea, Inc. - South
Korea
MTS Systems (China) Co.,
Ltd. - China (PRC)
MTS Systems GmbH - Germany
MTS Systems Norden AB -
Sweden
MTS Systems Ltd. - United
Kingdom
MTS Systems Srl - Italy
MTS Holdings France, SARL
- France
MTS Systems SAS - France
MTS Sensor Technologie
GmbH and Co. KG - Germany
MTS Automotive Sensors
GmbH - Germany
MTS Sensor Technologie und
Verwaltungs-GmbH - Germany
MTS
Systems (Hong Kong), Inc. - Minnesota
MTS Systems Switzerland
GmbH - Switzerland
MTS Testing Systems
(Canada) Ltd. - Ontario
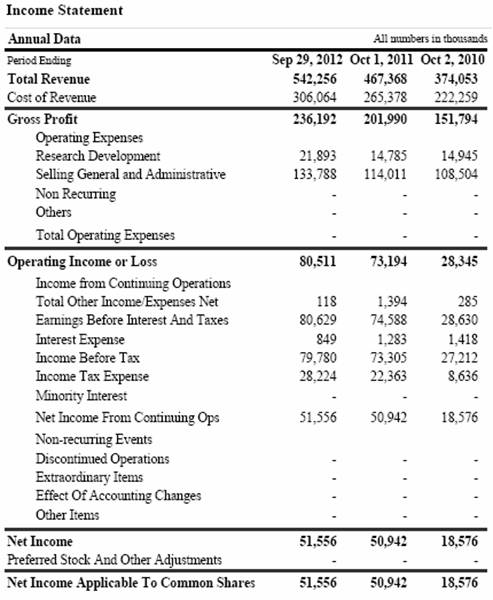
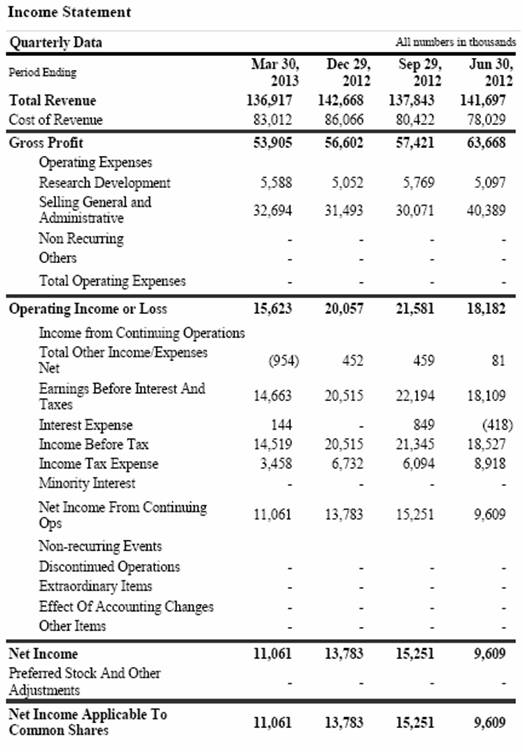
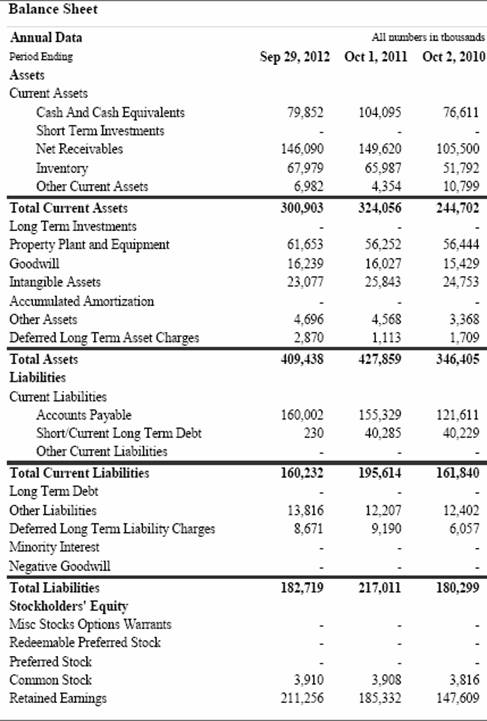
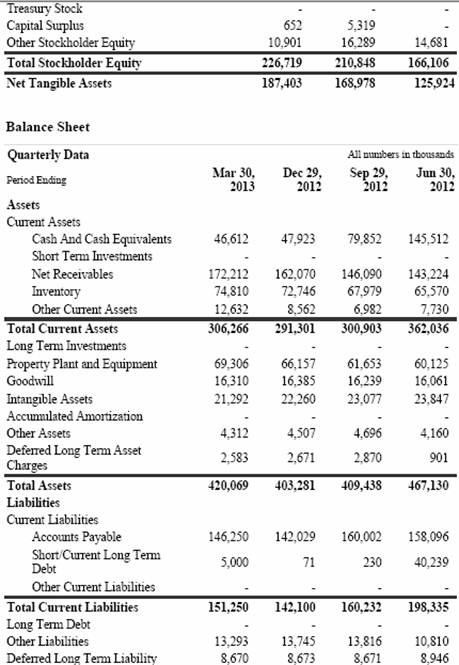
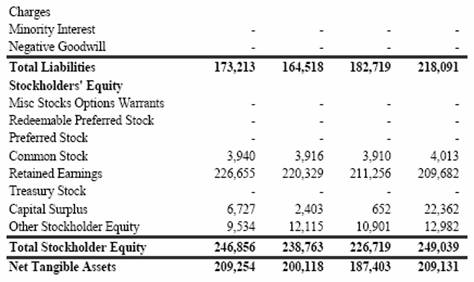
FINANCIAL INFORMATION
|
Financials - COMMERCIAL TRENDS
AND FORECAST |
|
The subject is a public
company traded at NYSE Stock Exchange under the symbol "MTSC".
Please find enclosed the financial statements. |
|
FINANCIAL SUMMARY |
|
|
Profitability |
GOOD |
|
Indebtedness |
CONTROLLED |
|
Cash |
NORMAL |
FOREIGN EXCHANGE RATES
N/a
ADDITIONAL INFORMATION
|
GEOPOLITICS - UNITED
STATES |
|
|
POLITICAL DATA |
ECONOMIC DATA |
|
Form of Government:
Federal
|
Currency: 100.00 USD =
77.7140 EUR |
|
BANKS |
|
|
Name of the Bank |
Wells Fargo Bank, NA |
|
Location |
Confidential |
|
Comments |
We could not verify this
information with the company. |
|
|
|
|
Name of the Bank |
Fifth Third Bank |
|
Location |
Confidential |
|
Comments |
We could not verify this
information with the company. |
|
|
|
|
Name of the Bank |
The Bank of Tokyo
Mitsubishi UFJ, Ltd |
|
Location |
Confidential |
|
Comments |
We could not verify this
information with the company. |
|
|
|
|
Name of the Bank |
U.S. Bank National
Association |
|
Location |
Confidential |
|
Comments |
We could not verify this
information with the company. |
|
|
|
|
Name of the Bank |
JPMorgan Chase Bank, N.A |
|
Location |
Confidential |
|
Comments |
We could not verify this
information with the company. |
|
|
|
|
Name of the Bank |
COMMERCE NATIONAL BANK |
|
Location |
COLUMBUS, OH. |
|
Comments |
We could not verify this
information with the company. |
|
BUSINESS HISTORY |
|
|
|
MTS Systems Corporation
was founded in 1966. |
|
PRINCIPAL ACTIVITY |
|
|
|
MTS Systems Corporation
supplies test systems and industrial position sensors. |
|
Products/Services
description: |
|
The company’s Test segment
provides testing solutions, including road simulators for durability
simulation; tire performance and rolling resistance measurement systems; moving
road-plane systems and balances use for aerodynamics measurements in wind
tunnels; systems for the physical characterization of materials, such as
ceramics, composites, and steel; systems to test durability and performance of
implants, prostheses, and other medical and dental materials and devices.
This segment also offers
products, systems, and software to perform static and fatigue testing of
aircraft and space vehicles; systems for structural engineering, including high
force static and dynamic testing; and seismic simulation tables to test the
designs of structures and set building codes.
In addition, it provides
various accessories and spare parts, as well as installation, calibration,
maintenance, training, and consulting services.
This segment serves
automobile, truck, motorcycle, motorsports vehicle, construction equipment,
agricultural equipment, rail, and off-road vehicle manufacturers and their
suppliers, as well as power generation, aerospace, bio-medical, wind energy,
structural engineering, and petroleum industries.
The company’s Sensors
segment manufactures products utilizing magnetostriction technology for
manufacturers of mobile equipment, plastic injection molding machines, and wood
product processing equipment, as well as to steel mill, fluid power, oil and
gas, medical, and alternative energy industries.
It also offers products to
measure fluid displacement for customers in the process industries.
|
Sales are: |
|
|
|
Wholesale |
|
Clients: |
|
|
|
The company sells its products
through direct sales organization, and independent representatives and
distributors, as well as through the Internet and catalogs. |
|
Suppliers: |
|
|
|
MTS
SYSTEMS(CHINA)CO.,LTD A5,FOREIGN TRADE XINGYE
INDUSTRIAL TONGLE,NANSHAN SHENZHEN, GUANGDONG 518052 CN |
|
Operations area: |
|
|
|
National, International |
|
The company imports from
Sweden, Netherlands, Germany, UK, Japan, China, Australia |
|
|
The company export to
Americas, Europa and Asia. |
|
|
Trade References: |
|
|
|
We could not obtained suppliers
contact information from North America or near regiosn for us to check trade
references. |
|
Competitors: |
|
|
|
Aero Systems
Engineering, Inc. General Electric Company OYO Corporation |
|
The subject employs 2
147 employee(s) |
|
|
Comments on staff: |
|
|
|
The Company had 2 147
employees as of September 29, 2012, including 1 157 employees located outside
the United States. |
|
PAYMENTS |
|
|
|
regular |
|
LOCATION |
|
|
Headquarters |
|
|
|
Technology Drive 14000, 55344
Eden Prairie, MN, USA. |
|
Branches: |
|
|
|
The company has two
branches: Cary, North Carolina,
USA Chanhassen,
Minnesota, USA |
|
Business Overview: |
|
|
|
Demand is driven by
consumer income and the rate of product innovation. The profitability of
individual companies depends on manufacturing efficiency and effective
marketing and distribution. Large companies have advantages in economies of
scale in manufacturing, marketing, and distribution. Small companies can
compete effectively by offering specialty products or components in system
solutions, such as speakers in a home theatre system. |
NOTES & COMMENTS
|
Rating |
|
Local credit bureau gave
a Good credit rate. The company is in Good Standing.
This means that all local and federal taxes were paid on due date. |
Final Opinion
|
|
MTS Systems Corporation
was founded in 1966 and it is based in Minnesota. It is a large size, public
company, which supplies test systems and industrial position sensors. The comapny works
nationally and internationally importing materials from Sweden, Netherlands,
Germany, UK, Japan, China, Australia and exporting its products to the Americas,
Europa and Asia. The operative facilities
of the company are well equipped and prepared. Regarding legal fillings
found, we consider there would not be negative outcomes affecting the
company´s profitabillity. The comapny´s
profitability is good and its indebtedness is controlled. Theefore, we may
establish a credit line of EUR 3 000 000. |
|
APPENDIX |
|
|
Comments |
|
|
|
We contacted an
adminsitrative assistant who refused to provide its name nor the information requested
nor transferred our call on grounds of confidentiality. |
Standard & Poor’s
|
United
States of America Long-Term Rating Lowered To 'AA+' Due To Political Risks,
Rising Debt Burden; Outlook Negative |
|
Publication
date: 05-Aug-2011 20:13:14 EST |
·
We have lowered our long-term
sovereign credit rating on the United States of America to 'AA+' from 'AAA' and
affirmed the 'A-1+' short-term rating.
·
We have also removed both the short- and long-term ratings from
CreditWatch negative.
·
The downgrade reflects our
opinion that the fiscal consolidation plan that Congress and the Administration
recently agreed to falls short of what, in our view, would be necessary to
stabilize the government's medium-term debt dynamics.
·
More broadly, the downgrade
reflects our view that the effectiveness, stability, and predictability of
American policymaking and political institutions have weakened at a time of
ongoing fiscal and economic challenges to a degree more than we envisioned when
we assigned a negative outlook to the rating on April 18, 2011.
·
Since then, we have changed our
view of the difficulties in bridging the gulf between the political parties
over fiscal policy, which makes us pessimistic about the capacity of Congress
and the Administration to be able to leverage their agreement this week into a
broader fiscal consolidation plan that stabilizes the government's debt
dynamics any time soon.
·
The outlook on the long-term
rating is negative. We could lower the long-term rating to 'AA' within the next
two years if we see that less reduction in spending than agreed to, higher
interest rates, or new fiscal pressures during the period result in a higher
general government debt trajectory than we currently assume in our base case.
TORONTO (Standard &
Poor's) Aug. 5, 2011--Standard & Poor's Ratings Services said today that it
lowered its long-term sovereign credit rating on the United States of America
to 'AA+' from 'AAA'. Standard & Poor's also said that the outlook on the long-term
rating is negative. At the same time, Standard & Poor's affirmed its 'A-1+'
short-term rating on the U.S. In addition, Standard & Poor's removed both
ratings from CreditWatch, where they were placed on July 14, 2011, with
negative implications.
The transfer and
convertibility (T&C) assessment of the U.S.--our assessment of the
likelihood of official interference in the ability of U.S.-based public- and
private-sector issuers to secure foreign exchange for
debt service--remains
'AAA'.
We lowered our long-term
rating on the U.S. because we believe that the prolonged controversy over
raising the statutory debt ceiling and the related fiscal policy debate
indicate that further near-term progress containing the growth in public
spending, especially on entitlements, or on reaching an agreement on raising
revenues is less likely than we previously assumed and will remain a
contentious and fitful process. We also believe that the fiscal consolidation
plan that Congress and the Administration agreed to this week falls short of
the amount that we believe is necessary to stabilize the general government
debt burden by the middle of the decade.
Our lowering of the
rating was prompted by our view on the rising public debt burden and our
perception of greater policymaking uncertainty, consistent with our criteria
(see "Sovereign Government Rating Methodology and
Assumptions ," June 30, 2011, especially Paragraphs 36-41).
Nevertheless, we view the U.S. federal government's other economic, external,
and monetary credit attributes, which form the basis for the sovereign rating,
as broadly unchanged.
We have taken the ratings
off CreditWatch because the Aug. 2 passage of the Budget Control Act Amendment
of 2011 has removed any perceived immediate threat of payment default posed by
delays to raising the government's debt ceiling. In addition, we believe that
the act provides sufficient clarity to allow us to evaluate the likely course
of U.S. fiscal policy for the next few years.
The political
brinksmanship of recent months highlights what we see as America's governance
and policymaking becoming less stable, less effective, and less predictable
than what we previously believed. The statutory debt ceiling and the threat of
default have become political bargaining chips in the debate over fiscal
policy. Despite this year's wide-ranging debate, in our view, the differences
between political parties have proven to be extraordinarily difficult to
bridge, and, as we see it, the resulting agreement fell well short of the
comprehensive fiscal consolidation program that some proponents had envisaged
until quite recently. Republicans and Democrats have only been able to agree to
relatively modest savings on discretionary spending while delegating to the
Select Committee decisions on more comprehensive measures. It appears that for
now, new revenues have dropped down on the menu of policy options. In addition,
the plan envisions only minor policy changes on Medicare and little change in
other entitlements,
the containment of which
we and most other independent observers regard as key to long-term fiscal
sustainability.
Our opinion is that elected
officials remain wary of tackling the structural issues required to effectively
address the rising U.S. public debt burden in a manner consistent with a 'AAA'
rating and with 'AAA' rated sovereign peers (see Sovereign Government Rating Methodology and
Assumptions," June 30, 2011, especially Paragraphs 36-41). In
our view, the difficulty in framing a consensus on fiscal policy weakens the
government's ability to manage public finances and diverts attention from the
debate over how to achieve more balanced and dynamic economic growth in an era
of fiscal stringency and private-sector deleveraging (ibid). A new political
consensus might (or might not) emerge after the 2012 elections, but we believe
that by then, the government debt burden will likely be higher, the needed
medium-term fiscal adjustment potentially greater, and the inflection point on
the U.S. population's demographics and other age-related spending drivers
closer at hand (see "Global Aging 2011: In The U.S., Going Gray Will Likely
Cost Even More Green, Now," June 21, 2011).
Standard & Poor's
takes no position on the mix of spending and revenue measures that Congress and
the Administration might conclude is appropriate for putting the U.S.'s
finances on a sustainable footing.
The act calls for as much
as $2.4 trillion of reductions in expenditure growth over the 10 years through
2021. These cuts will be implemented in two steps: the $917 billion agreed to
initially, followed by an additional $1.5 trillion that the newly formed
Congressional Joint Select Committee on Deficit Reduction is supposed to
recommend by November 2011. The act contains no measures to raise taxes or
otherwise enhance revenues, though the committee could recommend them.
The act further provides
that if Congress does not enact the committee's recommendations, cuts of $1.2 trillion
will be implemented over the same time period. The reductions would mainly
affect outlays for civilian discretionary spending, defense, and Medicare. We
understand that this fall-back mechanism is designed to encourage Congress to
embrace a more balanced mix of expenditure savings, as the committee might
recommend.
We note that in a letter
to Congress on Aug. 1, 2011, the Congressional Budget Office (CBO) estimated
total budgetary savings under the act to be at least $2.1 trillion over the
next 10 years relative to its baseline assumptions. In updating our own fiscal
projections, with certain modifications outlined below, we have relied on the
CBO's latest "Alternate Fiscal Scenario" of June 2011, updated to
include the CBO assumptions contained in its Aug. 1 letter to Congress. In
general, the CBO's "Alternate Fiscal Scenario" assumes a continuation
of recent Congressional action overriding existing law.
We view the act's
measures as a step toward fiscal consolidation. However, this is within the framework
of a legislative mechanism that leaves open the details of what is finally
agreed to until the end of 2011, and Congress and the Administration could
modify any agreement in the future. Even assuming that at least $2.1 trillion
of the spending reductions the act envisages are implemented, we maintain our
view that the U.S. net general government debt burden (all levels of government
combined, excluding liquid financial assets) will likely continue to grow.
Under our revised base case fiscal scenario--which we consider to be consistent
with a 'AA+' long-term rating and a negative outlook--we now project that net
general government debt would rise from an estimated 74% of GDP by the end of
2011 to 79% in 2015 and 85% by 2021. Even the projected 2015 ratio of sovereign
indebtedness is high in relation to those of peer credits and, as noted, would
continue to rise under the act's revised policy settings.
Compared with previous
projections, our revised base case scenario now assumes that the 2001 and 2003
tax cuts, due to expire by the end of 2012, remain in place. We have changed
our assumption on this because the majority of Republicans in Congress continue
to resist any measure that would raise revenues, a position we believe Congress
reinforced by passing the act. Key macroeconomic assumptions in the base case
scenario include trend real GDP growth of 3% and consumer price inflation near
2% annually over the decade.
Our revised upside
scenario--which, other things being equal, we view as consistent with the
outlook on the 'AA+' long-term rating being revised to stable--retains these
same macroeconomic assumptions. In addition, it incorporates $950 billion of
new revenues on the assumption that the 2001 and 2003 tax cuts for high earners
lapse from 2013 onwards, as the Administration is advocating. In this scenario,
we project that the net general government debt would rise from an estimated
74% of GDP by the end of 2011 to 77% in 2015 and to 78% by 2021.
Our revised downside
scenario--which, other things being equal, we view as being consistent with a
possible further downgrade to a 'AA' long-term rating--features less-favorable
macroeconomic assumptions, as outlined below and also assumes that the second
round of spending cuts (at least $1.2 trillion) that the act calls for does not
occur. This scenario also assumes somewhat higher nominal interest rates for
U.S. Treasuries. We still believe that the role of the U.S. dollar as the key
reserve currency confers a government funding advantage, one that could change
only slowly over time, and that Fed policy might lean toward continued loose
monetary policy at a time of fiscal tightening. Nonetheless, it is possible
that interest rates could rise if investors re-price relative risks. As a
result, our alternate scenario factors in a 50 basis point (bp)-75 bp rise in
10-year bond yields relative to the base and upside cases from 2013 onwards. In
this scenario, we project the net public debt burden would rise from 74% of GDP
in 2011 to 90% in 2015 and to 101% by 2021.
Our revised scenarios
also take into account the significant negative revisions to historical GDP
data that the Bureau of Economic Analysis announced on July 29. From our
perspective, the effect of these revisions underscores two related points when
evaluating the likely debt trajectory of the U.S. government. First, the
revisions show that the recent recession was deeper than previously assumed, so
the GDP this year is lower than previously thought in both nominal and real
terms. Consequently, the debt burden is slightly higher. Second, the revised
data highlight the sub-par path of the current economic recovery when compared
with rebounds following previous post-war recessions. We believe the sluggish
pace of the current economic recovery could be consistent with the experiences
of countries that have had financial crises in which the slow process of debt
deleveraging in the private sector leads to a persistent drag on demand. As a
result, our downside case scenario assumes relatively modest real trend GDP
growth of 2.5% and inflation of near 1.5% annually going forward.
When comparing the U.S.
to sovereigns with 'AAA' long-term ratings that we view as relevant
peers--Canada, France, Germany, and the U.K.--we also observe, based on our
base case scenarios for each, that the trajectory of the U.S.'s net public debt
is diverging from the others. Including the U.S., we estimate that these five
sovereigns will have net general government debt to GDP ratios this year
ranging from 34% (Canada) to 80% (the U.K.), with the U.S. debt burden at 74%.
By 2015, we project that their net public debt to GDP ratios will range between
30% (lowest, Canada) and 83% (highest, France), with the U.S. debt burden at
79%. However, in contrast with the U.S., we project that the net public debt
burdens of these other sovereigns will begin to decline, either before or by
2015.
Standard & Poor's
transfer T&C assessment of the U.S. remains 'AAA'. Our T&C assessment
reflects our view of the likelihood of the sovereign restricting other public
and private issuers' access to foreign exchange needed to meet debt service.
Although in our view the credit standing of the U.S. government has
deteriorated modestly, we see little indication that official interference of
this kind is entering onto the policy agenda of either Congress or the
Administration. Consequently, we continue to view this risk as being highly
remote.
The outlook on the
long-term rating is negative. As our downside alternate fiscal scenario illustrates,
a higher public debt trajectory than we currently assume could lead us to lower
the long-term rating again. On the other hand, as our upside scenario
highlights, if the recommendations of the Congressional Joint Select Committee
on Deficit Reduction--independently or coupled with other initiatives, such as
the lapsing of the 2001 and 2003 tax cuts for high earners--lead to fiscal
consolidation measures beyond the minimum mandated, and we believe they are
likely to slow the deterioration of the government's debt dynamics, the
long-term rating could stabilize at 'AA+'.
FOREIGN EXCHANGE RATES
|
Currency |
Unit
|
Indian Rupees |
|
US Dollar |
1 |
Rs.64.69 |
|
|
1 |
Rs.100.79 |
|
Euro |
1 |
Rs.86.30 |
INFORMATION DETAILS
|
Report
Prepared by : |
PRL |
RATING EXPLANATIONS
|
RATING |
STATUS |
PROPOSED CREDIT LINE |
|
|
>86 |
Aaa |
Possesses an extremely sound financial base with the strongest
capability for timely payment of interest and principal sums |
Unlimited |
|
71-85 |
Aa |
Possesses adequate working capital. No caution needed for credit
transaction. It has above average (strong) capability for payment of interest
and principal sums |
Large |
|
56-70 |
A |
Financial & operational base are regarded healthy. General unfavourable
factors will not cause fatal effect. Satisfactory capability for payment of
interest and principal sums |
Fairly Large |
|
41-55 |
Ba |
Overall operation is considered normal. Capable to meet normal
commitments. |
Satisfactory |
|
26-40 |
B |
Capability to overcome financial difficulties seems comparatively
below average. |
Small |
|
11-25 |
Ca |
Adverse factors are apparent. Repayment of interest and principal sums
in default or expected to be in default upon maturity |
Limited with full
security |
|
<10 |
C |
Absolute credit risk exists. Caution needed to be exercised |
Credit not
recommended |
|
-- |
NB |
New Business |
-- |
This score serves as a reference to assess SC’s credit risk and
to set the amount of credit to be extended. It is calculated from a composite
of weighted scores obtained from each of the major sections of this report. The
assessed factors and their relative weights (as indicated through %) are as
follows:
Financial
condition (40%) Ownership
background (20%) Payment
record (10%)
Credit history
(10%) Market trend
(10%) Operational
size (10%)
This report is issued at your request without any
risk and responsibility on the part of MIRA INFORM PRIVATE LIMITED (MIPL)
or its officials.