MIRA
INFORM REPORT
|
Report Date : |
18.12.2013 |
IDENTIFICATION DETAILS
|
Name : |
O'NEILL NETHERLANDS B.V. |
|
|
|
|
Registered Office : |
Oosteinde 32, 2361HE Warmond |
|
|
|
|
Country : |
Netherlands |
|
|
|
|
Financials (as on) : |
31.01.2013 |
|
|
|
|
Date of Incorporation : |
01.11.1977 |
|
|
|
|
Com. Reg. No.: |
KvK-nummer: 28033566 |
|
|
|
|
Legal Form : |
Private Company |
|
|
|
|
Line of Business : |
· Wholesaler of outerwear · Wholesaler of sports goods (not for water sports) · Importer and wholesale trader of sportswear and agency of sporting goods |
|
|
|
|
No. of Employees : |
15 (2013) |
RATING & COMMENTS
|
MIRA’s Rating : |
B |
|
RATING |
STATUS |
PROPOSED CREDIT LINE |
|
|
26-40 |
B |
Capability to overcome financial difficulties seems comparatively
below average. |
Small |
|
Status : |
Moderate |
|
|
|
|
Payment Behaviour : |
No Complaints |
|
|
|
|
Litigation : |
Clear |
NOTES :
Any query related to this report can be made
on e-mail: infodept@mirainform.com
while quoting report number, name and date.
ECGC Country Risk Classification List – September 30th, 2013
|
Country Name |
Previous Rating (30.06.2013) |
Current Rating (30.09.2013) |
|
Netherlands |
A1 |
A1 |
|
Risk Category |
ECGC
Classification |
|
Insignificant |
A1 |
|
Low |
A2 |
|
Moderate |
B1 |
|
High |
B2 |
|
Very High |
C1 |
|
Restricted |
C2 |
|
Off-credit |
D |
Netherlands ECONOMIC OVERVIEW
The Dutch
economy is the sixth-largest economy in the euro-zone and is noted for its
stable industrial relations, moderate unemployment and inflation, a sizable
trade surplus, and an important role as a European transportation hub.
Industrial activity is predominantly in food processing, chemicals, petroleum
refining, and electrical machinery. A highly mechanized agricultural sector
employs only 2% of the labor force but provides large surpluses for the food-processing
industry and for exports. The Netherlands, along with 11 of its EU partners,
began circulating the euro currency on 1 January 2002. After 26 years of
uninterrupted economic growth, the Dutch economy - highly dependent on an
international financial sector and international trade - contracted by 3.5% in
2009 as a result of the global financial crisis. The Dutch financial sector
suffered, due in part to the high exposure of some Dutch banks to U.S.
mortgage-backed securities. In 2008, the government nationalized two banks and
injected billions of dollars of capital into other financial institutions, to
prevent further deterioration of a crucial sector. The government also sought
to boost the domestic economy by accelerating infrastructure programs, offering
corporate tax breaks for employers to retain workers, and expanding export
credit facilities. The stimulus programs and bank bailouts, however, resulted
in a government budget deficit of 5.3% of GDP in 2010 that contrasted sharply
with a surplus of 0.7% in 2008. The government of Prime Minister Mark RUTTE
began implementing fiscal consolidation measures in early 2011, mainly
reductions in expenditures, which resulted in an improved budget deficit in
2011. In 2012 tax revenues dropped nearly 9%, GDP contracted, and the budget
deficit deteriorated. Although jobless claims continued to grow, the
unemployment rate remained relatively low at 6.8 percent.
Source : CIA
company Summary
Company name O'Neill Netherlands B.V.
Operative address Oosteinde
32
2361HE Warmond
Netherlands
Status Active
Specification This
company can meet all its obligations.
Legal Form Besloten
Vennootschap (Private Company)
Registration number KvK-nummer:
28033566
VAT-number 004859819
|
Year |
2013 |
|
Mutation |
2012 |
|
Mutation |
2011 |
|
Fixed assets |
465.093.000 |
|
-8,36 |
507.547.000 |
|
-6,86 |
544.923.000 |
|
Total receivables |
36.877.000 |
|
-33,41 |
55.379.000 |
|
-8,96 |
60.832.000 |
|
|
|||||||
|
Total equity |
103.891.000 |
|
-6,91 |
111.607.000 |
|
-36,88 |
176.804.000 |
|
Short term liabilities |
136.825.000 |
|
-48,92 |
267.862.000 |
|
49,31 |
179.401.000 |
|
|
|||||||
|
Net result |
4.884.000 |
|
106,52 |
-74.941.000 |
|
-71,22 |
-43.768.000 |
|
|
|||||||
|
Working capital |
-31.764.000 |
|
75,99 |
-132.292.000 |
|
-219,89 |
-41.355.000 |
|
Quick ratio |
0,37 |
|
37,04 |
0,27 |
|
-30,77 |
0,39 |
Contact information
Company name O'Neill Netherlands B.V.
Trade names O'Neill
Netherlands B.V.
Operative address Oosteinde
32
2361HE Warmond
Netherlands
Correspondence address Oosteinde
32
2361HE Warmond
Netherlands
Telephone number 0715813813
Fax number 0715813800
Email address info@oneill.nl
Website www.oneilleurope.com
Registration
Registration number KvK-nummer:
28033566
Registered in Kamer
van Koophandel Den Haag
Branch number 000016128753
VAT-number 004859819
Status Active
Memorandum 1979-01-30
Establishment date 1977-11-01
Legal form Besloten
Vennootschap (Private Company)
Last proposed admendment 2007-10-10
Activities
Activities
SBI Agents
specialising in the sale of other goods (4618)
Wholesale of outerwear (46421)
Wholesale of sports goods (not
for water sports) (46496)
Exporter No
Importer No
Goal Import
van- en de groothandel en agenturenhandel in sportkleding en
sportartikelen
(Import and
wholesale trade in sportswear and agency sporting goods)
Relations
Shareholders O'Neill Europe Holding B.V.
Oosteinde 32
2361HE WARMOND
Netherlands
Registration number: 280799440000
Percentage: 100.00%
Companies on same address
O'Neill Retail Netherlands B.V.
Registration number: 310430410000
O'Neill Europe B.V.
Registration number: 280361210000
O'Neill Retail Europe B.V.
Registration number: 280521980000
O'Neill Germany B.V.
Registration number: 310430420000
O'Neill Trademark B.V.
Registration number: 180761570000
Boardco B.V.
Registration number: 201316240000
O'Neill Europe Holding B.V.
Registration number: 280799440000
Team O'Neill International B.V.
Registration number: 273274160000
O'Neill Trademark Services B.V.
Registration number: 273811260000
Liability statements
WE International B.V.
Reactorweg 101
3542AD Utrecht
Netherlands
Registration number: 300912610000
date of issue: 2008-06-06
Starting date: 2007-05-15
Management
Active management Boardco B.V.
Oosteinde 32
2361HE WARMOND
Netherlands
Registration number: 201316240000
Competence: Fully authorized
Function: Manager
Starting date: 2007-05-14
Employees
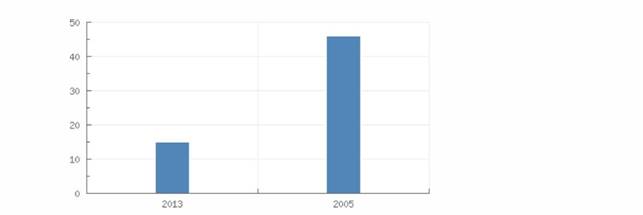
Total according to the Chamber of Commerce 15
|
Year |
2013 |
2005 |
|
Total |
15 |
46 |
Payments
Description Payments made under regular
condition
|
Key figures |
||||||||||||
|
|
2013 |
2012 |
2011 |
2010 |
2009 |
|
||||||
|
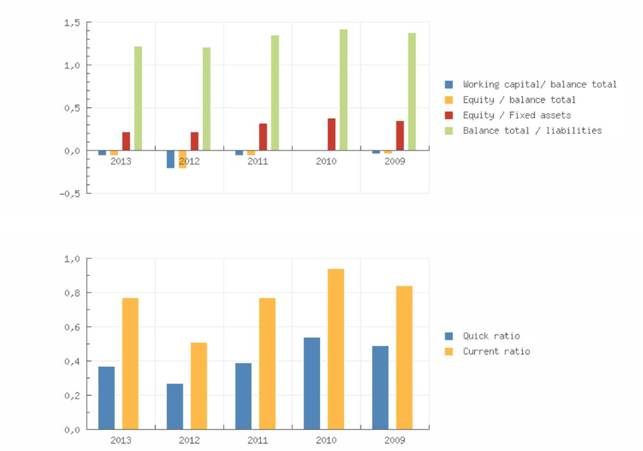
Current ratio |
0,77 |
0,51 |
0,77 |
0,94 |
0,84 |
|
||||||
|
|
|
|||||||||||
|
Working capital/ balance total |
-0,06 |
-0,21 |
-0,06 |
-0,01 |
-0,04 |
|
||||||
|
Equity / balance total |
0,18 |
0,17 |
0,26 |
0,30 |
0,28 |
|
||||||
|
Equity / Fixed assets |
0,22 |
0,22 |
0,32 |
0,38 |
0,35 |
|
||||||
|
Equity / liabilities |
0,22 |
0,21 |
0,35 |
0,42 |
0,38 |
|
||||||
|
Balance total / liabilities |
1,22 |
1,21 |
1,35 |
1,42 |
1,38 |
|
||||||
|
|
|
|||||||||||
|
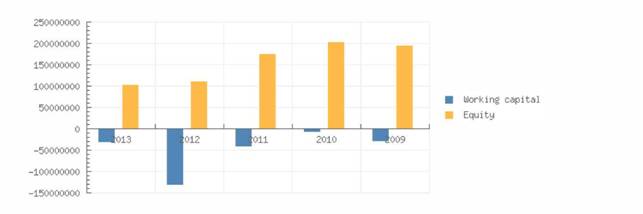
Working capital |
-31.764.000 |
-132.292.000 |
-41.355.000 |
-8.933.000 |
-29.381.000 |
|
||||||
|
Equity |
103.891.000 |
111.607.000 |
176.804.000 |
204.235.000 |
195.015.000 |
|
||||||
|
Mutation equity |
-6,91 |
-36,88 |
-13,43 |
4,73 |
3,79 |
|
||||||
|
Mutation short term liabilities |
-48,92 |
49,31 |
12,35 |
-11,64 |
22,97 |
|
||||||
|
|
|
|||||||||||
|
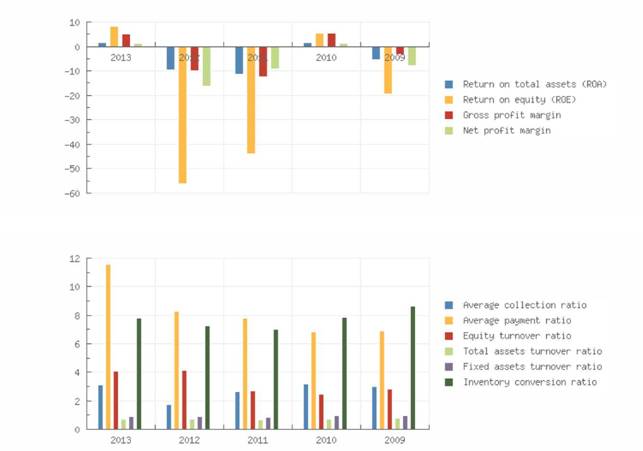
Return on total assets (ROA) |
1,53 |
-9,75 |
-11,32 |
1,57 |
-5,35 |
|
||||||
|
Return on equity (ROE) |
8,41 |
-56,16 |
-43,74 |
5,29 |
-19,42 |
|
||||||
|
Gross profit margin |
5,17 |
-9,81 |
-12,38 |
5,35 |
-3,36 |
|
||||||
|
Net profit margin |
1,14 |
-16,31 |
-9,22 |
1,34 |
-7,98 |
|
||||||
|
|
|
|||||||||||
|
Average collection ratio |
3,12 |
1,72 |
2,65 |
3,19 |
3,02 |
|
||||||
|
Average payment ratio |
11,58 |
8,30 |
7,80 |
6,85 |
6,88 |
|
||||||
|
Equity turnover ratio |
4,11 |
4,12 |
2,68 |
2,49 |
2,80 |
|
||||||
|
Total assets turnover ratio |
0,75 |
0,71 |
0,69 |
0,74 |
0,77 |
|
||||||
|
Fixed assets turnover ratio |
0,92 |
0,91 |
0,87 |
0,95 |
0,98 |
|
||||||
|
Inventory conversion ratio |
7,80 |
7,26 |
7,04 |
7,88 |
8,66 |
|
||||||
|
|
|
|||||||||||
|
Turnover |
426.886.000 |
459.560.000 |
474.604.000 |
509.076.000 |
545.219.000 |
|
||||||
|
Gross margin |
185.070.000 |
187.902.000 |
187.551.000 |
216.041.000 |
229.743.000 |
|
||||||
|
Operating result |
22.081.000 |
-45.064.000 |
-58.778.000 |
27.221.000 |
-18.314.000 |
|
||||||
|
Net result after taxes |
4.884.000 |
-74.941.000 |
-43.768.000 |
6.817.000 |
-43.529.000 |
|
||||||
|
Gross profit |
426.886.000 |
--- |
--- |
509.076.000 |
545.219.000 |
|
||||||
|
EBIT |
22.081.000 |
-45.064.000 |
-58.778.000 |
27.221.000 |
-18.314.000 |
|
||||||
Summary
The 2013 financial result structure is a negative working capital of -31.764.000 euro, which is in agreement with -6 % of the total assets of the company.
The working capital has increased with 75.99 % compared to previous year. The ratio, with respect to the total assets of the company has however, increased. The improvement between 2012 and 2013 has mainly been caused by an increase of the current assets.
The current ratio of the company in 2013 was 0.77. When the current ratio is below 1.5, the company may have problems meeting its short-term obligations.
The quick ratio in 2013 of the company was 0.37. A company with a Quick Ratio of less than 1 cannot currently pay back its current liabilities.
The 2012 financial result structure is a negative working capital of -132.292.000 euro, which is in agreement with -21 % of the total assets of the company.
The working capital has diminished with -219.89 % compared to previous year. The ratio, with respect to the total assets of the company has however, declined. The deterioration between 2011 and 2012 has mainly been caused by an increase of the current liabilities.
The current ratio of the company in 2012 was 0.51. When the current ratio is below 1.5, the company may have problems meeting its short-term obligations.
The quick ratio in 2012 of the company was 0.27. A company with a Quick Ratio of less than 1 cannot currently pay back its current liabilities.
Financial statement
Type of annual account Consolidated
Annual account WE
International B.V.
Reactorweg 101
3542AD Utrecht
Netherlands
Registration number: 300912610000
Balance sheet
|
Year |
2013 |
2012 |
2011 |
2010 |
2009 |
|
End date |
2013-01-31 |
2012-01-31 |
2011-01-31 |
2010-01-31 |
2009-01-31 |
|
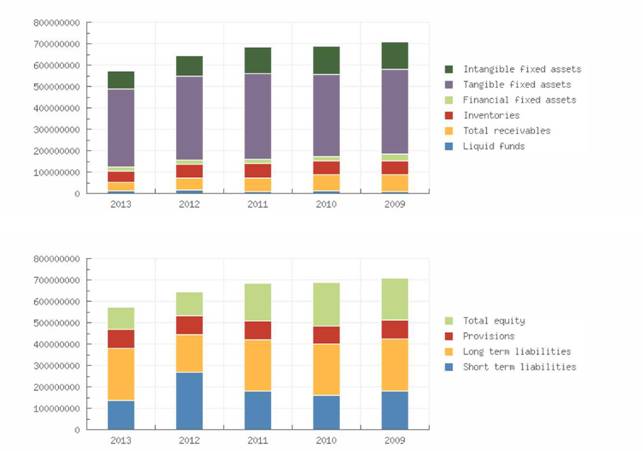
Intangible fixed assets |
83.798.000 |
93.184.000 |
124.787.000 |
131.075.000 |
129.524.000 |
|
Tangible fixed assets |
363.751.000 |
395.331.000 |
399.164.000 |
381.863.000 |
393.963.000 |
|
Financial fixed assets |
17.544.000 |
19.032.000 |
20.972.000 |
23.120.000 |
33.307.000 |
|
Fixed assets |
465.093.000 |
507.547.000 |
544.923.000 |
536.058.000 |
556.794.000 |
|
|
|||||
|
Inventories |
54.752.000 |
63.280.000 |
67.417.000 |
64.589.000 |
62.930.000 |
|
Accounts receivable |
14.631.000 |
28.668.000 |
31.158.000 |
34.034.000 |
37.936.000 |
|
Other receivables |
22.246.000 |
26.711.000 |
29.674.000 |
40.300.000 |
41.341.000 |
|
Total receivables |
36.877.000 |
55.379.000 |
60.832.000 |
74.334.000 |
79.277.000 |
|
Liquid funds |
13.432.000 |
16.911.000 |
9.797.000 |
11.823.000 |
9.119.000 |
|
Current assets |
105.061.000 |
135.570.000 |
138.046.000 |
150.746.000 |
151.326.000 |
|
Total assets |
570.154.000 |
643.117.000 |
682.969.000 |
686.804.000 |
708.120.000 |
|
Minority
interests |
|
|
|
-829.000 |
-829.000 |
|
Total equity |
103.891.000 |
111.607.000 |
176.804.000 |
204.235.000 |
195.015.000 |
|
Provisions |
85.179.000 |
86.163.000 |
86.519.000 |
84.348.000 |
90.261.000 |
|
Long term liabilities |
244.259.000 |
177.485.000 |
240.245.000 |
239.371.000 |
242.966.000 |
|
Accounts
payable |
40.597.000 |
39.492.000 |
47.996.000 |
42.590.000 |
36.044.000 |
|
Other
short term liabilities |
96.228.000 |
228.370.000 |
131.405.000 |
117.089.000 |
144.663.000 |
|
Short term liabilities |
136.825.000 |
267.862.000 |
179.401.000 |
159.679.000 |
180.707.000 |
|
Total short and long term liabilities |
466.263.000 |
531.510.000 |
506.165.000 |
483.398.000 |
513.934.000 |
|
Total liabilities |
570.154.000 |
643.117.000 |
682.969.000 |
686.804.000 |
708.120.000 |
Summary
The
total assets of the company decreased with -11.35 % between 2012 and 2013.
This
total assets decrease has been reflected in a reduction of non current assets
of -8.36 %.
Assets
reduction is explained by a Net Worth decrease of -6.91 %, and an indebtedness
reduction
of -12.28 %.
In
2013 the assets of the company were 81.57 % composed of fixed assets and 18.43
% by current assets. The assets are being financed by an equity of 18.22 %, and
total debt of 81.78 %. The total assets of the company decreased with -5.84 %
between 2011 and 2012.
This
downturn is mainly retrievable in the fixed asset decrease of -6.86 %.
The
asset reduction results in an equity decrease of -36.88 %. Despite the
decrease, the indebtness increased with 5.01 %.
In
2012 the assets of the company were 78.92 % composed of fixed assets and 21.08
% by current assets. The assets are being financed by an equity of 17.35 %, and
total debt of 82.65 %.
Profit & loss
|
Year |
2013 |
2012 |
2011 |
2010 |
2009 |
|
|
Revenues |
485.477.000 |
459.560.000 |
474.604.000 |
561.480.000 |
548.397.000 |
|
|
Other operating income |
58.591.000 |
|
|
52.404.000 |
3.178.000 |
|
|
Net turnover |
426.886.000 |
459.560.000 |
474.604.000 |
509.076.000 |
545.219.000 |
|
|
|
||||||
|
Gross margin |
185.070.000 |
187.902.000 |
187.551.000 |
216.041.000 |
229.743.000 |
|
|
|
||||||
|
Wages and salaries |
92.928.000 |
100.763.000 |
109.305.000 |
114.741.000 |
113.469.000 |
|
|
Sales |
241.816.000 |
271.658.000 |
287.053.000 |
293.035.000 |
315.476.000 |
|
|
other operating costs |
128.652.000 |
132.203.000 |
137.024.000 |
126.483.000 |
137.766.000 |
|
|
Operating expenses |
463.396.000 |
504.624.000 |
533.382.000 |
534.259.000 |
566.711.000 |
|
|
Result in subsidiaries |
19.000 |
15.000 |
2.000 |
-73.000 |
412.000 |
|
|
Operating result |
22.081.000 |
-45.064.000 |
-58.778.000 |
27.221.000 |
-18.314.000 |
|
|
|
||||||
|
Financial income |
1.992.000 |
385.000 |
405.000 |
1.187.000 |
6.153.000 |
|
|
Financial expenses |
15.357.000 |
18.011.000 |
18.955.000 |
17.534.000 |
26.132.000 |
|
|
Financial result |
-13.365.000 |
-17.626.000 |
-18.550.000 |
-16.347.000 |
-19.979.000 |
|
|
Result on ordinary operations before taxes |
8.735.000 |
-62.675.000 |
-77.326.000 |
10.801.000 |
-37.881.000 |
|
|
|
||||||
|
Taxation on the result of ordinary activities |
3.851.000 |
2.382.000 |
1.019.000 |
3.984.000 |
-5.277.000 |
|
|
Result of ordinary activities after taxes |
4.884.000 |
-65.057.000 |
-78.345.000 |
6.817.000 |
-32.604.000 |
|
|
Extraordinary expense |
|
|
|
|
10.925.000 |
|
|
Extraordinary result after taxation |
|
|
|
|
-10.925.000 |
|
|
Result subsidiaries after taxes |
|
-9.884.000 |
34.577.000 |
--- |
--- |
|
|
Net result |
4.884.000 |
-74.941.000 |
-43.768.000 |
6.817.000 |
-43.529.000 |
|
Summary
The turnover of the company decreased by -7.11 % between 2012 and 2013.
The gross profit of the company decreased by -1.51 % between 2012 and 2013.
The operating result of the company grew with 149 % between 2012 and 2013. This evolution implies an increase of the company's economic profitability.
The result of these changes is an increase of the company's Economic Profitability of 115.69 % of the analysed period, being equal to 2012 % in the year 2013.
This growth has contributed to the increase in assets turnover, increasing by 5.63 % reaching 0.75.
The Net Result of the company decreased by 106.52 % between 2012 and 2013.
The company's Financial Profitability has been positively affected by the financial activities in comparison to the EBITs behaviour. The result of these variations is a profitability increase of 114.98 % of the analysed period, being 8.41 % in the year 2013.
The company's financial structure has slowed down its financial profitability.
The turnover of the company decreased by -3.17 % between 2011 and 2012.
The gross profit of the company has remained the same between 2011 and 2012.
The operating result of the company grew with 23.33 % between 2011 and 2012. This evolution implies an increase of the company's economic profitability.
The result of these changes is an increase of the company's Economic Profitability of 13.87 % of the analysed period, being equal to 2011 % in the year 2012.
This growth has contributed to the increase in assets turnover, increasing by 2.9 % reaching 0.71.
The Net Result of the company increased by -71.22 % between 2011 and 2012.
The company's Financial Profitability has been positively affected by the financial activities in comparison to the EBITs behaviour. The result of these variations is a profitability increase of -28.4 % of the analysed period, being -56.16 % in the year 2012.
The company's financial profitability has been positively affected by its financial structure.
Analysis
Analysis
Branch (SBI)
Groothandel en Wholesale on a fee or contract basis (niet
in auto’s en motorfietsen) (46)
Region
Rijnland
In the Netherlands 107516 of the companies are registered
with the SBI code 46
In the region Rijnland 4298 of the companies are
registered with the SBI code 46
In the Netherlands 2108 of the bankrupcties are published
within this sector
In the region Rijnland 86 of the bankruptcies are published
within this sector
The risk of this specific sector in the Netherlands is
normal
The risk of this specific sector in the region Rijnland is
normal
Publications
Consent statements
04-07-2013: Voor boekjaar 2012 is een
instemmingsverklaring gedeponeerd.
26-10-2012: Voor boekjaar 2011 is een
instemmingsverklaring gedeponeerd.
03-03-2011: Voor boekjaar 2010 is een
instemmingsverklaring gedeponeerd.
02-02-2010: Voor boekjaar 2009 is een
instemmingsverklaring gedeponeerd.
Functions
20-04-2011: Per 03-01-2011 is bestuurder Adriaan Zwarthoff
uit functie getreden.
Company structure
Relations 30
We Finance and Services (Luxem
Luxembourg
WE International B.V.
Reactorweg 101
3542AD Utrecht
Netherlands
Registration number: 300912610000
Logo International B.V.
Minervum 7032
4817ZL BREDA
Netherlands
Registration number: 302198020000
Boardco B.V.
Oosteinde 32
2361HE WARMOND
Netherlands
Registration number: 201316240000
O'Neill Europe Holding B.V.
Oosteinde 32
2361HE WARMOND
Netherlands
Registration number: 280799440000
O'Neill Netherlands B.V.
Oosteinde 32
2361HE Warmond
Netherlands
Registration number: 280335660000
FOREIGN EXCHANGE RATES
|
Currency |
Unit
|
Indian Rupees |
|
US Dollar |
1 |
Rs.61.96 |
|
UK Pound |
1 |
Rs.101.14 |
|
Euro |
1 |
Rs.85.33 |
INFORMATION DETAILS
|
Report
Prepared by : |
MNL |
RATING EXPLANATIONS
|
RATING |
STATUS |
PROPOSED CREDIT LINE |
|
|
>86 |
Aaa |
Possesses an extremely sound financial base with the strongest
capability for timely payment of interest and principal sums |
Unlimited |
|
71-85 |
Aa |
Possesses adequate working capital. No caution needed for credit
transaction. It has above average (strong) capability for payment of interest
and principal sums |
Large |
|
56-70 |
A |
Financial & operational base are regarded healthy. General
unfavourable factors will not cause fatal effect. Satisfactory capability for
payment of interest and principal sums |
Fairly Large |
|
41-55 |
Ba |
Overall operation is considered normal. Capable to meet normal
commitments. |
Satisfactory |
|
26-40 |
B |
Capability to
overcome financial difficulties seems comparatively below average. |
Small |
|
11-25 |
Ca |
Adverse factors are apparent. Repayment of interest and principal sums
in default or expected to be in default upon maturity |
Limited with
full security |
|
<10 |
C |
Absolute credit risk exists. Caution needed to be exercised |
Credit not
recommended |
|
-- |
NB |
New Business |
-- |
This score serves as a reference to assess SC’s credit risk
and to set the amount of credit to be extended. It is calculated from a
composite of weighted scores obtained from each of the major sections of this
report. The assessed factors and their relative weights (as indicated through
%) are as follows:
Financial
condition (40%) Ownership
background (20%) Payment
record (10%)
Credit history
(10%) Market trend
(10%) Operational
size (10%)
This report is issued at your request without any
risk and responsibility on the part of MIRA INFORM PRIVATE LIMITED (MIPL)
or its officials.