MIRA
INFORM REPORT
|
Report Date : |
30.12.2013 |
IDENTIFICATION DETAILS
|
Name : |
CPH CHEMICALS B.V. |
|
|
|
|
Registered Office : |
Amsterdamseweg 204A, 1182HL |
|
|
|
|
Country : |
|
|
|
|
|
Financials (as on) : |
31.12.2011 |
|
|
|
|
Date of Incorporation : |
01.08.1999 |
|
|
|
|
Com. Reg. No.: |
34120752 |
|
|
|
|
Legal Form : |
Private Company |
|
|
|
|
Line of Business : |
Engaged in supplying variety of petrochemicals, fiber-intermediates, boron minerals, specialty chemicals and plastics. |
|
|
|
|
No. of Employees : |
14 |
RATING & COMMENTS
|
MIRA’s Rating : |
B |
|
RATING |
STATUS |
PROPOSED CREDIT LINE |
|
|
26-40 |
B |
Capability to overcome financial difficulties seems comparatively
below average. |
Small |
|
Status : |
Moderate |
|
|
|
|
Payment Behaviour : |
Unknown |
|
|
|
|
Litigation : |
Clear |
NOTES :
Any query related to this report can be made
on e-mail: infodept@mirainform.com
while quoting report number, name and date.
ECGC Country Risk Classification List – September 30th, 2013
|
Country Name |
Previous Rating (30.06.2013) |
Current Rating (30.09.2013) |
|
Netherlands |
A1 |
A1 |
|
Risk Category |
ECGC
Classification |
|
Insignificant |
A1 |
|
Low |
A2 |
|
Moderate |
B1 |
|
High |
B2 |
|
Very High |
C1 |
|
Restricted |
C2 |
|
Off-credit |
D |
Netherlands ECONOMIC OVERVIEW
The Dutch economy is the sixth-largest
economy in the euro-zone and is noted for its stable industrial relations,
moderate unemployment and inflation, a sizable trade surplus, and an important
role as a European transportation hub. Industrial activity is predominantly in
food processing, chemicals, petroleum refining, and electrical machinery. A
highly mechanized agricultural sector employs only 2% of the labor force but
provides large surpluses for the food-processing industry and for exports. The
Netherlands, along with 11 of its EU partners, began circulating the euro
currency on 1 January 2002. After 26 years of uninterrupted economic growth,
the Dutch economy - highly dependent on an international financial sector and
international trade - contracted by 3.5% in 2009 as a result of the global
financial crisis. The Dutch financial sector suffered, due in part to the high
exposure of some Dutch banks to U.S. mortgage-backed securities. In 2008, the
government nationalized two banks and injected billions of dollars of capital
into other financial institutions, to prevent further deterioration of a
crucial sector. The government also sought to boost the domestic economy by
accelerating infrastructure programs, offering corporate tax breaks for
employers to retain workers, and expanding export credit facilities. The
stimulus programs and bank bailouts, however, resulted in a government budget
deficit of 5.3% of GDP in 2010 that contrasted sharply with a surplus of 0.7%
in 2008. The government of Prime Minister Mark RUTTE began implementing fiscal
consolidation measures in early 2011, mainly reductions in expenditures, which
resulted in an improved budget deficit in 2011. In 2012 tax revenues dropped
nearly 9%, GDP contracted, and the budget deficit deteriorated. Although
jobless claims continued to grow, the unemployment rate remained relatively low
at 6.8 percent.
Source : CIA
Company summary
Company name CPH Chemicals B.V.
Operative address Amsterdamseweg
204A
1182HL Amstelveen
Netherlands
Status Active
Legal form Besloten Vennootschap
(Private Company)
Registration number KvK-nummer:
34120752
VAT-number 808564043
|
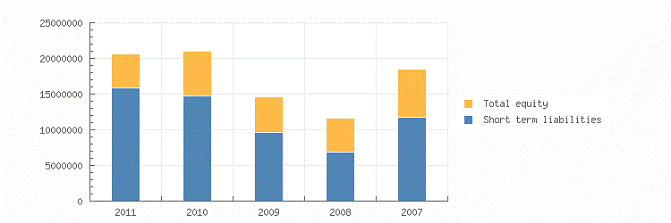
Year |
2011 |
Mutation |
2010 |
Mutation |
2009 |
|
Fixed
assets |
328.474 |
0,01 |
328.455 |
24,99 |
262.775 |
|
Total
receivables |
8.483.526 |
4,68 |
8.104.586 |
38,31 |
5.859.641 |
|
Total equity |
4.731.746 |
-24,82 |
6.293.838 |
25,84 |
5.001.623 |
|
Short term
liabilities |
15.887.081 |
7,74 |
14.745.270 |
53,45 |
9.609.144 |
|
Net result |
4.752.933 |
15,49 |
4.115.336 |
35,88 |
3.028.668 |
|
Working
capital |
4.403.272 |
-26,19 |
5.965.383 |
25,88 |
4.738.848 |
|
Quick ratio |
0,54 |
-1,82 |
0,55 |
-11,29 |
0,62 |
Contact information
Company name CPH Chemicals B.V.
Trade names CPH Chemicals B.V.
Operative address Amsterdamseweg
204A
1182HL Amstelveen
Netherlands
Correspondence address Amsterdamseweg
204A
1182HL Amstelveen
Netherlands
Telephone number 020 4260900
Fax number 020 4260900
Email address claudia@cphchemicals.nl
Website www.cphchemicals.nl
Registration
Registration number KvK-nummer:
34120752
Registered in Kamer van
Koophandel Amsterdam
Branch number 000016673441
VAT-number 808564043
Status Active
First registration company
Register 2000-05-12
Memorandum 2000-02-10
Establishment date 1999-08-01
Legal form Besloten
Vennootschap (Private Company)
Last proposed
admendment 2001-04-17
Activities
supplier of a large variety of petrochemicals, fiber-intermediates, boron minerals, specialty chemicals and plastics.
CPH Chemicals has
broad experience with:
· Fiber intermediates such as caprolactam, polyamide 6, polyamide 66, adipic acid and cyclohexanone
Boron
minerals such as boric acid, boric anhydride/oxide and disodium octaborate
Various
petrochemicals
Base
chemicals: titanium dioxide, zirconium dioxide and aluminum fluoride
Specialty
chemicals: sodium borohydride, technical ammonium sulphate, aluminum fluoride
Plastics
such as HDPE, LDPE, PP and PET
SBI Wholesale of
chemical basic materials and chemicals for the industry (46751)
Exporter Yes
Importer Yes
Goal De
(internationale)handel in chemicaliën, grondstoffen en mineralen.
(International) trade in chemicals, raw materials and minerals.)
Relations
Shareholders CPH
Chemicals Holding B.V.
Amsterdamseweg 204A
1182HL AMSTELVEEN
Netherlands
Registration number: 342312410000
Percentage:
100.00%
Companies on same
address
Vischjager Retail
B.V.
Registration number: 342077950000
Pharmagenerics B.V.
Registration number: 341919930000
Stichting
Derdengelden Pin-Transacties
Registration number: 412172080000
Vischjager Winkels
B.V.
Registration number: 280010140000
Vischjager
Beleggingen B.V.
Registration number: 332736800000
CPH Chemicals
Holding B.V.
Registration number: 342312410000
Stichting Vischjager
I
Registration number: 342770600000
Stichting Vischjager
IV
Registration number: 343648670000
Midway Fastfood B.V.
Registration number: 541443450000
Vereniging van Eigenaars
Leeuwenstraat 45-47/Spoorstraat 38 te
Hilversum
Registration number: 544569750000
Management
Active management A. Shabi (Aboed)
Netherlands
Competence: Fully authorized
Function: General Director
Starting date: 2000-02-10
Date of birth: 1962-03-29, Bagdad, IQ
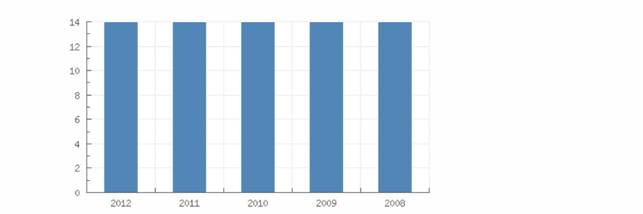
Employees
Year 2012
2011 2010 2009 2008
Total 14
14 14 14 14
Payments
Description Payments
made under regular condition
Key
figures
Year 2011
2010 2009 2008 2007
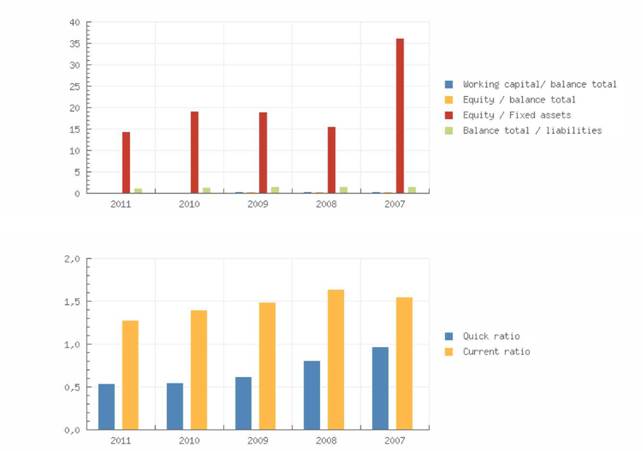
Quick ratio 0,54
0,55 0,62 0,81 0,97
Current ratio 1,28
1,40 1,49 1,64 1,55
Working capital/ balance total 0,21 0,28 0,32 0,38 0,35
Equity / balance total 0,23 0,30 0,34 0,41 0,36
Equity / Fixed assets
14,41 19,16 19,03 15,69 36,27
Equity / liabilities 0,30
0,43 0,52 0,69 0,57
Balance total / liabilities 1,30 1,43
1,52 1,69 1,57
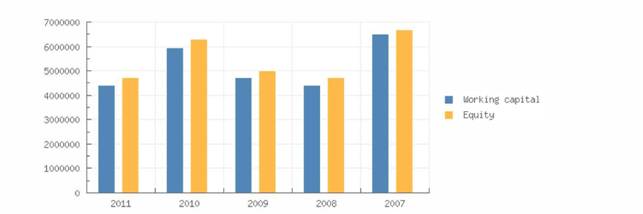
Working capital 4.403.272 5.965.383 4.738.848 4.415.677
6.495.620
Equity 4.731.746
6.293.838 5.001.623 4.716.267 6.679.768
Mutation equity -24,82 25,84 6,05 -29,39
61,82
Mutation short term liabilities 7,74 53,45
40,02 -41,78 40,40
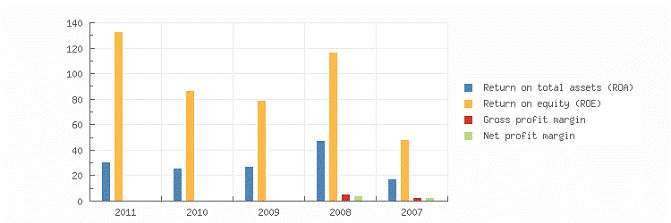
Return on total assets (ROA) 30,52 26,06 27,18 47,66 17,38
Return on equity (ROE) 133,01
87,10 79,40 117,02
48,04
Gross profit margin 5,35
3,14
Net profit margin 4,30
2,54
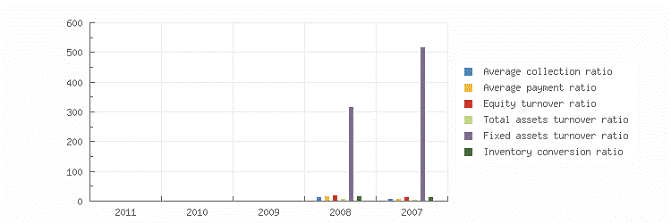
Average collection ratio 13,93
8,11
Average payment ratio
17,50 8,85
Equity turnover ratio 20,27
14,32
Total assets turnover ratio 8,26
5,18
Fixed assets turnover ratio 318,00
519,47
Inventory conversion ratio 16,62
14,08
Turnover 95.588.186 95.659.899
Gross margin 9.422.355
8.302.437 6.559.143 6.668.385
4.394.445
Operating result 6.320.102
5.495.670 3.643.850 5.111.849
3.001.563
Net result after taxes 4.752.933
4.115.336 3.028.668
4.113.284 2.431.708
Cashflow 4.795.505
4.155.483 3.093.438 4.186.096
2.498.273
Gross profit 95.588.186
95.659.899
EBIT 6.320.102
5.495.670 3.643.850 5.111.849
3.001.563
EBITDA 6.362.674
5.535.817 3.708.620 5.184.661 3.068.128
Summary
The 2011 financial result structure is a
positive working capital of 4.403.272 euro, which is in agreement with 21 % of
the total assets of the company.
The working capital has diminished with
-26.19 % compared to previous year. The ratio, with respect to the total assets
of the company has however, declined.
The deterioration between 2010 and 2011 has
mainly been caused by an increase of the current liabilities.
The current ratio of the company in 2011 was
1.28. When the current ratio is below 1.5, the company may have problems
meeting its short-term obligations.
The quick ratio in 2011 of the company was
0.54. A company with a Quick Ratio of less than 1 cannot currently pay back its
current liabilities.
The 2010 financial result structure is a
positive working capital of 5.965.383 euro, which is in agreement with 28 % of
the total assets of the company.
The working capital has increase with 25.88
% compared to previous year. The ratio with respect to the total assets of the
company has however, declined.
The improvement between 2009 and 2010 has
mainly been caused by a current liabilities reduction.
The current ratio of the company in 2010 was
1.4. When the current ratio is below 1.5, the company may have problems meeting
its short-term obligations.
The quick ratio
in 2010 of the company was 0.55. A company with a Quick Ratio of less than 1
cannot currently pay back its current liabilities.
Financial statements
Type of annual account Corporate
Annual account CPH Chemicals B.V.
Amsterdamseweg 204A
1182HL Amstelveen
Netherlands
Registration number: 341207520000
BALANCE SHEET
|
Year |
2011 |
2010 |
2009 |
2008 |
2007 |
|
End date |
2011-12-31 |
2010-12-31 |
2009-12-31 |
2008-12-31 |
2007-12-31 |
|
Tangible
fixed assets |
90.133 |
103.020 |
99.521 |
158.649 |
184.148 |
|
Financial
fixed assets |
238.341 |
225.435 |
163.254 |
141.941 |
|
|
Fixed
assets |
328.474 |
328.455 |
262.775 |
300.590 |
184.148 |
|
Inventories |
11.760.368 |
12.563.578 |
8.426.029 |
5.752.803 |
6.794.042 |
|
Accounts receivable |
7.511.002 |
7.810.422 |
|
4.304.647 |
8.790.867 |
|
Other receivables |
972.524 |
294.164 |
|
1.156.010 |
2.012.860 |
|
Total receivables |
8.483.526 |
8.104.586 |
5.859.641 |
5.460.657 |
10.803.727 |
|
Liquid funds |
46.459 |
42.489 |
62.322 |
64.906 |
686.091 |
|
Current assets |
20.290.353 |
20.710.653 |
14.347.992 |
11.278.366 |
18.283.860 |
|
Total assets |
20.618.827 |
21.039.108 |
14.610.767 |
11.578.956 |
18.468.008 |
|
|
|||||
|
Total equity |
4.731.746 |
6.293.838 |
5.001.623 |
4.716.267 |
6.679.768 |
|
Accounts payable |
5.155.318 |
5.086.696 |
|
3.060.843 |
7.541.673 |
|
Other short term liabilities |
10.731.763 |
9.658.574 |
9.609.144 |
3.801.846 |
4.246.567 |
|
Short term liabilities |
15.887.081 |
14.745.270 |
9.609.144 |
6.862.689 |
11.788.240 |
|
Total short and long term liabilities |
15.887.081 |
14.745.270 |
9.609.144 |
6.862.689 |
11.788.240 |
|
Total liabilities |
20.618.827 |
21.039.108 |
14.610.767 |
11.578.956 |
18.468.008 |
Summary
The total
assets of the company decreased with -2 % between 2010 and 2011.
The total
assets are entirely composed of current assets.
The asset
reduction results in an equity decrease of -24.82 %. Despite the decrease, the
indebtness increased with 7.74 %.
In 2011 the
assets of the company were 1.59 % composed of fixed assets and 98.41 % by
current assets. The assets are being financed by an equity of 22.95 %, and
total debt of 77.05 %.
The total
assets of the company increased with 44 % between 2009 and 2010.
The fixed asset
growth of 24.99 % is lower than the total asset growth.
The asset
growth has mainly been financed by a debt increase of 25.84 %. The Net Worth,
however, grew with 53.45 %.
In 2010 the
assets of the company were 1.56 % composed of fixed assets and 98.44 % by
current assets. The assets are being financed by an equity of 29.91 %, and
total debt of 70.09 %.
PROFIT & LOSS
|
Year |
2011 |
2010 |
2009 |
2008 |
2007 |
|
Revenues |
|
|
|
96.721.682 |
97.070.070 |
|
Other
operating income |
|
|
|
1.133.496 |
1.410.171 |
|
Net
turnover |
|
95.588.186 |
95.659.899 |
||
|
|
|||||
|
Gross
margin |
9.422.355 |
8.302.437 |
6.559.143 |
6.668.385 |
4.394.445 |
|
|
|||||
|
Wages and
salaries |
1.794.331 |
1.678.728 |
1.675.102 |
1.500.951 |
1.653.699 |
|
Amorization
and depreciation |
42.572 |
40.147 |
64.770 |
72.812 |
66.565 |
|
Sales |
|
|
|
88.919.801 |
91.265.454 |
|
other operating costs |
1.265.350 |
1.087.892 |
1.175.421 |
1.116.269 |
1.082.789 |
|
Operating
expenses |
3.102.253 |
2.806.767 |
2.915.293 |
91.609.833 |
94.068.507 |
|
Result in
subsidiaries |
97.906 |
122.181 |
233.754 |
6.147 |
-1.377 |
|
Operating
result |
6.320.102 |
5.495.670 |
3.643.850 |
5.111.849 |
3.001.563 |
|
|
|||||
|
Financial
income |
320.727 |
366.160 |
93.902 |
611.023 |
550.037 |
|
Financial
expenses |
445.072 |
501.890 |
|
209.937 |
341.284 |
|
Financial
result |
-124.345 |
-135.730 |
93.902 |
401.086 |
208.753 |
|
Result
on ordinary operations before taxes |
6.293.663 |
5.482.121 |
3.971.506 |
5.519.082 |
3.208.939 |
|
|
|||||
|
Taxation on
the result of ordinary activities |
1.540.730 |
1.366.785 |
942.838 |
1.405.798 |
777.231 |
|
Result
of ordinary activities after taxes |
4.752.933 |
4.115.336 |
3.028.668 |
4.113.284 |
2.431.708 |
|
|
|||||
|
Net
result |
4.752.933 |
4.115.336 |
3.028.668 |
4.113.284 |
2.431.708 |
Summary
The gross profit of the company grew with 13.49 % between 2010 and 2011.
The operating result of the company grew with 15 % between 2010 and 2011. This evolution implies an increase of the company's economic profitability.
The result of these changes is an increase of the company's Economic Profitability of 17.11 % of the analysed period, being equal to 2010 % in the year 2011.
The Net Result of the company decreased by 15.49 % between 2010 and 2011.
The company's Financial Profitability has been negatively affected by the financial activities in comparison to the EBITs behaviour. The result of these variations is a profitability reduction of 52.71 % of the analysed period, being 133.01 % in the year 2011.
The company's financial structure has slowed down its financial profitability.
The gross profit of the company grew with 26.58 % between 2009 and 2010.
The operating result of the company grew with 50.82 % between 2009 and 2010. This evolution implies an increase of the company's economic profitability.
The result of these changes is a reduction of the company's Economic Profitability of -4.12 % of the analysed period, being equal to 2009 % in the year 2010.
The Net Result of the company decreased by 35.88 % between 2009 and 2010.
The company's Financial Profitability has been positively affected by the financial activities in comparison to the
EBITs behaviour. The result of these variations is a profitability increase of 9.7 % of the analysed period, being 87.1 % in the year 2010.
The company's financial structure
has slowed down its financial profitability.
Analysis
Branch (SBI) Groothandel en
Wholesale on a fee or contract basis (niet in auto’s en
motorfietsen) (46)
Region Groot Amsterdam
In the Netherlands 107516 of the companies
are registered with the SBI code 46
In the region Groot Amsterdam 10265 of the
companies are registered with the SBI code 46
In the Netherlands 2108 of the bankrupcties
are published within this sector
In the region Groot Amsterdam 192 of the
bankruptcies are published within this sector
The risk of this specific sector in the
Netherlands is normal
The risk of this specific sector in the
region Groot Amsterdam is normal
Publications
Filings 27-06-2012: De jaarrekening over 2011 is
gepubliceerd.
09-08-2011: De jaarrekening over 2010 is
gepubliceerd.
16-03-2010: De jaarrekening over 2008 is
gepubliceerd.
Company structure
Relations 5
CPH Chemicals Charitable Priva
Netherlands Antilles
CPH Chemicals Holding B.V.
Amsterdamseweg 204A
1182HL AMSTELVEEN
Netherlands
Registration number: 342312410000
CPH Chemicals B.V.
Amsterdamseweg 204A
1182HL Amstelveen
Netherlands
Registration number: 341207520000
FOREIGN EXCHANGE RATES
|
Currency |
Unit
|
Indian Rupees |
|
US Dollar |
1 |
Rs.62.06 |
|
UK Pound |
1 |
Rs.102.03 |
|
Euro |
1 |
Rs.85.27 |
INFORMATION DETAILS
|
Report
Prepared by : |
MNL |
RATING EXPLANATIONS
|
RATING |
STATUS |
PROPOSED CREDIT LINE |
|
|
>86 |
Aaa |
Possesses an extremely sound financial base with the strongest
capability for timely payment of interest and principal sums |
Unlimited |
|
71-85 |
Aa |
Possesses adequate working capital. No caution needed for credit
transaction. It has above average (strong) capability for payment of interest
and principal sums |
Large |
|
56-70 |
A |
Financial & operational base are regarded healthy. General unfavourable
factors will not cause fatal effect. Satisfactory capability for payment of
interest and principal sums |
Fairly Large |
|
41-55 |
Ba |
Overall operation is considered normal. Capable to meet normal
commitments. |
Satisfactory |
|
26-40 |
B |
Capability to
overcome financial difficulties seems comparatively below average. |
Small |
|
11-25 |
Ca |
Adverse factors are apparent. Repayment of interest and principal sums
in default or expected to be in default upon maturity |
Limited with full
security |
|
<10 |
C |
Absolute credit risk exists. Caution needed to be exercised |
Credit not
recommended |
|
-- |
NB |
New Business |
-- |
This score serves as a reference to assess SC’s credit risk and
to set the amount of credit to be extended. It is calculated from a composite
of weighted scores obtained from each of the major sections of this report. The
assessed factors and their relative weights (as indicated through %) are as
follows:
Financial
condition (40%) Ownership
background (20%) Payment
record (10%)
Credit history
(10%) Market trend
(10%) Operational
size (10%)
This report is issued at your request without any
risk and responsibility on the part of MIRA INFORM PRIVATE LIMITED (MIPL)
or its officials.