MIRA
INFORM REPORT
|
Report Date : |
11.02.2013 |
IDENTIFICATION DETAILS
|
Name : |
BRILLIANT INTERTRADE CO., LTD. |
|
|
|
|
Registered Office : |
13/236 Moo 5, Soi Preecha, Nawamin Road, Klongkum, Buengkum, Bangkok 10240 |
|
|
|
|
Country : |
Thailand |
|
|
|
|
Financials (as on) : |
31.12.2011 |
|
|
|
|
Date of Incorporation : |
29.05.1995 |
|
|
|
|
Com. Reg. No.: |
0105538064033 |
|
|
|
|
Legal Form : |
Private Limited Company |
|
|
|
|
Line of Business : |
Importer & Distributor and Industrial Chemicals |
|
|
|
|
No. of Employees : |
12 |
RATING & COMMENTS
|
MIRA’s Rating : |
B |
|
RATING |
STATUS |
PROPOSED CREDIT LINE |
|
|
26-40 |
B |
Capability to overcome financial difficulties seems comparatively
below average. |
Small |
|
Status : |
Moderate |
|
Payment Behaviour : |
Slow |
|
Litigation : |
Clear |
NOTES :
Any query related to this report can be made
on e-mail: infodept@mirainform.com
while quoting report number, name and date.
ECGC Country Risk Classification List – June 30th, 2012
|
Country Name |
Previous Rating (31.03.2011) |
Current Rating (30.06.2012) |
|
Thailand |
B1 |
B1 |
|
Risk Category |
ECGC
Classification |
|
Insignificant |
A1 |
|
Low |
A2 |
|
Moderate |
B1 |
|
High |
B2 |
|
Very High |
C1 |
|
Restricted |
C2 |
|
Off-credit |
D |
THAILAND - ECONOMIC OVERVIEW
With a well-developed infrastructure, a free-enterprise economy, generally pro-investment policies, and strong export industries, Thailand enjoyed solid growth from 2000 to 2007 - averaging more than 4% per year - as it recovered from the Asian financial crisis of 1997-98. Thai exports - mostly machinery and electronic components, agricultural commodities, and jewelry - continue to drive the economy, accounting for more than half of GDP. The global financial crisis of 2008-09 severely cut Thailand's exports, with most sectors experiencing double-digit drops. In 2009, the economy contracted 2.3%. In 2010, Thailand's economy expanded 7.8%, its fastest pace since 1995, as exports rebounded from their depressed 2009 level. Steady economic growth at just below 4% during the first three quarters of 2011 was interrupted by historic flooding in October and November in the industrial areas north of Bangkok, crippling the manufacturing sector and leading to a revised growth rate of only 0.1% for the year. The industrial sector is poised to recover from the second quarter of 2012 onward, however, and the government anticipates the economy will probably grow between 5.5 and 6.5% for 2012, while private sector forecasts range between 3.8% and 5.7%.
Source
: CIA
Company name
BRILLIANT INTERTRADE CO., LTD.
SAMMARY
ADDRESS : 13/236 MOO
5, SOI PREECHA,
NAWAMIN ROAD,
KLONGKUM, BUENGKUM,
BANGKOK 10240,
THAILAND
TELEPHONE :
[66] 2377-2040, 2734-8462,
081 825-1531
FAX : [66] 2825-1531,
2734-8463
E-MAIL ADDRESS : brillian@bkk2.loxinfo.co.th
REGISTRATION ADDRESS : SAME
AS BUSINESS ADDRESS
ESTABLISHED : 1995
REGISTRATION NO. : 0105538064033 [Former
: [2] 2449/2538]
TAX ID NO. : 3011604328
CAPITAL REGISTERED : BHT.
1,000,000
CAPITAL PAID-UP : BHT.
1,000,000
SHAREHOLDER’S PROPORTION : THAI
: 100%
FISCAL YEAR CLOSING
DATE : DECEMBER 31
LEGAL STATUS : PRIVATE LIMITED
COMPANY
EXECUTIVE : MR.
THAWEEWAT TIANPAIROJ, THAI
MANAGING DIRECTOR
NO. OF STAFF : 12
LINES OF BUSINESS : INDUSTRIAL
CHEMICALS
IMPORTER &
DISTRIBUTOR
CORPORATE PROFILE
OPERATING
TREND : STABLE
PRESENT
SITUATION : OPERATING NORMALLY
REPUTATION : FAIR
WITH NORMAL BUSINESS
ENGAGEMENT
MANAGEMENT
STANDARD : MANAGEMENT WITH
FAIR PERFORMANCE
HISTORY
The subject was
established on May
29, 1995 as
a private limited
company under the
name style BRILLIANT
INTERTRADE CO., LTD., by Thai
Groups, in order to import
and distribute wide
range of industrial
chemicals to local
market. It currently
employs 12 staff.
The subject’s registered address is 13/236 Moo 5, Soi Preecha, Nawamin Rd., Klongkum, Buengkum, Bangkok
10240, and this
is the subject’s
current operation address.
THE BOARD OF
DIRECTORS
|
Name |
|
Nationality |
Age |
|
|
|
|
|
|
Mr. Thaweewat Tianpairoj
|
|
Thai |
55 |
|
Ms. Bang-orn Thangsri
|
|
Thai |
61 |
AUTHORIZED PERSON
One of the
above directors can
sign on behalf
of the subject
with company’s affixed.
MANAGEMENT
Mr. Thaweewat Tianpairoj is
the Managing Director.
He is Thai
nationality with the
age of 55
years old.
Ms. Bang-orn Thangsri is
the Marketing Manager.
She is Thai
nationality with the
age of 61
years old.
BUSINESS OPERATIONS
The subject’s activities
are importer and
distributor wide range
of industrial chemicals mainly
for consumer products, foods,
cosmetic, packaging, pharmaceutical and
automobile industries.
The subject is
also an authorized
agent for the
products as follows:
1. Kalle Nalo
GmbH & Co. KG
- Germany
Products : Casing
·
Artificial Casing
for sausage and
hams
-
Fibrous Casing
-
Cellulose Casing
-
Plastic Casing
·
Sponge
Cloth - Cleaning
2. BK Giulini
Chemie GmbH &
Co., OHG - Germany
Products :
Sodium and Potassium
Group
·
Ingredient
for oral hygiene.
[Toothpaste and mouthwash]
·
Food
Ingredient
·
Meat
Processing
·
Sea Food
·
Dairy
·
Water
and Effluent Treatment
·
Cleaning
3. Johnson Matthey
B.V. - Holland
Products :
Glass Enamel
·
Ceramic
Ink Black [Black
Enamel for Automotive
Windscreen]
·
Silver
Paste [Silver Paste
based conductive paste
and solders]
·
Glass
Enamel for architectural
and appliance glass
4. Klockner Pentaplast
GmbH - Germany
Products :
Rigid PVC Films
[PVC APET and PET - G]
·
Credit Cards
·
Food
and Non - Foods Packaging
·
Blister
Film for Pharmaceutical
·
Furniture
Film
·
Shrink Film
·
Thermoforming
Film for Intel
Product
·
etc.
5. Trespa International
BV. - Holland
Products :
Thermosetting resins panel
for: -
·
Laboratory
·
Construction
·
Furniture
·
Kitchen
·
Toilet
Cubicle
·
etc.
6. NPT - Italy
·
Silicone
sealant
·
Polyurethane
Sealant
7. FSB -
Holland
·
Products : Silicone
for building
8. FIBRAN S.A -
Spain
·
Collagen
Casings
9. Hueck Folien
GmbH & Co. KG. - Germany
·
Flexible
packaging
10. Constantia Hueck Folien
GmbH & Co. KG. - Germany
·
Security
foils
PURCHASE
Most of the
products are imported
from Germany, Holland, Italy,
Spain, U.S.A., Republic of China,
Taiwan, India, United Kingdom, France and Korea, and
the rest is
purchased from local
suppliers.
SALES [LOCAL]
100% of its
products is sold
locally to manufacturers, wholesalers
and end-users.
MAJOR CUSTOMERS
|
Name |
Country |
|
C P Group of
Companies |
: Thailand |
|
Colgate Palmolive [Thailand]
Ltd. |
: Thailand |
|
Unilever Thai Holding
Co., Ltd. |
: Thailand |
SUBSIDIARY AND
AFFILIATED COMPANY
The subject is
not found to
have any subsidiary
or affiliated company
here in Thailand.
LITIGATION
Bankruptcy and Receivership
There are no
litigation on bankruptcy
and receivership cases
filed against the
subject found at
Legal Execution Department
for the past
five years.
Others
There are no
legal suits filed against
the subject for
the past two
years.
CREDIT
Sales are by
cash or on
the credits term
of 30-60 days.
Local bills are
paid by cash
or on the
credits term of
30-60 days.
Imports are by
T/T.
BANKING
The Siam Commercial
Bank Public Co.,
Ltd.
[Ram-Indra Branch : 66/99 Ramindra
Rd., Tharaeng, Bangkhen,
Bangkok 10220]
EMPLOYMENT
The subject employs
12 staff. [office
and sales staff]
LOCATION DETAILS
The premise is
owned for administrative office in a 2
storey single house
at the heading
address. Premise is
located in a
prime residential area.
Warehouse is located at Amata
City Industrial Estate,
Bangpakong, Chachoengsao.
COMMENT
The subject is engaged in importing and distributing of industrial chemicals and supplies. Its business had grown moderately during the past years. The subject started increasing its sales in 2011, while its business in 2012 was positive from an increase in demand of the products from various industries
FINANCIAL INFORMATION
The capital was registered
at Bht. 1,000,000 divided
into 10,000 shares of
Bht. 100 each
with fully paid.
THE SHAEHOLDERS LISTED
WERE : [as of April 30,
2012]
|
NAME |
HOLDING |
% |
|
Mr. Thaweewat Tianpairoj Nationality: Thai Address : 13/236 Moo 5,
Nawamin Rd., Klongkum,
Buengkum, Bangkok |
5,000 |
50.00 |
|
Ms. Bang-orn Thangsri Nationality: Thai Address : 89/315 Moo 5
Nawamin Rd., Klongkum,
Buengkum, Bangkok |
3,750 |
37.50 |
|
Mrs. Jureerat Wongvisetnoppakun Nationality: Thai Address : 192 Suthisarn
Rd., Dindaeng, Huaykwang, Bangkok 10320 |
250 |
2.50 |
|
Mr. Kamthorn Tianpairoj Nationality: Thai Address : 3 Suthisarn
Rd., Samsennai, Phyathai, Bangkok 10400 |
250 |
2.50 |
|
Mrs. Aree Thungsri Nationality: Thai Address : 71/171 Moo 5,
Nawamin Rd., Klongkum, Buengkum, Bangkok |
250 |
2.50 |
|
Mr. Cherdsak Thungsri Nationality: Thai Address : 200/19 Moo 3,
Nawamin Rd., Klongkum,
Buengkum, Bangkok |
250 |
2.50 |
|
Mr. Veera Maiteng Nationality: Thai Address : 89/819 Moo 5, Nawamin Rd.,
Klongkum,
Buengkum, Bangkok |
250 |
2.50 |
Total Shareholders :
7
Share Structure [as
at April 30,
2012]
|
Nationality |
Shareholders |
No. of Share |
% Shares |
|
|
|
|
|
|
Thai |
7 |
10,000 |
100.00 |
|
Foreign |
- |
- |
- |
|
Total |
7 |
10,000 |
100.00 |
NAME OF AUDITOR &
CERTIFIED PUBLIC ACCOUNTANT
NO.:
Mr. Siripong Supatranand
No. 5060
BALANCE SHEET [BAHT]
The latest financial figures published
as at December
31, 2011, 2010
& 2009 were:
ASSETS
|
Current Assets |
2011 |
2010 |
2009 |
|
|
|
|
|
|
Cash and Cash Equivalents
|
142,782.29 |
107,105.03 |
2,179,599.04 |
|
Trade Accounts & Other Receivable |
4,935,808.10 |
5,009,999.04 |
3,521,919.59 |
|
Short-term Loan |
1,342,122.38 |
1,342,122.38 |
- |
|
Inventories |
1,209,993.13 |
1,074,947.80 |
1,091,500.53 |
|
Loan to Director
and Employees |
- |
- |
4,342,122.38 |
|
Other Current Assets
|
44,285.23 |
90,999.77 |
243,174.26 |
|
|
|
|
|
|
Total Current Assets
|
7,674,991.13 |
7,625,174.02 |
11,378,315.80 |
|
Fixed Deposit pledged as
a Collateral |
1,540,675.05 |
1,527,818.45 |
1,520,293.00 |
|
Fixed Assets |
7,272,292.26 |
8,641,168.30 |
5,784,845.28 |
|
Other Non-current Assets |
27,141.74 |
27,141.74 |
22,803.74 |
|
Total Assets |
16,515,100.18 |
17,821,302.51 |
18,706,257.82 |
LIABILITIES &
SHAREHOLDERS' EQUITY [BAHT]
|
Current
Liabilities |
2011 |
2010 |
2009 |
|
|
|
|
|
|
Bank Overdraft |
816,199.43 |
1,532,728.31 |
1,143,377.42 |
|
Trade Accounts &
Other Payable |
8,711,123.51 |
8,593,920.88 |
3,609,236.61 |
|
Current Portion of
Hire-purchase Payable |
753,658.71 |
856,000.58 |
327,585.31 |
|
Accrued Commission Fee |
- |
- |
4,051,170.95 |
|
Accrued Income Tax |
222,756.52 |
124,260.65 |
22,201.96 |
|
Other Current Liabilities |
- |
- |
924,649.84 |
|
|
|
|
|
|
Total Current Liabilities |
10,503,738.17 |
11,106,910.42 |
10,078,222.09 |
|
Hire-purchase Payable- Net |
1,735,814.40 |
2,509,898.07 |
877,696.12 |
|
Total Liabilities |
12,239,552.57 |
13,616,808.49 |
10,955,918.21 |
|
|
|
|
|
|
Shareholders' Equity |
|
|
|
|
|
|
|
|
|
Share capital : Baht 100
par value authorized, issued
and fully paid share
capital 10,000 shares |
1,000,000.00 |
1,000,000.00 |
1,000,000.00 |
|
|
|
|
|
|
Capital Paid |
1,000,000.00 |
1,000,000.00 |
1,000,000.00 |
|
Retained Earning Appropriated for
Statutory Reserve |
100,000.00 |
100,000.00 |
- |
|
Unappropriated |
3,175,547.61 |
3,104,494.02 |
6,750,339.61 |
|
Total Shareholders' Equity |
4,275,547.61 |
4,204,494.02 |
7,750,339.61 |
|
Total Liabilities & Shareholders' Equity |
16,515,100.18 |
17,821,302.51 |
18,706,257.82 |
PROFIT &
LOSS ACCOUNT
|
Revenue |
2011 |
2010 |
2009 |
|
|
|
|
|
|
Sales |
29,470,230.46 |
26,628,059.37 |
23,909,606.62 |
|
Other Income |
1,882,253.81 |
1,330,031.02 |
153,878.26 |
|
Total Revenues |
31,352,484.27 |
27,958,090.39 |
24,063,484.88 |
|
Expenses |
|
|
|
|
|
|
|
|
|
Cost of Goods
Sold |
18,263,738.27 |
16,438,204.29 |
14,818,193.50 |
|
Selling Expenses |
6,874,394.05 |
6,113,246.99 |
2,481,797.96 |
|
Administrative Expenses |
5,624,871.95 |
4,605,255.50 |
6,153,787.53 |
|
Total Expenses |
30,763,004.27 |
27,156,706.78 |
23,453,778.99 |
|
|
|
|
|
|
Profit before Financial
Cost & Income Tax |
589,480.00 |
801,383.61 |
609,705.89 |
|
Financial Cost |
[201,700.73] |
[165,124.58] |
[48,760.35] |
|
Profit before Income
Tax |
387,779.27 |
636,259.03 |
560,945.54 |
|
Income Tax |
[316,725.68] |
[182,104.62] |
[70,421.89] |
|
Net Profit / [Loss] |
71,053.59 |
454,154.41 |
490,523.65 |
FINANCIAL ANALYSIS
|
ITEM |
UNIT |
2011 |
2010 |
2009 |
|
|
|
|
|
|
|
LIQUIDITY RATIO |
|
|
|
|
|
CURRENT RATIO |
TIMES |
0.73 |
0.69 |
1.13 |
|
QUICK RATIO |
TIMES |
0.61 |
0.58 |
1.00 |
|
|
|
|
|
|
|
ACTIVITY RATIO |
|
|
|
|
|
FIXED ASSETS TURNOVER |
TIMES |
4.05 |
3.08 |
4.13 |
|
TOTAL ASSETS TURNOVER |
TIMES |
1.78 |
1.49 |
1.28 |
|
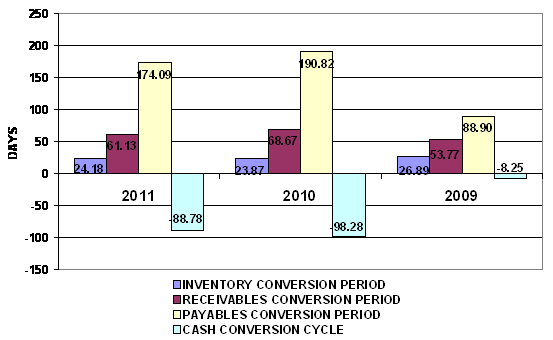
INVENTORY CONVERSION PERIOD |
DAYS |
24.18 |
23.87 |
26.89 |
|
INVENTORY TURNOVER |
TIMES |
15.09 |
15.29 |
13.58 |
|
RECEIVABLES CONVERSION PERIOD |
DAYS |
61.13 |
68.67 |
53.77 |
|
RECEIVABLES TURNOVER |
TIMES |
5.97 |
5.31 |
6.79 |
|
PAYABLES CONVERSION PERIOD |
DAYS |
174.09 |
190.82 |
88.90 |
|
CASH CONVERSION CYCLE |
DAYS |
(88.78) |
(98.28) |
(8.25) |
|
|
|
|
|
|
|
PROFITABILITY
RATIO |
|
|
|
|
|
COST OF GOODS SOLD |
% |
61.97 |
61.73 |
61.98 |
|
SELLING & ADMINISTRATION |
% |
42.41 |
40.25 |
36.12 |
|
INTEREST |
% |
0.68 |
0.62 |
0.20 |
|
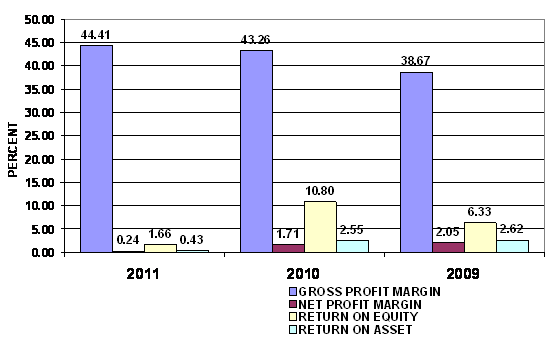
GROSS PROFIT MARGIN |
% |
44.41 |
43.26 |
38.67 |
|
NET PROFIT MARGIN BEFORE EX. ITEM |
% |
2.00 |
3.01 |
2.55 |
|
NET PROFIT MARGIN |
% |
0.24 |
1.71 |
2.05 |
|
RETURN ON EQUITY |
% |
1.66 |
10.80 |
6.33 |
|
RETURN ON ASSET |
% |
0.43 |
2.55 |
2.62 |
|
EARNING PER SHARE |
BAHT |
7.11 |
45.42 |
49.05 |
|
|
|
|
|
|
|
LEVERAGE RATIO |
|
|
|
|
|
DEBT RATIO |
TIMES |
0.74 |
0.76 |
0.59 |
|
DEBT TO EQUITY RATIO |
TIMES |
2.86 |
3.24 |
1.41 |
|
TIME INTEREST EARNED |
TIMES |
2.92 |
4.85 |
12.50 |
|
|
|
|
|
|
|
ANNUAL GROWTH |
|
|
|
|
|
SALES GROWTH |
% |
10.67 |
11.37 |
|
|
OPERATING PROFIT |
% |
(26.44) |
31.44 |
|
|
NET PROFIT |
% |
(84.35) |
(7.41) |
|
|
FIXED ASSETS |
% |
(15.84) |
49.38 |
|
|
TOTAL ASSETS |
% |
(7.33) |
(4.73) |
|
ANNUAL GROWTH :
RISKY
An annual sales growth is 10.67%. Turnover has increased from THB
PROFITABILITY :
ACCEPTABLE
PROFITABILITY
RATIO
|
Gross Profit Margin |
44.41 |
Impressive |
Industrial
Average |
12.07 |
|
Net Profit Margin |
0.24 |
Deteriorated |
Industrial
Average |
1.82 |
|
Return on Assets |
0.43 |
Deteriorated |
Industrial
Average |
4.28 |
|
Return on Equity |
1.66 |
Deteriorated |
Industrial
Average |
11.66 |
Gross Profit Margin used to assess a firm's financial health by
revealing the proportion of money left over from revenues after accounting for
the cost of goods sold. Gross profit margin serves as the source for paying
additional expenses and future savings. The company’s figure is 44.41%. When
compared with the industry average, the ratio of the company was higher,
indicated that company was more profitable than the same industry.
Net Profit Margin is the indicator of the company's efficiency in that
net profit takes into consideration all expenses of the company. A low profit
margin indicates a low margin of safety, higher risk that a decline in sales
will erase profits and result in a net loss. The company's figure is 0.24%.
When compared with the industry average, the ratio of the company was lower.
Return on Assets measures how efficiently profits are being generated
from the assets employed in the business when compared with the ratios of firms
in a similar business. A low ratio in comparison with industry averages indicates
an inefficient use of business assets. When compared with the industry average,
it was lower, the company's figure is 0.43%.
Return on Equity indicates how profitable a company is by comparing its
net income to its average shareholders' equity, ROE measures how much the
shareholders earned for their investment in the company. When compared with the
industry average, it was lower, the company's figure is 1.66%.
Trend of the
average competitors in the same industry for last 5 years
Return on Assets Uptrend
Return on Equity Uptrend
LIQUIDITY :
ACCEPTABLE

LIQUIDITY RATIO
|
Current Ratio |
0.73 |
Risky |
Industrial
Average |
1.50 |
|
Quick Ratio |
0.61 |
|
|
|
|
Cash Conversion Cycle |
(88.78) |
|
|
|
The Current Ratio is to ascertain whether a company's short-term assets
are readily available to pay off its short-term liabilities. The company's
figure is 0.73 times in 2011, increased from 0.69 times, then the company may
not be efficiently using its current assets. When compared with the industry
average, the ratio of the company was lower.
The Quick Ratio is a liquidity indicator that further refines the
current ratio by measuring the amount of the most liquid current assets there
are to cover current liabilities. The company's figure is 0.61 times in 2011,
increased from 0.58 times, then the company has not enough current assets that
presumably can be quickly converted to cash for pay financial obligations.
The Cash Conversion Cycle measures the number of days a company's cash
is tied up in the production and sales process of its operations and the
benefit from payment terms from its creditors. It meant the company could
survive when no cash inflow was received from sale for -89 days.
Trend of the
average competitors in the same industry for last 5 years
Current Ratio Uptrend
LEVERAGE :
ACCEPTABLE


LEVERAGE RATIO
|
Debt Ratio |
0.74 |
Acceptable |
Industrial
Average |
0.58 |
|
Debt to Equity Ratio |
2.86 |
Risky |
Industrial
Average |
1.51 |
|
Times Interest Earned |
2.92 |
Satisfactory |
Industrial
Average |
3.36 |
Debt to Equity Ratio a measurement of how much suppliers, lenders,
creditors and obligors have committed to the company versus what the
shareholders have committed. A lower the percentage means that the company is
using less leverage and has a stronger equity position.
Times Interest Earned measuring a company's ability to meet its debt
obligations. Ratio is 2.93 higher than 1, so the company can pay interest
expenses on outstanding debt.
Debt Ratio shows the proportion of a company's assets which are financed
through debt. The company's figure is 0.74 greater than 0.5, most of the
company's assets are financed through debt.
Trend of the
average competitors in the same industry for last 5 years
Debt Ratio Downtrend
Times Interest Earned Uptrend
ACTIVITY :
SATISFACTORY
ACTIVITY RATIO
|
Fixed Assets Turnover |
4.05 |
Deteriorated |
Industrial
Average |
10.00 |
|
Total Assets Turnover |
1.78 |
Satisfactory |
Industrial
Average |
2.32 |
|
Inventory Conversion Period |
24.18 |
|
|
|
|
Inventory Turnover |
15.09 |
Impressive |
Industrial
Average |
6.90 |
|
Receivables Conversion Period |
61.13 |
|
|
|
|
Receivables Turnover |
5.97 |
Impressive |
Industrial
Average |
4.46 |
|
Payables Conversion Period |
174.09 |
|
|
|
The company's Account Receivable Ratio is calculated as 5.97 and
Inventory Turnover in Days Ratio indicates the liquidity of inventory.
It estimates the number of days that it will take to sell the current
inventory. Inventory is particularly sensitive to change in business
activities. The inventory turnover in days is
24 days in 2011, same
figure as in
2010. And Inventory turnover has decreased from 15.29 times in year 2010
to 15.09 times in year 2011.
The company's Total Asset Turnover is calculated as 1.78 times and 1.49
times in 2011 and 2010 respectively. This ratio is determined by dividing total
assets into total sales turnover. The ratio measures the activity of the assets
and the ability of the firm to generate sales through the use of the assets.
Trend of the
average competitors in the same industry for last 5 years
Fixed Assets Turnover Downtrend
Total Assets Turnover Downtrend
Inventory Turnover Downtrend
Receivables Turnover Uptrend
FOREIGN EXCHANGE RATES
|
Currency |
Unit
|
Indian Rupees |
|
US Dollar |
1 |
Rs.53.57 |
|
|
1 |
Rs.71.79 |
|
Euro |
1 |
Rs.84.25 |
INFORMATION DETAILS
|
Report
Prepared by : |
PRL |
RATING EXPLANATIONS
|
RATING |
STATUS |
PROPOSED CREDIT LINE |
|
|
>86 |
Aaa |
Possesses an extremely sound financial base with the strongest
capability for timely payment of interest and principal sums |
Unlimited |
|
71-85 |
Aa |
Possesses adequate working capital. No caution needed for credit
transaction. It has above average (strong) capability for payment of interest
and principal sums |
Large |
|
56-70 |
A |
Financial & operational base are regarded healthy. General
unfavourable factors will not cause fatal effect. Satisfactory capability for
payment of interest and principal sums |
Fairly Large |
|
41-55 |
Ba |
Overall operation is considered normal. Capable to meet normal
commitments. |
Satisfactory |
|
26-40 |
B |
Capability to overcome financial difficulties seems comparatively
below average. |
Small |
|
11-25 |
Ca |
Adverse factors are apparent. Repayment of interest and principal sums
in default or expected to be in default upon maturity |
Limited with
full security |
|
<10 |
C |
Absolute credit risk exists. Caution needed to be exercised |
Credit not
recommended |
|
-- |
NB |
New Business |
-- |
This score serves as a reference to assess SC’s credit risk
and to set the amount of credit to be extended. It is calculated from a
composite of weighted scores obtained from each of the major sections of this
report. The assessed factors and their relative weights (as indicated through
%) are as follows:
Financial
condition (40%) Ownership
background (20%) Payment
record (10%)
Credit history
(10%) Market trend
(10%) Operational
size (10%)
This report is issued at your request without any
risk and responsibility on the part of MIRA INFORM PRIVATE LIMITED (MIPL)
or its officials.