MIRA
INFORM REPORT
|
Report Date : |
19.02.2013 |
IDENTIFICATION DETAILS
|
Name : |
BANGKOK PACIFIC STEEL COMPANY LIMITED |
|
|
|
|
Registered Office : |
259 Moo 11, Soi S. Thaiseree 2, Suksawad Road, Naiklongbangplakod, Phrasamutjaedee, Samutprakarn 10290 |
|
|
|
|
Country : |
Thailand |
|
|
|
|
Financials (as on) : |
31.12.2011 |
|
|
|
|
Date of Incorporation : |
18.02.1981 |
|
|
|
|
Com. Reg. No.: |
0105524010211 |
|
|
|
|
Legal Form : |
Private Limited Company |
|
|
|
|
Line of Business : |
Manufacturer, Importer and Distributor of Steel Supplies and Services |
|
|
|
|
No. of Employees : |
450 |
RATING & COMMENTS
|
MIRA’s Rating : |
Ba |
|
RATING |
STATUS |
PROPOSED CREDIT LINE |
|
|
41-55 |
Ba |
Overall operation is considered normal. Capable to meet normal
commitments. |
Satisfactory |
|
Status : |
Satisfactory |
|
Payment Behaviour : |
No Complaints |
|
Litigation : |
Clear |
NOTES :
Any query related to this report can be made
on e-mail: infodept@mirainform.com
while quoting report number, name and date.
ECGC Country Risk Classification List – June 30th, 2012
|
Country Name |
Previous Rating (31.03.2011) |
Current Rating (30.06.2012) |
|
Thailand |
B1 |
B1 |
|
Risk Category |
ECGC
Classification |
|
Insignificant |
A1 |
|
Low |
A2 |
|
Moderate |
B1 |
|
High |
B2 |
|
Very High |
C1 |
|
Restricted |
C2 |
|
Off-credit |
D |
THAILAND - ECONOMIC OVERVIEW
With a well-developed infrastructure, a free-enterprise economy, generally pro-investment policies, and strong export industries, Thailand enjoyed solid growth from 2000 to 2007 - averaging more than 4% per year - as it recovered from the Asian financial crisis of 1997-98. Thai exports - mostly machinery and electronic components, agricultural commodities, and jewelry - continue to drive the economy, accounting for more than half of GDP. The global financial crisis of 2008-09 severely cut Thailand's exports, with most sectors experiencing double-digit drops. In 2009, the economy contracted 2.3%. In 2010, Thailand's economy expanded 7.8%, its fastest pace since 1995, as exports rebounded from their depressed 2009 level. Steady economic growth at just below 4% during the first three quarters of 2011 was interrupted by historic flooding in October and November in the industrial areas north of Bangkok, crippling the manufacturing sector and leading to a revised growth rate of only 0.1% for the year. The industrial sector is poised to recover from the second quarter of 2012 onward, however, and the government anticipates the economy will probably grow between 5.5 and 6.5% for 2012, while private sector forecasts range between 3.8% and 5.7%.
Source
: CIA
Company name
BANGKOK
PACIFIC STEEL COMPANY
LIMITED
SUMMARY
BUSINESS
ADDRESS : 259
MOO 11, SOI
S. THAISEREE 2,
SUKSAWAD ROAD,
NAIKLONGBANGPLAKOD,
PHRASAMUTJAEDEE, SAMUTPRAKARN
10290,
THAILAND
TELEPHONE : [66] 2425-1000
FAX :
[66] 2425-8299,
2425-0111
E-MAIL
ADDRESS : info@bpssteel.com
customer@bpssteel.com
REGISTRATION
ADDRESS : SAME
AS BUSINESS ADDRESS
ESTABLISHED
: 1981
REGISTRATION
NO. : 0105524010211 [Former : 1021/2524]
TAX
ID NO. : 3101131635
CAPITAL REGISTERED : BHT. 120,000,000
CAPITAL PAID-UP : BHT.
120,000,000
SHAREHOLDER’S PROPORTION : THAI :
100%
FISCAL YEAR CLOSING DATE : DECEMBER 31
LEGAL
STATUS : PRIVATE LIMITED
COMPANY
EXECUTIVE : MR.
BUNCHA KITTIRATANAVIVAT, THAI
MANAGING DIRECTOR
NO.
OF STAFF : 450
LINES
OF BUSINESS : STEEL
SUPPLIES AND SERVICES
MANUFACTURER, IMPORTER
AND DISTRIBUTOR
CORPORATE PROFILE
OPERATING
TREND : STABLE
PRESENT
SITUATION : OPERATING NORMALLY
REPUTATION : GOOD
WITH NORMAL BUSINESS
ENGAGEMENT
MANAGEMENT
STANDARD : MANAGEMENT WITH
GOOD PERFORMANCE
HISTORY
The
subject was established
on February 18,
1981 as a
private limited company
under the name
style BANGKOK PACIFIC STEEL
COMPANY LIMITED by Thai
groups, with the
business objective to
supply and service of steel processing
products. It currently
employs approximate 450
staff.
It achieved the standard ISO 9001 : 2000 and
ISO 14001 : 2004 certificates, for
production quality management
and environmental quality
management, on December
14, 2001 and
March 1, 2006,
respectively.
The
subject’s registered address
is 259 Moo
11, Soi S.
Thaiseree 2, Suksawad
Rd., Naiklongbangplakod, Phrasamutjaedee, Samutprakarn
10290, and this
is the subject’s
current operation address.
THE BOARD
OF DIRECTORS
|
Name |
|
Nationality |
Age |
|
|
|
|
|
|
Mr. Buncha Kittiratanavivat |
[x] |
Thai |
65 |
|
Mr. Kavee Hassadinpaisal |
[x] |
Thai |
69 |
|
Mr. Pichit Uasakulkiat |
[x] |
Thai |
70 |
|
Mr. Manop Niramittham |
|
Thai |
54 |
|
Mr. Somchai Siri-ariyaporn |
|
Thai |
53 |
AUTHORIZED PERSON
Any two of
the mentioned directors [x] can jointly
sign or one
of the directors [x]
can jointly sign
with one of
the rest directors
on behalf of
the subject with
company’s affixed.
MANAGEMENT
Mr. Buncha Kittiratanavivat is
the Managing Director.
He is Thai
nationality with the
age of 65
years old.
Mr. Somrith Phaothavee is
the Sales &
Marketing Manager.
He is Thai
nationality.
Mr. Sombat Techarojvivat is
the Factory Manager.
He is Thai
nationality.
Ms. Ruanjai Suriyaprapai is
the Export Sales
Manager.
She is Thai
nationality.
Mr. Veeradej Siri-ariyaporn is
the Assistant Managing
Director.
He is Thai
nationality.
BUSINESS OPERATIONS
The subject is engaged in
importing and distributing
wide range of steel
products, including EI-lamination
cores, motors cores,
electrical parts & auto parts,
as well as
providing complete range
of steel processing
center [slitting & stamping]
for electrical and
electronic appliance industries.
Range of products
and services are
as follows:
- Electrical
Steel [non-grain and grain
oriented electrical steel],
- Non-Electrical
Steel [cold rolled steel & other metal
sheets],
- Press
3.1
EL-lamination
such as motor
core, large and
medium rotating machines,
general
use A.C. motors,
harmetical motors, small
motors and intermittent
service A.C.
motors
3.2
Parts
such as electrical
parts, automobile parts,
frame
3.3
Progressive
die
4.
Services
4.1 Slitting
4.2 Shearing
4.3 Press
4.4 Die maintenance
One efficient factory
features four production
lines with production
power of 20,000
tons a month,
and a steel
factory for accumulators
and motors features
two production lines
with production power
of 6,000 tons
a month.
PURCHASE
Raw materials are
purchased from suppliers
and agents both
local and overseas,
mainly in Japan,
Australia, Singapore, Taiwan,
Republic of China,
Germany and India.
MAJOR SUPPLIER
Guangfeng Steel Industry
Co., Ltd. :
Republic of China
SALES
90% of the
products is sold
and serviced locally
by wholesale to
manufacturers and end-users.
EXPORT
10% of the
products is exported to
Japan, Malaysia, Taiwan,
Singapore, Indonesia and
Germany.
RELATED AND
AFFILIATED COMPANIES
Bangkok Taiyo Springs
Co., Ltd.
Business Type :
Metal stamping service
provider
World Steel Pallet
Co., Ltd.
Business Type :
Manufacturer of steel
pallets
LITIGATION
Bankruptcy and Receivership
There are no
litigation on bankruptcy
and receivership cases
filed against the
subject found at
Legal Execution Department
for the past
five years.
Others
There are no
legal suits filed
against the subject
for the past
two years.
CREDIT
Sales are by
cash or on the credits
term of 30-60
days.
Local bills are
paid by cash
or on the
credits term of
30-60 days.
Imports are by
L/C at sight
or T/T.
Exports are against
T/T.
BANKING
Bangkok Bank Public
Co., Ltd.
Kasikornbank Public Co.,
Ltd.
Bank of Ayudhya
Public Co., Ltd.
EMPLOYMENT
The
subject employs approximately
450 staff.
LOCATION DETAILS
The
premise is owned
for administrative office,
factory and warehouse
at the heading
address. Premise is
located in industrial
area.
Property
:
Land
area : 48,000 Square
meters
Office
area :
2,520 Square meters
Factory
area : 16,500 Square
meters
Warehouse
area :
4,120 Square meters
Branch
office:
BPS Bldg., 3
Sukhumvit 63 Rd.,
Klongtonnua, Wattana, Bangkok
10110.
Tel.:
[66] 2714-2055-63, Fax:
[66] 2714-2063-4
COMMENT
The subject
has been well accepted
as a steel
leading center from
steel suppliers in
Thailand, which service lines including slitting and stamping for
factories of electrical, electronic
appliances and automotive
industry.
Growth
of industrial sector
and investment has
significantly increased demand
of steel supplies and
services.
FINANCIAL INFORMATION
The
capital was registered
at Bht. 4,000,000 divided
into 40,000 shares of
Bht. 100 each.
The
capital was increased
later as following:
Bht. 10,000,000
on October 24,
1983
Bht. 30,000,000
on November 8, 1989
Bht. 120,000,000
on November 10,
1997
The latest registered capital was increased
to Bht. 120,000,000 divided into 1,200,000 shares
of Bht. 100
each with fully
paid.
MAIN
SHAREHOLDERS : [as
at April 30,
2012]
|
NAME |
HOLDING |
% |
|
|
|
|
|
Mr. Buncha Kittiratanavivat Nationality: Thai Address : 244/1
Sukhumvit 55 Rd.,
Klongtonnua,
Wattana, Bangkok |
180,000 |
15.00 |
|
Mr. Kavee Hassadinpaisal Nationality: Thai Address : 411/1
Chakrapadpong Rd., Mahanark,
Pomprab, Bangkok |
156,000 |
13.00 |
|
Mrs. Yaowalak Kittiratanavivat Nationality: Thai Address : 244/1
Sukhumvit 55 Rd.,
Klongtonnua,
Wattana, Bangkok |
120,000 |
10.00 |
|
Mr. Arnat Kittiratanavivat Nationality: Thai Address : 244/1
Sukhumvit 55 Rd.,
Klongtonnua,
Wattana, Bangkok |
96,000 |
8.00 |
|
Mr. Pichit Uasakulkiat Nationality: Thai Address : 99/442
Nonsee Rd., Chongnonsi,
Yannawa, Bangkok |
72,000 |
6.00 |
|
Mr. Lersak Inchai Nationality: Thai Address : 513/27
Charoenkrung Rd., Bangklo,
Bangkorlaem, Bangkok |
48,000 |
4.00 |
|
Mrs. Sunee Kittiratanavivat Nationality: Thai Address : 383/181-182
Chakrapadpong Rd.,
Klongmahanark, Pomprab, Bangkok |
48,000 |
4.00 |
|
Mrs. Mallika Kanchanachaiphum Nationality: Thai Address : 797
Soi Pattanakarn 74,
Pravet, Bangkok |
48,000 |
4.00 |
|
Ms. Mathana Kittiratanavivat Nationality: Thai Address : 244/1
Soi Sukhumvit 55,
Klongtonnua,
Wattana, Bangkok |
48,000 |
4.00 |
|
Others |
384,000 |
32.00 |
Total Shareholders : 25
Share Structure [as
at April 30,
2012]
|
Nationality |
Shareholders |
No. of Share |
% Shares |
|
|
|
|
|
|
Thai |
25 |
1,200,000 |
100.00 |
|
Foreign |
- |
- |
- |
|
Total |
25 |
1,200,000 |
100.00 |
NAME OF AUDITOR
& CERTIFIED PUBLIC ACCOUNTANT NO. :
Mr. Paphaprot Phuprasert No.
4176
BALANCE SHEET [BAHT]
The
latest financial figures
published for December
31, 2011, 2010
& 2009 were:
ASSETS
|
Current Assets |
2011 |
2010 |
2009 |
|
|
|
|
|
|
Cash and Cash
Equivalent |
462,004,151 |
472,238,478 |
157,532,970 |
|
Trade Accounts &
Other Receivable |
569,284,787 |
596,843,193 |
541,437,583 |
|
Inventories |
953,779,811 |
941,657,987 |
858,510,815 |
|
Other Current Assets
|
11,025,114 |
12,598,940 |
29,312,242 |
|
|
|
|
|
|
Total Current Assets
|
1,996,093,863 |
2,023,338,598 |
1,586,793,610 |
|
Cash at Bank
pledged as a
Collateral |
17,100,000 |
17,100,000 |
17,100,000 |
|
Long-term Investment |
34,850,000 |
34,850,000 |
34,850,000 |
|
Fixed Assets |
217,586,136 |
192,599,545 |
220,654,140 |
|
Other Non-current Assets |
1,991,194 |
2,738,266 |
1,255,048 |
|
Total Assets |
2,267,621,193 |
2,270,626,409 |
1,860,652,798 |
LIABILITIES &
SHAREHOLDERS' EQUITY [BAHT]
|
Current
Liabilities |
2011 |
2010 |
2009 |
|
|
|
|
|
|
Bank Overdraft |
6,682,393 |
2,633,311 |
467,071 |
|
Short-term Loan |
- |
40,000,000 |
180,000,000 |
|
Trade Accounts Payable
under Trust Receipt
Agreement |
720,289,592 |
691,057,873 |
381,968,155 |
|
Trade Accounts Receivable
and Other |
179,176,295 |
293,325,200 |
188,546,894 |
|
Accrued Expenses |
- |
- |
52,356,659 |
|
Accrued Income Tax |
33,468,347 |
48,792,166 |
- |
|
Other Current Liabilities |
26,924,832 |
24,747,421 |
23,423,282 |
|
|
|
|
|
|
Total Current Liabilities |
966,541,459 |
1,100,555,971 |
826,762,061 |
|
Employee Benefits Obligation |
10,296,666 |
- |
- |
|
Total Liabilities |
976,838,125 |
1,100,555,971 |
826,762,061 |
|
|
|
|
|
|
Shareholders' Equity |
|
|
|
|
|
|
|
|
|
Share capital : Baht 100
par value authorized, issued
and fully paid share
capital 1,200,000 shares |
120,000,000 |
120,000,000 |
120,000,000 |
|
|
|
|
|
|
Capital Paid |
120,000,000 |
120,000,000 |
120,000,000 |
|
Retained Earning Appropriated for Statutory
Reserve |
12,000,000 |
12,000,000 |
12,000,000 |
|
Unappropriated |
1,158,783,068 |
1,038,070,438 |
901,890,737 |
|
Total Shareholders' Equity |
1,290,783,068 |
1,170,070,438 |
1,033,890,737 |
|
Total Liabilities &
Shareholders' Equity |
2,267,621,193 |
2,270,626,409 |
1,860,652,798 |
PROFIT &
LOSS ACCOUNT
|
Revenue |
2011 |
2010 |
2009 |
|
|
|
|
|
|
Sales |
3,105,237,077 |
2,728,354,884 |
2,369,486,108 |
|
Service Income |
150,585,440 |
155,510,763 |
118,998,024 |
|
Other Income |
46,739,957 |
77,770,322 |
38,635,268 |
|
Total Revenues |
3,302,562,474 |
2,961,635,969 |
2,527,119,400 |
|
Expenses |
|
|
|
|
|
|
|
|
|
Cost of Goods
Sold & Service
|
2,666,110,645 |
2,397,309,613 |
2,153,728,417 |
|
Selling Expenses |
104,364,912 |
94,323,831 |
81,484,927 |
|
Administrative Expenses |
269,401,293 |
228,818,751 |
221,785,675 |
|
Total Expenses |
3,039,876,850 |
2,720,452,195 |
2,456,999,019 |
|
|
|
|
|
|
Profit Before Financial
Costs & Income Tax |
262,685,624 |
241,183,774 |
70,120,381 |
|
Financial Costs |
[18,959,822] |
[13,975,294] |
[32,120,010] |
|
|
|
|
|
|
Profit Before Income
Tax |
243,725,802 |
227,208,480 |
38,000,371 |
|
Income Tax |
[72,613,172] |
[67,028,779] |
[12,537,184] |
|
|
|
|
|
|
Net Profit / [Loss] |
171,112,630 |
160,179,701 |
25,463,187 |
FINANCIAL ANALYSIS
|
ITEM |
UNIT |
2011 |
2010 |
2009 |
|
|
|
|
|
|
|
LIQUIDITY RATIO |
|
|
|
|
|
CURRENT RATIO |
TIMES |
2.07 |
1.84 |
1.92 |
|
QUICK RATIO |
TIMES |
1.07 |
0.97 |
0.85 |
|
|
|
|
|
|
|
ACTIVITY RATIO |
|
|
|
|
|
FIXED ASSETS TURNOVER |
TIMES |
14.96 |
14.97 |
11.28 |
|
TOTAL ASSETS TURNOVER |
TIMES |
1.44 |
1.27 |
1.34 |
|
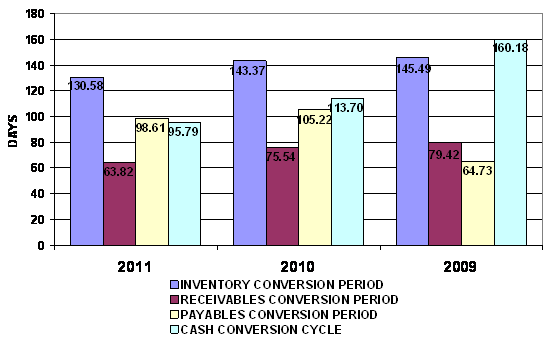
INVENTORY CONVERSION PERIOD |
DAYS |
130.58 |
143.37 |
145.49 |
|
INVENTORY TURNOVER |
TIMES |
2.80 |
2.55 |
2.51 |
|
RECEIVABLES CONVERSION PERIOD |
DAYS |
63.82 |
75.54 |
79.42 |
|
RECEIVABLES TURNOVER |
TIMES |
5.72 |
4.83 |
4.60 |
|
PAYABLES CONVERSION PERIOD |
DAYS |
98.61 |
105.22 |
64.73 |
|
CASH CONVERSION CYCLE |
DAYS |
95.79 |
113.70 |
160.18 |
|
|
|
|
|
|
|
PROFITABILITY
RATIO |
|
|
|
|
|
COST OF GOODS SOLD |
% |
81.89 |
83.13 |
86.55 |
|
SELLING & ADMINISTRATION |
% |
11.48 |
11.21 |
12.19 |
|
INTEREST |
% |
0.58 |
0.48 |
1.29 |
|
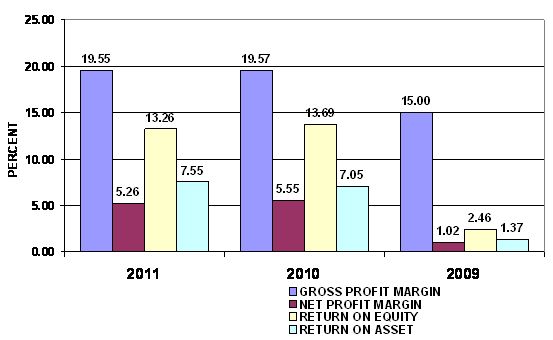
GROSS PROFIT MARGIN |
% |
19.55 |
19.57 |
15.00 |
|
NET PROFIT MARGIN BEFORE EX. ITEM |
% |
8.07 |
8.36 |
2.82 |
|
NET PROFIT MARGIN |
% |
5.26 |
5.55 |
1.02 |
|
RETURN ON EQUITY |
% |
13.26 |
13.69 |
2.46 |
|
RETURN ON ASSET |
% |
7.55 |
7.05 |
1.37 |
|
EARNING PER SHARE |
BAHT |
142.59 |
133.48 |
21.22 |
|
|
|
|
|
|
|
LEVERAGE RATIO |
|
|
|
|
|
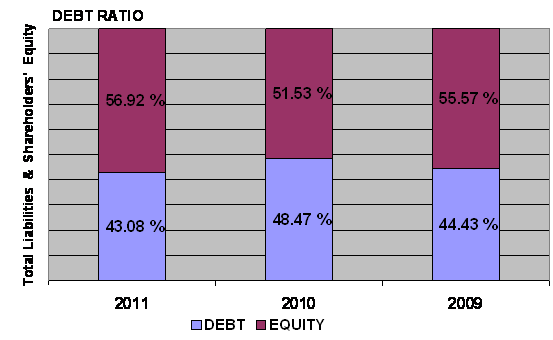
DEBT RATIO |
TIMES |
0.43 |
0.48 |
0.44 |
|
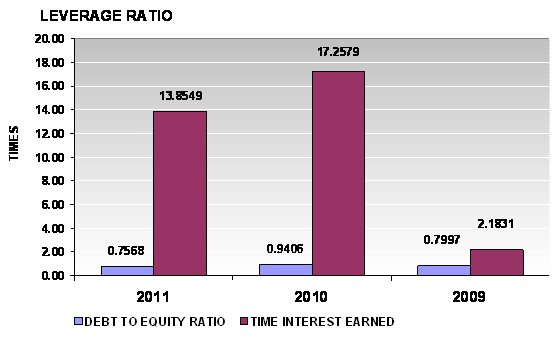
DEBT TO EQUITY RATIO |
TIMES |
0.76 |
0.94 |
0.80 |
|
TIME INTEREST EARNED |
TIMES |
13.85 |
17.26 |
2.18 |
|
|
|
|
|
|
|
ANNUAL GROWTH |
|
|
|
|
|
SALES GROWTH |
% |
12.90 |
15.89 |
|
|
OPERATING PROFIT |
% |
8.92 |
243.96 |
|
|
NET PROFIT |
% |
6.83 |
529.06 |
|
|
FIXED ASSETS |
% |
12.97 |
(12.71) |
|
|
TOTAL ASSETS |
% |
(0.13) |
22.03 |
|
ANNUAL GROWTH :
IMPRESSIVE
An annual sales growth is 12.9%. Turnover has increased from THB
2,883,865,647.00 in 2010 to THB 3,255,822,517.00 in 2011. While net profit has
increased from THB 160,179,701.00 in 2010 to THB 171,112,630.00 in 2011. And
total assets has decreased from THB 2,270,626,409.00 in 2010 to THB
2,267,621,193.00 in 2011.
PROFITABILITY :
EXCELLENT
PROFITABILITY
RATIO
|
Gross Profit Margin |
19.55 |
Impressive |
Industrial
Average |
6.34 |
|
Net Profit Margin |
5.26 |
Impressive |
Industrial
Average |
1.14 |
|
Return on Assets |
7.55 |
Impressive |
Industrial
Average |
1.22 |
|
Return on Equity |
13.26 |
Impressive |
Industrial
Average |
2.51 |
Gross Profit Margin used to assess a firm's financial health by
revealing the proportion of money left over from revenues after accounting for
the cost of goods sold. Gross profit margin serves as the source for paying
additional expenses and future savings. The company’s figure is 19.55%. When compared with the industry
average, the ratio of the company was higher, indicated that company was more
profitable than the same industry.
Net Profit Margin is the indicator of the company's efficiency in that
net profit takes into consideration all expenses of the company. A low profit
margin indicates a low margin of safety, higher risk that a decline in sales
will erase profits and result in a net loss. The company’s figure is 5.26%,
higher figure when compared with those of its average competitors in the same
industry, indicated that business was an efficient operator in a dominant position within its industry.
Return on Assets measures how efficiently profits are being generated
from the assets employed in the business when compared with the ratios of firms
in a similar business. A low ratio in comparison with industry averages
indicates an inefficient use of business assets. Return on Assets ratio is
7.55%, higher figure when compared with those of its average competitors in the
same industry, indicated that business was an efficient profit in a dominant position within its industry.
Return on Equity indicates how profitable a company is by comparing its
net income to its average shareholders' equity, ROE measures how much the
shareholders earned for their investment in the company. Return on Equity ratio
is 13.26%, higher figure when compared with those of its average competitors in
the same industry, indicated that business was an efficient profit in a dominant position within its industry.
Trend of the
average competitors in the same industry for last 5 years
Return on Assets Downtrend
Return on Equity Downtrend
LIQUIDITY :
ACCEPTABLE
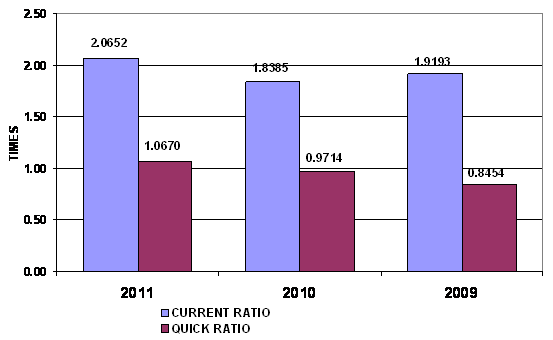
LIQUIDITY RATIO
|
Current Ratio |
2.07 |
Impressive |
Industrial
Average |
1.03 |
|
Quick Ratio |
1.07 |
|
|
|
|
Cash Conversion Cycle |
95.79 |
|
|
|
The Current Ratio is to ascertain whether a company's short-term assets
are readily available to pay off its short-term liabilities. The company's
figure is 2.07 times in 2011, increased from 1.84 times, then it is generally
considered to have good short-term financial strength. When compared with the
industry average, the ratio of the company was higher, indicated that company
was an efficient operator in a dominant position within its industry.
The Quick Ratio is a liquidity indicator that further refines the
current ratio by measuring the amount of the most liquid current assets there
are to cover current liabilities. The company's figure is 1.07 times in 2011,
increased from 0.97 times, although excluding inventory so the company still
have good short-term financial strength.
The Cash Conversion Cycle measures the number of days a company's cash
is tied up in the production and sales process of its operations and the
benefit from payment terms from its creditors. It meant the company could
survive when no cash inflow was received from sale for 96 days.
Trend of the
average competitors in the same industry for last 5 years
Current Ratio Downtrend
LEVERAGE :
EXCELLENT
LEVERAGE RATIO
|
Debt Ratio |
0.43 |
Impressive |
Industrial
Average |
0.65 |
|
Debt to Equity Ratio |
0.76 |
Impressive |
Industrial
Average |
1.74 |
|
Times Interest Earned |
13.85 |
Impressive |
Industrial Average |
1.37 |
Debt to Equity Ratio a measurement of how much suppliers, lenders,
creditors and obligors have committed to the company versus what the
shareholders have committed. A lower the percentage means that the company is
using less leverage and has a stronger equity position.
Times Interest Earned measuring a company's ability to meet its debt
obligations. Ratio is 13.86 higher than 1, so the company can pay interest
expenses on outstanding debt.
Debt Ratio shows the proportion of a company's assets which are financed
through debt. The company's figure is 0.43 less than 0.5, most of the company's
assets are financed through equity.
Trend of the
average competitors in the same industry for last 5 years
Debt Ratio Downtrend
Times Interest Earned Downtrend
ACTIVITY :
IMPRESSIVE
ACTIVITY RATIO
|
Fixed Assets Turnover |
14.96 |
Impressive |
Industrial
Average |
2.83 |
|
Total Assets Turnover |
1.44 |
Impressive |
Industrial
Average |
1.24 |
|
Inventory Conversion Period |
130.58 |
|
|
|
|
Inventory Turnover |
2.80 |
Acceptable |
Industrial
Average |
3.78 |
|
Receivables Conversion Period |
63.82 |
|
|
|
|
Receivables Turnover |
5.72 |
Satisfactory |
Industrial
Average |
5.84 |
|
Payables Conversion Period |
98.61 |
|
|
|
The company's Account Receivable Ratio is calculated as 5.72 and 4.83 in
2011 and 2010 respectively. This ratio measures the efficiency of the company
in managing its trade debtors to generate revenue. A lower ratio may indicate
over extension and collection problems. Conversely, a higher ratio may indicate
an overtly stringent policy. In this case, the company's A/R ratio in 2011
increased from 2010. This would suggest the company had good performance in the
management of its debt collections.
Inventory Turnover in Days Ratio indicates the liquidity of inventory.
It estimates the number of days that it will take to sell the current
inventory. Inventory is particularly sensitive to change in business
activities. The inventory turnover in days has decreased from 143 days at the
end of 2010 to 131 days at the end of 2011. This represents a positive trend.
And Inventory turnover has increased from 2.55 times in year 2010 to 2.8 times
in year 2011.
The company's Total Asset Turnover is calculated as 1.44 times and 1.27
times in 2011 and 2010 respectively. This ratio is determined by dividing total
assets into total sales turnover. The ratio measures the activity of the assets
and the ability of the firm to generate sales through the use of the assets.
Trend of the
average competitors in the same industry for last 5 years
Fixed Assets Turnover Downtrend
Total Assets Turnover Downtrend
Inventory Turnover Downtrend
Receivables Turnover Downtrend
FOREIGN EXCHANGE RATES
|
Currency |
Unit
|
Indian Rupees |
|
US Dollar |
1 |
Rs.54.29 |
|
|
1 |
Rs.84.09 |
|
Euro |
1 |
Rs.72.44 |
INFORMATION DETAILS
|
Report
Prepared by : |
PRL |
RATING EXPLANATIONS
|
RATING |
STATUS |
PROPOSED CREDIT LINE |
|
|
>86 |
Aaa |
Possesses an extremely sound financial base with the strongest
capability for timely payment of interest and principal sums |
Unlimited |
|
71-85 |
Aa |
Possesses adequate working capital. No caution needed for credit
transaction. It has above average (strong) capability for payment of interest
and principal sums |
Large |
|
56-70 |
A |
Financial & operational base are regarded healthy. General
unfavourable factors will not cause fatal effect. Satisfactory capability for
payment of interest and principal sums |
Fairly Large |
|
41-55 |
Ba |
Overall operation is considered normal. Capable to meet normal
commitments. |
Satisfactory |
|
26-40 |
B |
Capability to overcome financial difficulties seems comparatively
below average. |
Small |
|
11-25 |
Ca |
Adverse factors are apparent. Repayment of interest and principal sums
in default or expected to be in default upon maturity |
Limited with
full security |
|
<10 |
C |
Absolute credit risk exists. Caution needed to be exercised |
Credit not
recommended |
|
-- |
NB |
New Business |
-- |
This score serves as a reference to assess SC’s credit risk
and to set the amount of credit to be extended. It is calculated from a
composite of weighted scores obtained from each of the major sections of this
report. The assessed factors and their relative weights (as indicated through
%) are as follows:
Financial
condition (40%) Ownership
background (20%) Payment
record (10%)
Credit history
(10%) Market trend
(10%) Operational
size (10%)
This report is issued at your request without any
risk and responsibility on the part of MIRA INFORM PRIVATE LIMITED (MIPL)
or its officials.