MIRA INFORM REPORT
|
Report Date : |
22.02.2013 |
IDENTIFICATION DETAILS
|
Name : |
SOFT |
|
|
|
|
Registered Office : |
Route 110 Km 11 Boulevard
Chefchaouni, Casablanca |
|
|
|
|
Country : |
Morocco |
|
|
|
|
Financials (as on) : |
31.12.2011 |
|
|
|
|
Date of Incorporation : |
18.12.1979 |
|
|
|
|
Com. Reg. No.: |
38503 |
|
|
|
|
Legal Form : |
Societe A Responsibilite Limitee |
|
|
|
|
Line of Business : |
Subjects specialized in
preparation and spinning of worsted‑type fibres. |
|
|
|
|
No. of Employees : |
300 |
RATING & COMMENTS
|
MIRA’s Rating : |
Ba |
|
|
With Financials |
|
RATING |
STATUS |
PROPOSED CREDIT LINE |
|
|
41-55 |
Ba |
Overall operation is considered normal. Capable to meet
normal commitments. |
Satisfactory |
|
Status : |
Satisfactory |
|
Payment Behaviour : |
No Complaints |
|
Litigation : |
Clear |
NOTES :
Any query related to this report
can be made on e-mail: infodept@mirainform.com while quoting report
number, name and date.
ECGC Country Risk Classification List – June 30th, 2012
|
Country Name |
Previous Rating (31.03.2012) |
Current Rating (30.06.2012) |
|
Morocco |
A2 |
A2 |
|
Risk Category |
ECGC
Classification |
|
Insignificant |
A1 |
|
Low |
A2 |
|
Moderate |
B1 |
|
High |
B2 |
|
Very High |
C1 |
|
Restricted |
C2 |
|
Off-credit |
D |
Morocco - ECONOMIC OVERVIEW
Morocco has capitalized on its proximity to Europe and relatively low labor costs to build a diverse, open, market-oriented economy. In the 1980s Morocco pursued austerity measures and pro-market reforms, overseen by the IMF. Since taking the throne in 1999, King MOHAMMED VI has presided over a stable economy marked by steady growth, low inflation, and generally declining government debt. Industrial development strategies and infrastructure improvements - most visibly illustrated by a new port and free trade zone near Tangier - are improving Morocco's competitiveness. Key sectors of the economy include agriculture, tourism, phosphates, textiles, apparel, and subcomponents. In 2006 Morocco entered into a bilateral Free Trade Agreement with the United States; it remains the only African country to have one. In 2008 Morocco entered into an Advanced Status agreement with the European Union. Despite Morocco's economic progress, the country suffers from high unemployment and poverty. In 2011, high food and fuel prices strained the government's budget and widened the country's current account deficit. Key economic challenges for Morocco include fighting corruption, reducing government spending, reforming the education system and judiciary, addressing socioeconomic disparities, and building more diverse, higher value-added industries.
|
Source
: CIA |
COMPANY NAME
SOFT
Registration Briefing
Registration Number: 38503
Registration Date: 18/12/1979
Legal Form: SOCIETE
A RESPONSIBILITE LIMITEE
Latest Financials: December
31, 2011
Financial Briefing
Nominal Capital: 40,000,000
Moroccan Dirham
Issued Capital: N/A
Turnover: 240,039,796
Moroccan Dirham
Net Profit: 1,533,592
Moroccan Dirham
Net Worth: 85,275,204
Moroccan Dirham
Original
Investigation Details
Investigation Number: 179583
Company Name: SOFT
CASABLANCA
Country: MO
Street Name:
City Code:
Company Details
Company Name: SOFT
Headquarter Address: Route 110 Km
11 Boulevard Chefchaouni,
Q.I Ain Sebaa,
Casablanca,
Morocco
Telephone: +212522
352060
+212522 353807
+212522 354737
Fax: +212522
350812
+212522 354735
E‑Mail: soft@softgroup.ma
Web Site: www.softgroup.ma
Company was originally started on
18/12/1979
Registration &
Legal Details
Current Legal Form: SOCIETE A
RESPONSIBILITE LIMITEE
Registration Address: Route 110 Km 11
Boulevard Chefchaouni,
Casablanca
Registration Number: 38503
Registration Date: 18/12/1979
Year/Date Company Established: 18/12/1979
Registration Town: Casablanca
Tax Registration Number: 01900092
Capital
Currency: Moroccan
Dirham
Authorized Capital: 40,000,000
Paid Up Capital: 40,000,000
Authorized Capital
Breakdown
]Number of Shares:
400,000 Type of Shares: None Selected
Issued Shares: 400,000 Value per share: MDH 100.00 Value of this type: 40,000,000.00
Shareholders / Owners
Parent Company: SOFT
GROUP,
41‑43 Boulevard d'Anfa,
Casablanca,
Morocco
% Shares Held: 99.99%
Shareholders
Name/Other Information Shares Held % of Voting/Non‑Voting
capital
Mr. Mohamed Kabbaj, 25
25, Rue Pelé,
Casablanca,
Morocco
Principals
Name: Mr Mohamed
Kabbaj
Position within the company: Chairman and managing
director
Date of Birth: 19/05/1943
Country of Birth: Morocco
Nationality: Moroccan
Can fluently speak: Arabic &
French
Name: Mr Abdellatif
Kabbaj
Position within the company: General Director
Date of Birth: 19/06/1981
Country of Birth: Morocco
Nationality: Moroccan
Can fluently speak: Arabic &
French
Name: Mr Abdellah
Mimouni
Position within the company: Financial Manager
Country of Birth: Morocco
Nationality: Moroccan
Can fluently speak: Arabic &
French
Name: Mr Samir
Bounane
Position within the company: Technical Manager
Country of Birth: Morocco
Nationality: Moroccan
Can fluently speak: Arabic &
French
Name: Mr Anas
Moundib
Position within the company: Commercial Manager
Country of Birth: Morocco
Nationality: Moroccan
Can fluently speak: Arabic &
French
Company Activities
NACE Codes: 1310 Preparation
and spinning of textile fibres
The company is specialized in
preparation and spinning of worsted‑type fibres.
Local Reporters consider the
investigated company to be LARGE in their field of concern.
Operations
Employees Company
Employs: 300
HQ Premises Operates
from: Owned Offices, Factory,
Warehouse
Premises Size: 25000
square meters
Location: Industrial
Area
Related Companies
Subsidiaries
Affiliates
Information on Related Companies is not
available/applicable
Bankers
Attijariwafa Bank,
Branch: Head office
2 Boulevard Moulay Youssef,
Casablanca 20000,
Morocco
Banque Marocaine du Commerce Extérieur,
Branch: Head office
140 Avenue Hassan II,
Casablanca 20000,
Morocco
Banque Marocaine pour le Commerce et l'Industrie,
Branch: Head office
26 Place des Nations Unies,
Casablanca 20000,
Morocco
Financial Information
|
|
|
|
|
|
|
|
Financial Information |
|
|
|
||
|
|
|
|
|
|
|
|
|
Financial Interview Date: |
18-02-2013 |
|
|
|
|
|
Source: |
Companies Registry |
|
|
|
|
|
Figures are: |
Official Figures |
|
|
|
|
|
Currency: |
Moroccan Dirham |
|
|
|
|
|
|
|
|
|
|
|
|
Months |
Sales Figures |
Sales |
Gross Profit/Loss |
Net Profit/Loss |
|
|
12 |
31-12-2011 |
240,039,796 |
2,753,742 |
1,533,592 |
|
|
12 |
31-12-2010 |
231,958,273 |
3,073,111 |
1,499,047 |
|
|
12 |
31-12-2007 |
174,163,003 |
1,882,044 |
862,798 |
|
|
12 |
31-12-2006 |
163,130,612 |
1,748,760 |
780,447 |
|
|
|
|
|
|
|
|
|
|
|
|
|
|
|
|
|
|
|
|
|
|
Balance Sheet & Profit & Loss |
|
|
|
||
|
|
|
|
|
|
|
|
|
BALANCE SHEET |
|
|
|
|
|
|
|
|
|
|
|
|
|
|
Asat: 31‑Dec‑2011 |
Asat: 31‑Dec‑2010 |
Asat: 31‑Dec‑2007 |
|
|
|
Fixed Assets |
|
|
|
|
|
|
Land & Buildings |
15,118,733 |
1,53,24,212 |
1,51,56,850 |
|
|
|
Plant & Machinery |
27,400,274 |
3,38,82,582 |
3,72,71,385 |
|
|
|
Furniture & Equipment |
630,059 |
6,07,522 |
4,66,136 |
|
|
|
Motor Vehicles |
598,843 |
5,84,081 |
1,59,110 |
|
|
|
Misc. Fixed Assets |
24,992 |
29,552 |
|
|
|
|
Total Fixed Assets |
43,772,901 |
5,04,27,949 |
5,30,53,481 |
|
|
|
|
|
|
|
|
|
|
Financial Assets |
|
|
|
|
|
|
Shares in Related Companies |
120,000 |
1,20,000 |
1,20,000 |
|
|
|
Loans to related companies |
338,186 |
4,14,236 |
4,27,449 |
|
|
|
Investments |
|
|
|
|
|
|
Deposits |
|
|
|
|
|
|
Misc. Financial Assets |
341,181 |
3,41,181 |
2,25,181 |
|
|
|
Total Financial Assets |
799,367 |
8,75,417 |
7,72,630 |
|
|
|
|
|
|
|
|
|
|
Intangibles |
|
|
|
|
|
|
Goodwill |
|
|
|
|
|
|
Organisational Expenses |
|
|
|
|
|
|
Patents |
131,560 |
19,845 |
13,297 |
|
|
|
Misc. Intangible Assets |
|
|
|
|
|
|
Total Intangible Assets |
131,560 |
19,845 |
13,297 |
|
|
|
|
|
|
|
|
|
|
Current Assets |
|
|
|
|
|
|
Stock |
39,365,697 |
3,82,62,035 |
2,65,52,533 |
|
|
|
Stock & Work in Progress |
121,141,854 |
11,21,87,210 |
1,33,26,136 |
|
|
|
Trade Debtors & receivables |
98,035,449 |
8,16,09,711 |
8,93,55,672 |
|
|
|
Provision for bad debs |
|
|
|
|
|
|
Other receivables |
75,000 |
75,000 |
80,873 |
|
|
|
Due from related companies |
|
|
|
|
|
|
Owed by shareholders |
|
|
|
|
|
|
Prepaid expenses |
205,633 |
63,803 |
1,16,258 |
|
|
|
Cash |
658,598 |
98,78,773 |
69,50,591 |
|
|
|
Tax recoverable |
26,000,340 |
2,38,29,895 |
1,98,64,864 |
|
|
|
Marketable Securities |
|
|
|
|
|
|
Misc. Current Assets |
2,812,296 |
8,85,973 |
73,402 |
|
|
|
Total Current Assets |
288,294,867 |
26,67,92,400 |
15,63,20,329 |
|
|
|
Total Assets |
332,998,695 |
31,81,15,611 |
21,01,59,737 |
|
|
|
Owner's Equity & Liabilities |
|
|
|
|
|
|
Issued and paid up capital |
40,000,000 |
4,00,00,000 |
4,00,00,000 |
|
|
|
Share premium account |
|
|
|
|
|
|
Retained earnings |
1,68,82,094 |
1,54,57,999 |
1,74,06,635 |
|
|
|
Net profit/Loss for the year |
15,33,592 |
14,99,047 |
8,62,798 |
|
|
|
Revaluation reserves |
1,42,94,709 |
1,42,94,709 |
1,42,94,709 |
|
|
|
Legal Reserves |
24,64,563 |
23,89,610 |
21,97,434 |
|
|
|
Other reserves |
1,01,00,246 |
1,01,00,246 |
86,61,404 |
|
|
|
Net Worth |
8,52,75,204 |
8,37,41,611 |
8,34,22,980 |
|
|
|
|
|
|
|
|
|
|
|
|
|
|
|
|
|
Deffered Taxation |
|
|
|
|
|
|
Provisions/allowances |
24,600 |
2,33,926 |
51,74,092 |
|
|
|
Mortgages/Loans |
|
|
|
|
|
|
Hire purchase |
|
|
|
|
|
|
Due to group of companies |
|
|
|
|
|
|
Minority interest |
|
|
|
|
|
|
Misc. deferred liabilities |
|
|
|
|
|
|
Total Long Term Liabilities |
24,600 |
2,33,926 |
51,74,092 |
|
|
|
|
|
|
|
|
|
|
Current Liabilities |
|
|
|
|
|
|
Creditors |
14,44,34,445 |
11,10,68,572 |
5,07,76,946 |
|
|
|
Other creditors |
3,08,718 |
5,74,633 |
2,97,156 |
|
|
|
Accruals |
10,247 |
58,556 |
3,41,586 |
|
|
|
Bank overdrafts/Loans |
5,75,71,765 |
6,11,06,658 |
5,49,83,194 |
|
|
|
Misc. Loans |
|
|
|
|
|
|
Directors accounts |
|
|
|
|
|
|
Owing to shareholders |
3,04,50,000 |
4,96,50,000 |
84,28,842 |
|
|
|
Owing to related companies |
|
|
|
|
|
|
Proposed dividend |
|
|
|
|
|
|
Long Term‑due 1 year |
|
|
|
|
|
|
Hire Purchase‑under 1 year |
|
|
|
|
|
|
Taxation |
1,05,87,773 |
87,10,248 |
65,70,098 |
|
|
|
Advance receipts |
50,305 |
4,33,110 |
36,395 |
|
|
|
Misc. Current Liabilities |
42,85,638 |
25,38,297 |
1,28,448 |
|
|
|
Total Current Liabilities |
24,76,98,891 |
23,41,40,074 |
12,15,62,665 |
|
|
|
Owner's Equity & Liabilities |
33,29,98,695 |
31,81,15,611 |
21,01,59,737 |
|
|
|
|
|
|
|
|
|
|
PROFIT & LOSS |
|
|
|
|
|
|
|
|
|
|
|
|
|
|
Figures are: |
Figures are: |
Figures are: |
|
|
|
|
Fiscal Year |
Fiscal Year |
Fiscal Year |
|
|
|
|
|
|
|
|
|
|
|
01/01/2011 to 31/12/2011 |
01/01/2010 to 31/12/2010 |
01/01/2007 to 31/12/2007 |
|
|
|
Total Income/Turnover |
24,00,39,796 |
23,19,58,273 |
17,41,63,003 |
|
|
|
Cost of sales |
4,88,65,757 |
6,91,95,511 |
|
|
|
|
|
|
|
|
|
|
|
Gross Profit/(Loss) |
19,11,74,039 |
16,27,62,762 |
17,41,63,003 |
|
|
|
|
|
|
|
|
|
|
Admin/selling expenses |
15,35,55,172 |
19,29,46,013 |
13,02,51,804 |
|
|
|
Services |
93,71,018 |
87,61,178 |
48,04,832 |
|
|
|
Salaries |
2,07,65,524 |
1,81,00,232 |
1,18,83,568 |
|
|
|
Auditors Fee |
3,78,007 |
3,76,841 |
4,41,679 |
|
|
|
Stock Depreciation |
‑9,553,314 |
‑73,969,787 |
1,19,87,349 |
|
|
|
Depreciation |
86,87,283 |
91,22,851 |
82,92,440 |
|
|
|
Misc. Operating Expenses |
|
|
|
|
|
|
Misc. Operating Income |
2,45,500 |
|
|
|
|
|
Net Operating Profit/(Loss) |
79,70,349 |
74,25,434 |
67,46,831 |
|
|
|
|
|
|
|
|
|
|
Interest Receivable/Finance Income |
6,091 |
69,953 |
1,30,808 |
|
|
|
Group related income |
|
|
|
|
|
|
Misc. Financial Income |
53,59,932 |
41,64,602 |
56,37,220 |
|
|
|
Total Financial Income |
53,66,023 |
42,34,555 |
57,68,028 |
|
|
|
|
|
|
|
|
|
|
Interest Payable/Finance costs |
47,30,779 |
39,37,143 |
33,90,075 |
|
|
|
Misc. financial expenses |
58,51,851 |
46,49,735 |
72,42,740 |
|
|
|
Total Financial Expenses |
1,05,82,630 |
85,86,878 |
1,06,32,815 |
|
|
|
|
|
|
|
|
|
|
Profit/(Loss) before taxes |
27,53,742 |
30,73,111 |
18,82,044 |
|
|
|
|
|
|
|
|
|
|
Income Tax |
12,20,150 |
15,74,064 |
10,19,246 |
|
|
|
Other Tax |
|
|
|
|
|
|
Profit/(Loss) after taxes |
15,33,592 |
14,99,047 |
8,62,798 |
|
|
|
|
|
|
|
|
|
|
Extraordinary items |
|
|
|
|
|
|
Exceptional items |
|
|
|
|
|
|
Misc. Items |
|
|
|
|
|
|
|
|
|
|
|
|
|
Net Profit/(Loss) |
15,33,592 |
14,99,047 |
8,62,798 |
|
|
|
|
|
|
|
|
|
|
|
|
|
|
|
|
|
Previous years retained earnings |
|
|
|
|
|
|
Current years net income |
15,33,592 |
14,99,047 |
8,62,798 |
|
|
|
Misc. additions in current year |
|
|
|
|
|
|
Current years net loss |
|
|
|
|
|
|
Dividends in current year |
|
|
|
|
|
|
Withdrawals in current year |
|
|
|
|
|
|
Misc. deductions in current year |
|
|
|
|
|
|
|
|
|
|
|
|
|
Retained earnings at end of |
15,33,592 |
14,99,047 |
8,62,798 |
|
|
|
financial period |
|
|
|
|
|
|
|
|
|
|
|
|
|
Average employees |
|
|
|
|
|
|
|
|
|
|
|
|
|
Directors fee |
|
|
|
|
|
|
Earnings per share |
|
|
|
|
|
|
Earnings per share‑previous year |
|
|
|
|
Auditors Comments
Date accounts obtained: 18/02/2013
Accounts obtained from: Companies
registry
Auditors
Opinion: The
audited financial statement gives a true and fair view of the state
of
affairs of the subject
Financial Statements have been prepared on an on‑going
basis.
Assuming support of: shareholders
FINANCIAL RATIOS /
COMPARATIVE DATA
Actual Company Industrial
Averages Actual Company Industrial Averages
Results (2011) (2011) Results (2010) (2010)
Liquidity Ratios
Current Ratio 1.16 1.58 1.14 1.53
Acid Test Ratio 0.52 0.99 0.50 1.00
Accounts 0.60 0.43 0.48 0.67
Payable/Sales Ratio
Current
Liabilities/Net 2.90 2.11 2.80 ‑0.49
Worth
Current 1.54 2.81 1.56 2.99
Liabilities/Inventory
Total
Liabilities/Net 2.90 2.26 2.80 ‑0.28
Worth
Fixed Assets/Net 51.33 86.46 60.22 ‑158.05
Worth (%)
Profitability Ratios
Gross Profit Ratio
(%) 79.64 92.16 70.17 93.98
Return on Capital 3.23 7.44 3.66 7.83
Employed (ROCE)(%)
Net Profit/Sales (%) 1.15 ‑5.84 1.32 ‑8.32
Return on Assets (%) 0.83 4.42 0.97 3.68
Efficiency Ratios
Sales/Working
Capital 5.91 182.81 7.10 14.15
Assets/Sales(%) 138.73 189.85 137.14 230.00
Shareholders 3.23 12.12 3.67 6.90
Return(%)
Average Inventory 289.92 73,097.73 45,353.67
Period
Average Collection 136.58 100.46 119.11
Period
Sales/Inventory 1.50 7.18 1.54 5.78
Leverage Ratios
Capital Employed 2.82 4.11 2.77 4.17
Capital Structure
(%) 0.03 36.78 0.28 25.85
Number of 328 328
Companies within the
industry (NACE C)
Statistics based on Manufacturing Manufacturing
NACE(C)
INDUSTRY SECTOR
COMPARATIVE DATA
Elements
Taken Result for specific RANKING Total Companies Used
company
DATE OF REGISTRATION 18/12/1979 339 821
TOTAL EMPLOYEES 300 166 806
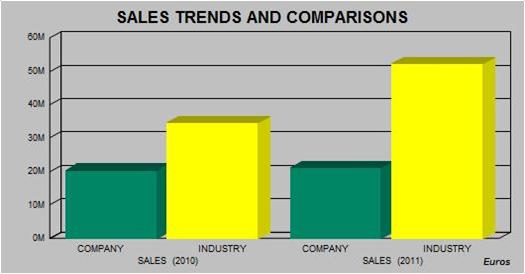
SALES (2011) 21,104,299 48 194
SALES (2010) 20,393,771 72 316
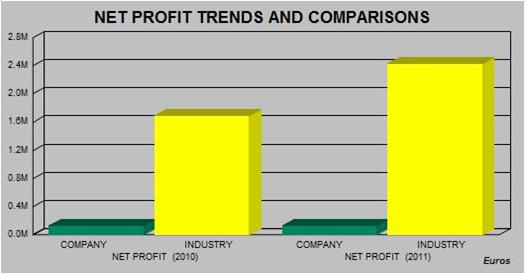
NET PROFIT (2011) 134,833 81 174
NET PROFIT (2010) 131,796 138 319
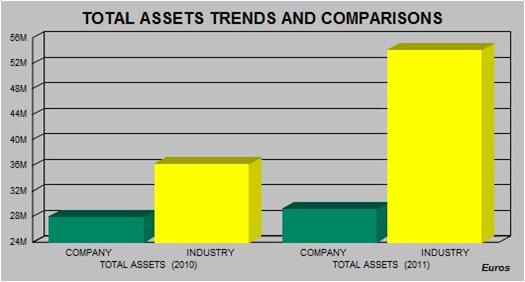
TOTAL ASSETS (2011) 29,277,245 46 173
TOTAL ASSETS (2010) 27,968,725 74 324
Currency: EUROS
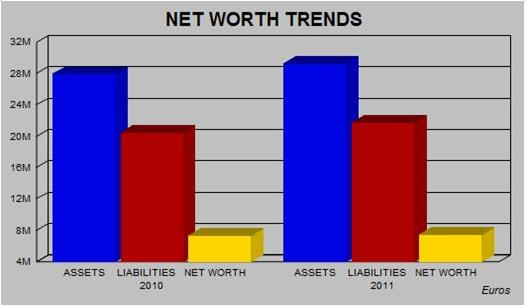
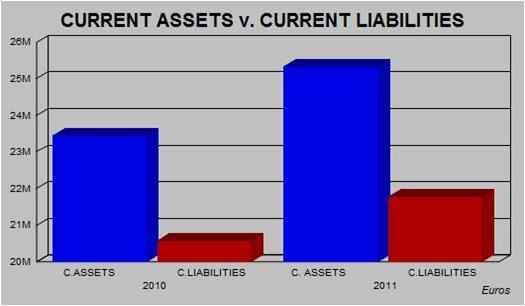
Charts of Financial
Trends and Industry Comparisons
PLEASE NOTE THAT CHARTS ARE SHOWN IN EUROS FOR TREND AND
COMPARISON PURPOSES
Payments
Subject's payments reported to be:UNDETERMINED
Representation
Other Comments
Other Comments: Patent N°
: 30650620
Interview &
Reporter Comments
Name/Title: Mr.
Abdellah Mimouni Financial Manager
Comment: Subject was too busy
to provide/confirm any information.
Reporter Comment:
All legal forms in Morocco are
obliged by law to be registered with the Registry Office (OMPIC :
Office Marocain De La Propriete
Industrielle Et Commerciale) which is publicly available.
Subject was found registered and
Information obtained from above official source is as follows :
Registered name / registration number /
date of registration / registered
address / legal form /
capital / main principals –
administrators / shareholders / shareholders% / financial information.
According to the Morocco Commercial
Law, all legal forms except for proprietorship entities are
obliged to file their financial
accounts to the OMPIC.
Any other data stated in the report was
obtained directly from the subject company and/or other
publicly available information.
Therefore it should be used as a point of reference as it is not
possible to verify such data with
official sources.
We contacted the subject and they
confirmed that Mr. Abdellah Mimouni, Financial Manager,
who has the authority to divulge such
information, however, they confirmed that he is not
available at the present.
Conclusions
Local Reputation: The
company being investigated is considered by local reporters to be.
a Fair / Normal Trade
Risk
General Conclusion: Local
informants consider granting of credit to be a fair trade risk.
Owner/Shareholders Comments: Some of the owners /
shareholders have an active participation in the
running
of the business.
Financial Results Trend: Financial
Information indicates that the business activities of the
company
are showing an upward turn.
Age of Business: The
company is long established in the local market.
FOREIGN EXCHANGE RATES
|
Currency |
Unit
|
Indian
Rupees |
|
US Dollar |
1 |
Rs.54.48 |
|
UK Pound |
1 |
Rs.82.71 |
|
Euro |
1 |
Rs.72.23 |
INFORMATION DETAILS
|
Report
Prepared by : |
NLM |
RATING EXPLANATIONS
|
RATING |
STATUS |
PROPOSED CREDIT LINE |
|
|
>86 |
Aaa |
Possesses an extremely sound financial base with the
strongest capability for timely payment of interest and principal sums |
Unlimited |
|
71-85 |
Aa |
Possesses adequate working capital. No caution needed for
credit transaction. It has above average (strong) capability for payment of interest
and principal sums |
Large |
|
56-70 |
A |
Financial & operational base are regarded healthy.
General unfavourable factors will not cause fatal effect. Satisfactory
capability for payment of interest and principal sums |
Fairly
Large |
|
41-55 |
Ba |
Overall operation is considered normal. Capable to meet
normal commitments. |
Satisfactory |
|
26-40 |
B |
Capability to overcome financial difficulties seems
comparatively below average. |
Small |
|
11-25 |
Ca |
Adverse factors are apparent. Repayment of interest and
principal sums in default or expected to be in default upon maturity |
Limited
with full security |
|
<10 |
C |
Absolute credit risk exists. Caution needed to be
exercised |
Credit
not recommended |
|
-- |
NB |
New
Business |
-- |
This score serves as a reference to assess SC’s
credit risk and to set the amount of credit to be extended. It is calculated
from a composite of weighted scores obtained from each of the major sections of
this report. The assessed factors and their relative weights (as indicated
through %) are as follows:
Financial
condition (40%) Ownership
background (20%) Payment
record (10%)
Credit
history (10%) Market
trend (10%) Operational
size (10%)
This report is issued at your request without any
risk and responsibility on the part of MIRA INFORM PRIVATE LIMITED (MIPL)
or its officials.