MIRA
INFORM REPORT
|
Report Date : |
10.01.2013 |
IDENTIFICATION DETAILS
|
Name : |
KULTHORN STEEL COMPANY LIMITED |
|
|
|
|
Registered Office : |
124 Latkrabang Industrial Estate, Soi Chalongkrung 31, Chalongkrung Road, Lamplathew, Latkrabang, Bangkok 10520 |
|
|
|
|
Country : |
Thailand |
|
|
|
|
Financials (as on) : |
31.12.2011 |
|
|
|
|
Date of Incorporation : |
20.06.2007 |
|
|
|
|
Com. Reg. No.: |
0105550063921 |
|
|
|
|
Legal Form : |
Private Limited Company |
|
|
|
|
Line of Business : |
Manufacturer and Distributor of Steel Cutting and Processing
[Coil Center] |
|
|
|
|
No. of Employees : |
109 |
RATING & COMMENTS
|
MIRA’s Rating : |
B |
|
RATING |
STATUS |
PROPOSED CREDIT LINE |
|
|
26-40 |
B |
Capability to overcome financial difficulties seems comparatively
below average. |
Small |
|
Status : |
Moderate |
|
Payment Behaviour : |
Slow but Correct |
|
Litigation : |
Clear |
NOTES:
Any query related to this report can be made
on e-mail: infodept@mirainform.com
while quoting report number, name and date.
ECGC Country Risk Classification List – June 30th, 2012
|
Country Name |
Previous Rating (31.03.2012) |
Current Rating (30.06.2012) |
|
Thailand |
B1 |
B1 |
|
Risk Category |
ECGC
Classification |
|
Insignificant |
A1 |
|
Low |
A2 |
|
Moderate |
B1 |
|
High |
B2 |
|
Very High |
C1 |
|
Restricted |
C2 |
|
Off-credit |
D |
thailand - ECONOMIC OVERVIEW
With a well-developed infrastructure, a free-enterprise economy, generally pro-investment policies, and strong export industries, Thailand enjoyed solid growth from 2000 to 2007 - averaging more than 4% per year - as it recovered from the Asian financial crisis of 1997-98. Thai exports - mostly machinery and electronic components, agricultural commodities, and jewelry - continue to drive the economy, accounting for more than half of GDP. The global financial crisis of 2008-09 severely cut Thailand's exports, with most sectors experiencing double-digit drops. In 2009, the economy contracted 2.3%. In 2010, Thailand's economy expanded 7.8%, its fastest pace since 1995, as exports rebounded from their depressed 2009 level. Steady economic growth at just below 4% during the first three quarters of 2011 was interrupted by historic flooding in October and November in the industrial areas north of Bangkok, crippling the manufacturing sector and leading to a revised growth rate of only 0.1% for the year. The industrial sector is poised to recover from the second quarter of 2012 onward, however, and the government anticipates the economy will probably grow between 5.5 and 6.5% for 2012, while private sector forecasts range between 3.8% and 5.7%.
|
Source : CIA |
Company name
KULTHORN STEEL
COMPANY LIMITED
SUMMARY
BUSINESS ADDRESS : 124 LATKRABANG INDUSTRIAL
ESTATE,
SOI
CHALONGKRUNG 31, CHALONGKRUNG
ROAD,
LAMPLATHEW,
LATKRABANG, BANGKOK 10520
TELEPHONE : [66] 2326-0851
FAX : [66] 2326-0766
E-MAIL ADDRESS : kkc@kulthorn.com
REGISTRATION ADDRESS : SAME AS BUSINESS
ADDRESS
ESTABLISHED : 2007
REGISTRATION NO. : 0105550063921
TAX ID NO. : 3032682343
CAPITAL REGISTERED : BHT. 400,000,000
CAPITAL PAID-UP : BHT.
400,000,000
SHAREHOLDER’S PROPORTION : THAI :
100%
FISCAL YEAR CLOSING DATE : DECEMBER 31
LEGAL STATUS : PRIVATE LIMITED
COMPANY
EXECUTIVE : MR. SUTEE SIMAKULTHORN,
THAI
PRESIDENT
NO. OF STAFF : 109
LINES OF BUSINESS : STEEL CUTTING AND PROCESSING [COIL
CENTER]
MANUFACTURER AND
DISTRIBUTOR
CORPORATE PROFILE
OPERATING TREND : STABLE
PRESENT SITUATION : OPERATING NORMALLY
REPUTATION : GOOD
WITH NORMAL BUSINESS
ENGAGEMENT
MANAGEMENT STANDARD : MANAGEMENT
WITH GOOD PERFORMANCE
HISTORY
The subject was
established on June
20, 2007 as
a private limited
company under the registered
name KULTHORN STEEL
COMPANY LIMITED by
Thai groups, with the
objective to engage
in steel cutting
and processing business.
It currently employs
109 staff. The
subject is a
wholly owned subsidiary
of Kulthorn Kirby
Public Company Limited,
the leading air
compressor manufacture in
Thailand.
The subject’s registered
address was initially
located at 61/1
Moo 4, Chalongkrung
Rd., Lamplathew, Latkrabang,
Bangkok 10520.
On September 1, 2010,
subject’s registered address
was relocated to
124 Latkrabang Industrial
Estate, Soi Chalongkrung 31,
Chalongkrung Rd., Lamplathew,
Latkrabang, Bangkok 10520, and
this is the
subject’s current operation
address.
THE BOARD OF DIRECTOR
|
Name |
|
Nationality |
Age |
|
|
|
|
|
|
Mr. Suraporn Simakulthorn |
[x] |
Thai |
72 |
|
Mr. Sutee Simakulthorn |
[x] |
Thai |
44 |
|
Ms. Sornsanan Simakulthorn |
|
Thai |
43 |
|
Mr. Thitisak Simakulthorn |
|
Thai |
35 |
|
Mr. Paiboon Boonpermvitaya |
[x] |
Thai |
57 |
AUTHORIZED PERSON
Any two of
the mentioned directors
[x] can jointly
sign or one
of the mentioned
directors [x] can
jointly sign with
anyone of the
rest directors on
behalf of the
subject with company’s
affixed.
MANAGEMENT
Mr. Sutee Simakulthorn is
the President.
He is Thai
nationality with the
age of 44
years old.
Mr. Paiboon Boonpermvitaya is
the Executive Vice
President [Manufacturing].
He is Thai
nationality with the age
of 57 years
old.
Mr. Chanachai Kulnoppaleark is
the Group Vice
President [Finance].
He is Thai
nationality.
BUSINESS OPERATIONS
The subject is engaged in steel
cutting and processing [coil center]
for motor compressor,
electric motors and
other parts, with
the production capacity
of 15,000 tons
per month for
cutting works and
1,000,000 strokes per
month for processing
works.
PURCHASE
100% of its
raw materials is
purchased from local
supplier.
SALES
100% of the
products is sold
locally by wholesale
to manufacturers and
end-users.
MAJOR CUSTOMERS
Kulthorn Kirby Public
Company Limited : Thailand
Kulthorn Premier Co.,
Ltd. : Thailand
SUBSIDIARY AND AFFILIATED COMPANY
The subject is
not found to
have any subsidiary
or affiliated company
here in Thailand.
LITIGATION
Bankruptcy and Receivership
There are no
litigation on bankruptcy
and receivership cases
filed against the
subject found at
Legal Execution Department
for the past
five years.
Others
There are no
legal suits filed
against the subject
according to IRICO’S
DATABASE for the
past two years.
CREDIT
Sales are by cash or
on the credits
term of 30-60
days.
Local bills are
paid by cash
or on the
credits term of
30-60 days.
BANKING
TMB Bank Public
Co., Ltd.
EMPLOYMENT
The subject currently employs
109 staff.
LOCATION DETAILS
The premise is
owned for administrative
office and factory at
the heading address.
Premise is located
in industrial area.
COMMENT
The subject is
a manufacturer of
steel cutting. In
2011 the subject had
been recorded a
good performance in
its sales and
services, as well
as continue expanding
throughout the year
2012. This has
resulted by company
earning a good
outstanding work and
services.
FINANCIAL INFORMATION
The capital was
registered at Bht.
100,000,000 divided into
1,000,000 shares of
Bht. 100 each
with fully paid.
The capital was
increased later as
follows:
Bht. 200,000,000
on October 21,
2008
Bht. 400,000,000
on June 9,
2010
The latest registered
capital was increased
to Bht. 400 million, divided
into 4,000,000 shares of
Bht. 100 each with
fully paid.
THE SHAREHOLDERS LISTED WERE
[as at April
23, 2012]
|
NAME |
HOLDING |
% |
|
|
|
|
|
Kulthorn Kirby Public
Company Limited Nationality: Thai Address : 44/1
Moo 7, Chalongkrung Rd.,
Lamplathew, Latkrabang, Bangkok
|
3,999,993 |
100.00 |
|
Mr. Sumeth Simakulthorn Nationality: Thai Address : 237-237/1-2
Larnluang Rd., Wat
Somanus,
Pomprabsattrupai, Bangkok |
1 |
- |
|
Mr. Suraporn Simakulthorn Nationality: Thai Address : 420
Soi Pattanakarn 53,
Suanluang, Bangkok |
1 |
- |
|
Mr. Sutee Simakulthorn Nationality: Thai Address : 204/98
Moo 6, Prawet,
Bangkok |
1 |
- |
|
Mr. Kamol Upalanont Nationality: Thai Address : 204/167
Moo 6, Prawet,
Bangkok |
1 |
- |
|
Mr. Paiboon Boonpermvitaya Nationality: Thai Address : 79/331
Moo 8, Sapansung,
Bangkok |
1 |
- |
|
Mr. Thitisak Simakulthorn Nationality: Thai Address : 420
Soi Pattanakarn 53,
Suanluang,
Bangkok |
1 |
- |
|
Ms. Sornsanan Simakulthorn Nationality: Thai Address : 180/1-2
Larnluang Rd., Klongmahanark,
Pomprabsattrupai, Bangkok |
1 |
- |
Total Shareholders : 8
Share Structure
[as at April 23,
2012]
|
Nationality |
Shareholders |
No. of Share |
% Shares |
|
|
|
|
|
|
Thai |
8 |
4,000,000 |
100.00 |
|
Foreign |
- |
- |
- |
|
Total |
8 |
4,000,000 |
100.00 |
NAME OF
AUDITOR & CERTIFIED
PUBLIC ACCOUNTANT NO.
Ms. Saifon Inthkaew No.
4434
BALANCE SHEET [BAHT]
The latest financial
figures published for
December 31, 2011
& 2010 were:
ASSETS
|
Current Assets |
2011 |
2010 |
|
|
|
|
|
Cash and Cash Equivalents |
13,051,731 |
4,191,486 |
|
Trade Accounts & Other Receivable |
423,024,556 |
397,744,627 |
|
Inventories |
262,047,134 |
181,899,692 |
|
Other Current Assets
|
6,481,725 |
344,013 |
|
|
|
|
|
Total Current Assets
|
704,605,146 |
584,179,818 |
|
Cash at Bank pledged as a
Collateral |
760,000 |
760,000 |
|
Fixed Assets |
330,473,828 |
357,330,871 |
|
Other Non-current Assets |
554,688 |
516,186 |
|
Total Assets |
1,036,393,662 |
942,786,875 |
LIABILITIES &
SHAREHOLDERS’ EQUITY [BAHT]
|
Current
Liabilities |
2011 |
2010 |
|
|
|
|
|
Bank Overdraft from Financial Institutions |
384,053,281 |
353,445,881 |
|
Trade Accounts & Other
Payable |
135,149,033 |
52,403,574 |
|
Current Portion of
Hire-purchase Payable and Financial Lease Contract Liabilities |
12,231,274 |
37,900,926 |
|
Accrued Income Tax |
- |
10,628,159 |
|
Other Current Liabilities |
7,720,862 |
546,279 |
|
|
|
|
|
Total Current Liabilities |
539,154,450 |
454,924,819 |
|
Hire-purchase Payable and
Financial Lease Contract Liabilities, Net of Current Portion |
1,176,476 |
13,407,750 |
|
Reserve for Employee’s Benefit |
1,430,639 |
- |
|
Total Liabilities |
541,761,565 |
468,332,569 |
|
|
|
|
|
Shareholders' Equity |
|
|
|
|
|
|
|
Share capital : Baht 100
value authorized, issued
and fully paid share
capital 4,000,000 shares |
400,000,000 |
400,000,000 |
|
|
|
|
|
Capital Paid |
400,000,000 |
400,000,000 |
|
Retained Earning - Unappropriated |
94,632,097 |
74,454,306 |
|
Total Shareholders' Equity |
494,632,097 |
474,454,306 |
|
Total Liabilities & Shareholders' Equity |
1,036,393,662 |
942,786,875 |
PROFIT & LOSS ACCOUNT
|
Revenue |
2011 |
2010 |
|
|
|
|
|
Sales & Services
|
1,275,503,881 |
1,489,077,048 |
|
Sales Scarp Income |
60,486,112 |
56,827,317 |
|
Gain on Exchange Rate |
- |
35,350,374 |
|
Other Income |
2,146,817 |
527,709 |
|
Total Revenues |
1,338,136,810 |
1,581,782,448 |
|
Expenses |
|
|
|
|
|
|
|
Cost of Goods
Sold and Services |
1,259,519,915 |
1,426,837,291 |
|
Selling and Services Expenses |
3,717,652 |
4,522,519 |
|
Administrative Expenses |
21,116,444 |
20,327,530 |
|
Loss on Exchange Rate |
20,026,308 |
- |
|
Total Expenses |
1,304,380,319 |
1,451,687,340 |
|
|
|
|
|
Profit before Financial Costs & Income Tax |
33,756,491 |
130,095,108 |
|
Financial Costs |
[11,834,821] |
[23,400,772] |
|
|
|
|
|
Profit before Income Tax |
21,921,670 |
106,694,336 |
|
Income Tax |
[1,743,879] |
[17,113,134] |
|
Net Profit / [Loss] |
20,177,791 |
89,581,202 |
FINANCIAL ANALYSIS
|
ITEM |
UNIT |
2011 |
2010 |
|
|
|
|
|
|
LIQUIDITY RATIO |
|
|
|
|
CURRENT RATIO |
TIMES |
1.31 |
1.28 |
|
QUICK RATIO |
TIMES |
0.81 |
0.88 |
|
|
|
|
|
|
ACTIVITY RATIO |
|
|
|
|
FIXED ASSETS TURNOVER |
TIMES |
3.86 |
4.17 |
|
TOTAL ASSETS TURNOVER |
TIMES |
1.23 |
1.58 |
|
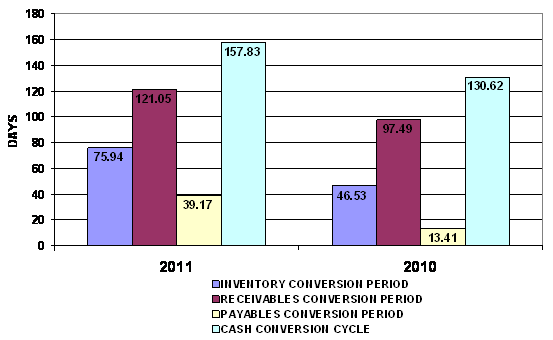
INVENTORY CONVERSION PERIOD |
DAYS |
75.94 |
46.53 |
|
INVENTORY TURNOVER |
TIMES |
4.81 |
7.84 |
|
RECEIVABLES CONVERSION PERIOD |
DAYS |
121.05 |
97.49 |
|
RECEIVABLES TURNOVER |
TIMES |
3.02 |
3.74 |
|
PAYABLES CONVERSION PERIOD |
DAYS |
39.17 |
13.41 |
|
CASH CONVERSION CYCLE |
DAYS |
157.83 |
130.62 |
|
|
|
|
|
|
PROFITABILITY RATIO |
|
|
|
|
COST OF GOODS SOLD |
% |
98.75 |
95.82 |
|
SELLING & ADMINISTRATION |
% |
1.95 |
1.67 |
|
INTEREST |
% |
0.93 |
1.57 |
|
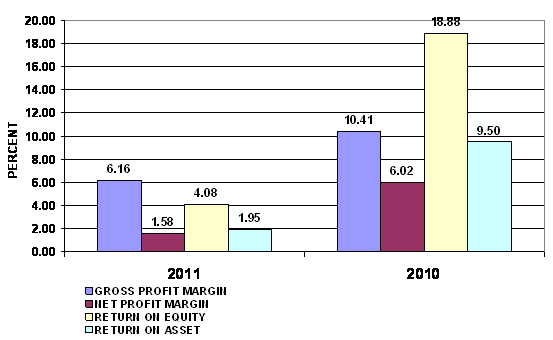
GROSS PROFIT MARGIN |
% |
6.16 |
10.41 |
|
NET PROFIT MARGIN BEFORE EX. ITEM |
% |
2.65 |
8.74 |
|
NET PROFIT MARGIN |
% |
1.58 |
6.02 |
|
RETURN ON EQUITY |
% |
4.08 |
18.88 |
|
RETURN ON ASSET |
% |
1.95 |
9.50 |
|
EARNING PER SHARE |
BAHT |
5.04 |
22.40 |
|
|
|
|
|
|
LEVERAGE RATIO |
|
|
|
|
DEBT RATIO |
TIMES |
0.52 |
0.50 |
|
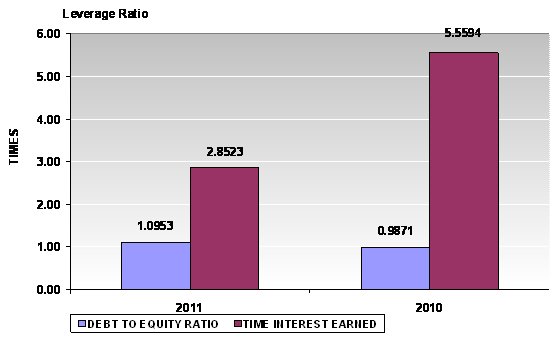
DEBT TO EQUITY RATIO |
TIMES |
1.10 |
0.99 |
|
TIME INTEREST EARNED |
TIMES |
2.85 |
5.56 |
|
|
|
|
|
|
ANNUAL GROWTH |
|
|
|
|
SALES GROWTH |
% |
(14.34) |
|
|
OPERATING PROFIT |
% |
(74.05) |
|
|
NET PROFIT |
% |
(77.48) |
|
|
FIXED ASSETS |
% |
(7.52) |
|
|
TOTAL ASSETS |
% |
9.93 |
|
PROFITABILITY RATIO
|
Gross Profit Margin |
6.16 |
Deteriorated |
Industrial Average |
14.05 |
|
Net Profit Margin |
1.58 |
Deteriorated |
Industrial Average |
3.37 |
|
Return on Assets |
1.95 |
Deteriorated |
Industrial Average |
4.00 |
|
Return on Equity |
4.08 |
Acceptable |
Industrial Average |
7.42 |
Gross Profit Margin used to assess a firm's financial health by
revealing the proportion of money left over from revenues after accounting for the
cost of goods sold. Gross profit margin serves as the source for paying
additional expenses and future savings. The company's figure is 6.16%. When
compared with the industry average, the ratio of the company was lower, indicated that company was originated from
the problems with control over its costs.
Net Profit Margin is the indicator of the company's efficiency in that
net profit takes into consideration all expenses of the company. A low profit
margin indicates a low margin of safety, higher risk that a decline in sales
will erase profits and result in a net loss. The company's figure is 1.58%.
When compared with the industry average, the ratio of the company was lower.
Return on Assets measures how efficiently profits are being generated
from the assets employed in the business when compared with the ratios of firms
in a similar business. A low ratio in comparison with industry averages
indicates an inefficient use of business assets. When compared with the
industry average, it was lower, the company's figure is 1.95%.
Return on Equity indicates how profitable a company is by comparing its
net income to its average shareholders' equity, ROE measures how much the
shareholders earned for their investment in the company. When compared with the
industry average, it was lower, the company's figure is 4.08%.
Trend of the average competitors in the same industry for last 5 years
Return on Assets Downtrend
Return on Equity Downtrend
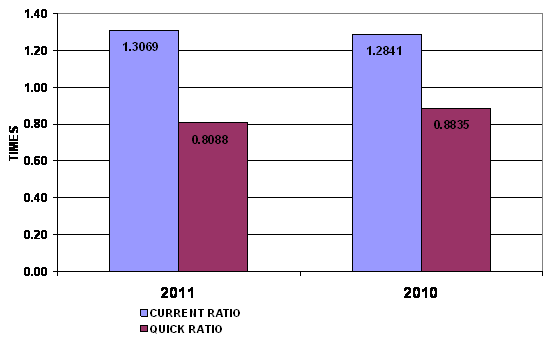
LIQUIDITY RATIO
|
Current Ratio |
1.31 |
Satisfactory |
Industrial Average |
1.39 |
|
Quick Ratio |
0.81 |
|
|
|
|
Cash Conversion Cycle |
157.83 |
|
|
|
The Current Ratio is to ascertain whether a company's short-term assets
are readily available to pay off its short-term liabilities. The company's figure
is 1.31 times in 2011, increased from 1.28 times, then it is generally
considered to have good short-term financial strength. When compared with the
industry average, the ratio of the company was lower.
The Quick Ratio is a liquidity indicator that further refines the
current ratio by measuring the amount of the most liquid current assets there
are to cover current liabilities. The company's figure is 0.81 times in 2011,
decreased from 0.88 times, by excluding inventory, the company may have problems
meeting current liabilities.
The Cash Conversion Cycle measures the number of days a company's cash
is tied up in the production and sales process of its operations and the
benefit from payment terms from its creditors. It meant the company could
survive when no cash inflow was received from sale for 158 days.
Trend of the average competitors in the same industry for last 5 years
Current Ratio Uptrend
LEVERAGE RATIO
|
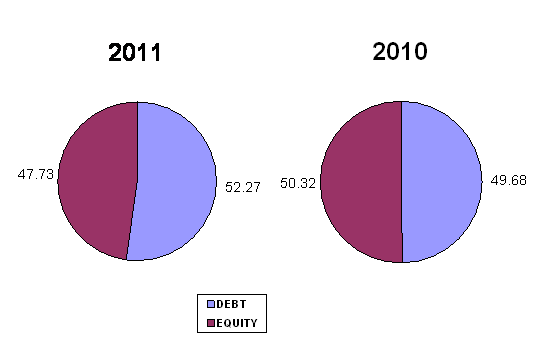
Debt Ratio |
0.52 |
Acceptable |
Industrial Average |
0.49 |
|
Debt to Equity Ratio |
1.10 |
Risky |
Industrial Average |
0.90 |
|
Times Interest Earned |
2.85 |
Acceptable |
Industrial Average |
4.54 |
Debt to Equity Ratio a measurement of how much suppliers, lenders, creditors
and obligors have committed to the company versus what the shareholders have
committed. A lower the percentage means that the company is using less leverage
and has a stronger equity position.
Times Interest Earned measuring a company's ability to meet its debt
obligations. Ratio is 2.86 higher than 1, so the company can pay interest
expenses on outstanding debt.
Debt Ratio shows the proportion of a company's assets which are financed
through debt. The company's figure is 0.52 greater than 0.5, most of the
company's assets are financed through debt.
Trend of the average competitors in the same industry for last 5 years
Debt Ratio Downtrend
Times Interest Earned Uptrend
ACTIVITY RATIO
|
Fixed Assets Turnover |
3.86 |
Impressive |
Industrial Average |
2.20 |
|
Total Assets Turnover |
1.23 |
Impressive |
Industrial Average |
1.17 |
|
Inventory Conversion Period |
75.94 |
|
|
|
|
Inventory Turnover |
4.81 |
Satisfactory |
Industrial Average |
5.14 |
|
Receivables Conversion Period |
121.05 |
|
|
|
|
Receivables Turnover |
3.02 |
Acceptable |
Industrial Average |
5.24 |
|
Payables Conversion Period |
39.17 |
|
|
|
Trend of the average competitors in the same industry for last 5 years
Fixed Assets Turnover Downtrend
Total Assets Turnover Downtrend
Inventory Turnover Downtrend
Receivables Turnover Uptrend
FOREIGN EXCHANGE RATES
|
Currency |
Unit
|
Indian Rupees |
|
US Dollar |
1 |
Rs.54.96 |
|
UK Pound |
1 |
Rs.88.23 |
|
Euro |
1 |
Rs.71.92 |
INFORMATION DETAILS
|
Report Prepared
by : |
SDA |
RATING EXPLANATIONS
|
RATING |
STATUS |
PROPOSED CREDIT LINE |
|
|
>86 |
Aaa |
Possesses an extremely sound financial base with the strongest capability
for timely payment of interest and principal sums |
Unlimited |
|
71-85 |
Aa |
Possesses adequate working capital. No caution needed for credit
transaction. It has above average (strong) capability for payment of interest
and principal sums |
Large |
|
56-70 |
A |
Financial & operational base are regarded healthy. General
unfavourable factors will not cause fatal effect. Satisfactory capability for
payment of interest and principal sums |
Fairly Large |
|
41-55 |
Ba |
Overall operation is considered normal. Capable to meet normal
commitments. |
Satisfactory |
|
26-40 |
B |
Capability to overcome financial difficulties seems comparatively
below average. |
Small |
|
11-25 |
Ca |
Adverse factors are apparent. Repayment of interest and principal sums
in default or expected to be in default upon maturity |
Limited with
full security |
|
<10 |
C |
Absolute credit risk exists. Caution needed to be exercised |
Credit not
recommended |
|
---- |
NB |
New Business |
---- |
This score serves as a reference to assess SC’s credit risk
and to set the amount of credit to be extended. It is calculated from a
composite of weighted scores obtained from each of the major sections of this report.
The assessed factors and their relative weights (as indicated through %) are as
follows:
Financial
condition (40%) Ownership
background (20%) Payment
record (10%)
Credit history
(10%) Market trend
(10%) Operational
size (10%)
This report is issued at your request without any risk
and responsibility on the part of MIRA INFORM PRIVATE LIMITED (MIPL) or its
officials.