MIRA
INFORM REPORT
|
Report Date : |
12.01.2013 |
IDENTIFICATION DETAILS
|
Name : |
THAILON TECHNO FIBER LIMITED |
|
|
|
|
Formerly Known As : |
THAILON SIX SIX
LIMITED |
|
|
|
|
Registered Office : |
219 Moo 3, Laemchabang Industrial Estate, T. Thungsukla, A. Sriracha, Chonburi 20230 |
|
|
|
|
Country : |
Thailand |
|
|
|
|
Financials (as on) : |
31.12.2011 |
|
|
|
|
Date of Incorporation : |
27.08.1993 |
|
|
|
|
Com. Reg. No.: |
0105536098488 [Former : 6842/2536] |
|
|
|
|
Legal Form : |
Private Limited Company
|
|
|
|
|
Line of Business : |
Manufacturer, Distributor
& Exporter of Yarns |
|
|
|
|
No. of Employees : |
260 |
RATING & COMMENTS
|
MIRA’s Rating : |
B |
|
RATING |
STATUS |
PROPOSED CREDIT LINE |
|
|
26-40 |
B |
Capability to overcome financial difficulties seems comparatively
below average. |
Small |
|
Status : |
Moderate |
|
|
|
|
Payment Behaviour : |
Slow but Correct |
|
|
|
|
Litigation : |
Clear |
NOTES:
Any query related to this report can be made
on e-mail: infodept@mirainform.com
while quoting report number, name and date.
ECGC Country Risk Classification List – June 30th, 2012
|
Country Name |
Previous Rating (31.03.2012) |
Current Rating (30.06.2012) |
|
Thailand |
B1 |
B1 |
|
Risk Category |
ECGC
Classification |
|
Insignificant |
A1 |
|
Low |
A2 |
|
Moderate |
B1 |
|
High |
B2 |
|
Very High |
C1 |
|
Restricted |
C2 |
|
Off-credit |
D |
thailand - ECONOMIC OVERVIEW
With a well-developed infrastructure, a free-enterprise economy, generally pro-investment policies, and strong export industries, Thailand enjoyed solid growth from 2000 to 2007 - averaging more than 4% per year - as it recovered from the Asian financial crisis of 1997-98. Thai exports - mostly machinery and electronic components, agricultural commodities, and jewelry - continue to drive the economy, accounting for more than half of GDP. The global financial crisis of 2008-09 severely cut Thailand's exports, with most sectors experiencing double-digit drops. In 2009, the economy contracted 2.3%. In 2010, Thailand's economy expanded 7.8%, its fastest pace since 1995, as exports rebounded from their depressed 2009 level. Steady economic growth at just below 4% during the first three quarters of 2011 was interrupted by historic flooding in October and November in the industrial areas north of Bangkok, crippling the manufacturing sector and leading to a revised growth rate of only 0.1% for the year. The industrial sector is poised to recover from the second quarter of 2012 onward, however, and the government anticipates the economy will probably grow between 5.5 and 6.5% for 2012, while private sector forecasts range between 3.8% and 5.7%.
|
Source : CIA |
company name
THAILON TECHNO
FIBER LIMITED
[FORMER : THAILON SIX SIX
LIMITED]
SUMMARY
BUSINESS ADDRESS : 219 MOO 3,
LAEMCHABANG INDUSTRIAL ESTATE,
T. THUNGSUKLA,
A. SRIRACHA, CHONBURI
20230
TELEPHONE : [66] 38 494-945-9
FAX : [66] 38 494-940
E-MAIL ADRESS : sales@thailon.co.th
REGISTRATION ADDRESS : SAME AS BUSINESS
ADDRESS
ESTABLISHED : 1993
REGISTRATION NO. : 0105536098488 [Former :
6842/2536]
TAX ID NO. : 3011324068
CAPITAL REGISTERED : BHT.
640,000,000
CAPITAL PAID-UP : BHT.
420,006,250
SHAREHOLDER’S PROPORTION : THAI : 99.22%
AMERICAN :
0.78%
FISCAL YEAR CLOSING DATE : DECEMBER 31
LEGAL STATUS : PRIVATE LIMITED
COMPANY
EXECUTIVE : MR. SANGA SANGASERMSAP,
THAI
PRESIDENT
NO. OF STAFF : 260
LINES OF BUSINESS : YARNS
MANUFACTURER, DISTRIBUTOR
& EXPORTER
CORPORATE PROFILE
OPERATING TREND : STABLE
PRESENT SITUATION : OPERATING NORMALLY
REPUTATION : FAIR
WITH NORMAL BUSINESS
ENGAGEMENT
MANAGEMENT STANDARD : MANAGEMENT
WITH LOW PERFORMANCE
HISTORY
The subject was
established on August
27, 1993 as
a private limited
company under the
registered name THAILON
SIX SIX LIMITED by a joint
venture among Asean
Interests Limited of
the Tolaram Corporation,
Hong Kong, Solutia Inc.
[Formerly Monsanto Inc.]
and American Fibres
Industries Inc, U.S.A.
Its business objective
is to produce
a variety of
yarns, including nylon
pre-oriented yarn, fully
drawn yarn and textured
yarn with BOI
promotion.
These yarns with unique
properties can be
found in products
ranging from ladies’
hosiery and men’s
socks to computer
topes and tire
cord fabrics.
The subject received
ISO 9002 and ISO 9001:2008
certificates from BVQI,
in September 1999,
and 2008, respectively,
and also holder
of OKO Tex
certificate [Switzerland] for
products totally free
of any hazardous
chemicals in January
1999.
On December 29, 2003,
the subject has been taken
over by Thais
and alliance groups,
and its name
was changed to
THAILON TECHNO FIBER
LIMITED. It currently
employs approximate 260
staff.
The subject’s registered
address is 219
Moo 3, Laemchabang
Industrial Estate,
T. Thungsukla, A. Sriracha, Chonburi
20230, and this is
the subject’s current
operation address.
THE BOARD OF DIRECTORS
|
Name |
Nationality |
Age |
|
|
|
|
|
Mr. Sanga Sangasermsap |
Thai |
59 |
|
Mrs. Urairat Saengwatanaroj |
Thai |
59 |
AUTHORIZED PERSON
One of the
above directors can
sign on behalf
of the subject
with company’s affixed.
MANAGEMENT
Mr. Sanga Sangasermsap
is the President.
He is Thai
nationality with the
age of 59
years old.
He has been
in this position
since October 2003.
Mr. Theerien Lai
is the Chief
Executive Officer and
Factory Manager.
He is Thai
nationality.
Mrs. Urairat Saengwatanaroj is
the Vice President
[Account & Finance].
She is Thai
nationality with the
age of 59
years old.
Mr. Natraj R.C. is
the Marketing Manager.
He is Indian
nationality.
BUSINESS OPERATIONS
The subject’s activity
is a manufacturer a
variety of synthetic
nylon 6 and
6.6 yarn including
Air Textured Yarn [ATY],
Draw Textured Yarn [DTY],
Nylon 6 and 6.6
Fully Drawn Yarn [FDY],
and Nylon 6
and 6.6 Partially
Oriented Yarn [POY].
Its products are
supported to textile market
of hosiery, active
wears, apparel and
fine woven fabrics.
PRODUCTION
FDY : 150
MT per month
POY : 450
MT per month
DTY : 450
MT per month
ATY : 100
MT per month
IMPORT [COUNTRIES]
50% of raw
materials, equipments and
instruments are imported
from Republic of China,
Germany, United Kingdom, Taiwan,
India, Hong Kong,
Australia, Japan and Switzerland.
MAJOR SUPPLIERS
Asia Fiber Public
Company Limited :
Thailand
Pearl Polymers Co.,
Ltd. : Thailand
SALES
The products are
sold directly to manufacturers
both domestic and
overseas customers. 80% of its
products is exported to Republic of China, Taiwan, Singapore, Malaysia, Indonesia, United
States of America, United Kingdom,
India, Germany, Korea,
Denmark, Spain, Switzerland,
Philippines, Vietnam, Hong
Kong, Middle East
and others with
over 50 countries,
the remaining 20% is sold
locally.
LITIGATION
Bankruptcy and Receivership
There are no
litigation on bankruptcy
and receivership cases
filed against the
subject found at
Legal Execution Department
for the past
five years.
Others
There are no
legal suits filed
against the subject
according to IRICO’S
DATABASE for the
past two years.
SUBSIDIARY AND AFFILIATED COMPANY
The subject is
not found to
have any subsidiary
or affiliated company
here in Thailand.
CREDIT
Sales are by
cash on the
credits term of
30-60 days.
Local bills are
paid by cash
on the credits
term of 30-60 days.
Imports are by
L/C at sight
& T/T.
Exports are against
L/C at sight
& T/T.
BANKING
Bank of America
NT & SA
[Bangkok Branch
: 2/2 Wireless Rd.,
Lumpini, Pathumwan, Bangkok
10330]
Bangkok Bank Public
Co., Ltd.
[Sriracha Branch : 98
Sukhumvit Rd., Nongkharm,
Sriracha, Cholburi 20230]
EMPLOYMENT
The subject employs
approximately 260 office
staff and factory
workers.
LOCATION DETAILS
The premise is
rented for administrative office,
factory and warehouse
at the heading
address on 76,800
square meters of
area. Premise is
located in industrial
area.
COMMENT
The subject’s business performance
in 2012 was
moderate in line
with demand of
the products from both local and overseas markets. Sales
were slightly increased
from rising demand of the
products.
Its business performance
has gradually improved in the
year 2012 and
current business outlook
remains positive.
FINANCIAL INFORMATION
The capital was registered at
Bht. 250,000,000 divided into 100,000
shares of Bht.
2,500 each.
On March 25,
2004 the registered capital was
increased to Bht. 640,000,000
divided into 256,000
shares of Bht.
2,500 each.
THE SHAREHOLDERS LISTED WERE
[as at April
30, 2012] at
Bht. 420,006,250 of
capitalization.
|
NAME |
HOLDING |
% |
|
|
|
|
|
Mr. Sanga Sangasermsap Nationality: Thai Address : 1821/45 Charoenkrung Rd.,
Bangpongpang, Yannawa,
Bangkok |
73,525 |
28.72 |
|
Mrs. Urairat Saengwatanaroj Nationality: Thai Address : 817
Sudprasert Rd., Bangklo,
Bangkorlaem, Bangkok |
40,000 |
15.63 |
|
Mr. Theerien Lai Nationality: Thai Address : 76/3
Sukhumvit 39 Rd.,
Klongtonnua,
Wattana, Bangkok |
34,330 |
13.41 |
|
P.S.D. Knitting Co.,
Ltd. Nationality: Thai Address : 817
Sudprasert Rd., Bangklo,
Bangkorlaem,
Bangkok |
32,145 |
12.56 |
|
Bangkok Autosales And
Service Co., Ltd. Nationality: Thai Address : 76/3
Sukhumvit 39 Rd.,
Klongtonnua,
Wattana, Bangkok 10110 |
30,000 |
11.72 |
|
D. Techno Tex Co.,
Ltd. Nationality: Thai Address : 2/2
Moo 4, Bangbuathong-Suphanburi Rd.,
T.
Rajniyom, A. Sainoi, Nonthaburi |
24,000 |
9.37 |
|
D. Interior Solution
Co., Ltd. Nationality: Thai Address : 1821/45
Charoenkrung Rd., Bangpongpang,
Yannawa, Bangkok |
20,000 |
7.81 |
|
Mr. Kian Minh
Lai Nationality: American Address : - |
2,000 |
0.78 |
Total Shareholders :
8
Share Structure
[as at April 30,
2012]
|
Nationality |
Shareholders |
No. of Share |
% Shares |
|
|
|
|
|
|
Thai |
7 |
254,000 |
99.22 |
|
Foreign - American |
1 |
2,000 |
0.78 |
|
Total |
8 |
256,000 |
100.00 |
NAME OF AUDITOR & CERTIFIED
PUBLIC ACCOUNTANT NO.
Mr. Chayapol Supasethanon No.
3972
BALANCE SHEET [BAHT]
The latest financial
figures published for
December 31, 2011,
2010 & 2009 were:
ASSETS
|
Current Assets |
2011 |
2010 [Adjusted] |
2009 |
|
|
|
|
|
|
Cash and Cash Equivalents |
6,672,287 |
7,935,652 |
9,787,978 |
|
Trade Accounts & Other
Receivable |
144,530,047 |
152,249,377 |
124,306,518 |
|
Short-term Lending to Directors |
- |
14,064,650 |
- |
|
Inventories |
259,695,123 |
238,395,623 |
175,867,244 |
|
Refundable Business Tax |
- |
- |
2,786,745 |
|
Prepaid for Goods |
- |
- |
2,318,899 |
|
Other Current Assets
|
10,024,910 |
8,596,943 |
5,060,578 |
|
|
|
|
|
|
Total Current Assets
|
420,922,367 |
421,242,245 |
320,127,962 |
|
Cash at Bank pledged
as a Collateral |
4,220,766 |
4,184,181 |
4,138,902 |
|
Fixed Assets |
455,717,241 |
486,390,087 |
756,091,744 |
|
Intangible Assets |
18,149,105 |
19,154,779 |
20,163,216 |
|
Other Non-current Assets |
294,608 |
316,969 |
1,440,066 |
|
Total Assets |
899,304,087 |
931,288,261 |
1,101,961,890 |
LIABILITIES &
SHAREHOLDERS' EQUITY [BAHT]
|
Current
Liabilities |
2011 |
2010 [Adjusted] |
2009 |
|
|
|
|
|
|
Bank Overdraft & Short-term Loan from Financial Institutions |
534,308,850 |
442,870,750 |
516,395,918 |
|
Trade Account & Other Payable |
115,161,316 |
172,196,376 |
84,262,305 |
|
Current Portion of
Finance Lease Contract Liabilities |
1,680,778 |
142,667 |
354,625 |
|
Current Portion of
Long-term Loan |
58,440,000 |
76,440,000 |
60,000,000 |
|
Current Liabilities of
Long-term Loan |
- |
- |
355,248,203 |
|
Short-term Loan from
Related Company |
945,077 |
36,020,076 |
20,696,077 |
|
Current Portion of
Long-term Loan from Related
Company |
- |
- |
20,324,000 |
|
Other Current Liabilities |
6,595,197 |
8,943,166 |
17,816,957 |
|
|
|
|
|
|
Total Current Liabilities |
717,131,218 |
736,613,035 |
1,075,098,085 |
|
Finance Lease Contract Liabilities - Net
of Current Portion |
2,192,195 |
130,778 |
278,395 |
|
Long-term Loan - Net
of Current Portion |
490,469,698 |
527,838,203 |
115,500,000 |
|
Reserve for Employee Benefit |
1,919,506 |
- |
- |
|
Total Liabilities |
1,211,712,617 |
1,264,582,016 |
1,190,876,480 |
|
|
|
|
|
|
Shareholders' Equity |
|
|
|
|
|
|
|
|
|
Share capital : Baht 2,500
par value Authorized &
issued share capital
256,000 shares |
640,000,000 |
640,000,000 |
640,000,000 |
|
|
|
|
|
|
Capital Paid |
420,006,250 |
389,931,250 |
389,931,250 |
|
Surplus on Revaluation
of Assets |
- |
- |
243,812,693 |
|
Retained Earning -
Unappropriated [Deficit] |
[732,414,780] |
[723,225,005] |
[722,658,533] |
|
Total Shareholders' Equity
[Deficit] |
[312,408,530] |
[333,293,755] |
[88,914,590] |
|
Total Liabilities & Shareholders' Equity |
899,304,087 |
931,288,261 |
1,101,961,890 |
PROFIT & LOSS ACCOUNT
|
Revenue |
2011 |
2010 [Adjusted] |
2009 |
|
|
|
|
|
|
Sales |
908,380,707 |
907,237,376 |
601,374,141 |
|
Other Income |
37,679,074 |
49,529,045 |
30,482,913 |
|
Total Revenues |
946,059,781 |
956,766,421 |
631,857,054 |
|
Expenses |
|
|
|
|
|
|
|
|
|
Cost of Goods
Sold |
852,201,539 |
843,940,315 |
631,360,682 |
|
Selling Expenses |
29,980,425 |
42,181,407 |
25,444,947 |
|
Administrative Expenses |
24,282,682 |
14,836,697 |
15,649,915 |
|
Total Expenses |
906,464,646 |
900,958,419 |
672,455,544 |
|
|
|
|
|
|
Profit / [Loss] before Finance
Expenses |
39,595,135 |
55,808,002 |
[40,598,490] |
|
Finance Expenses |
[48,784,910] |
[62,731,538] |
[63,772,161] |
|
Net Profit / [Loss] |
[9,189,775] |
[6,923,536] |
[104,370,651] |
FINANCIAL ANALYSIS
|
ITEM |
UNIT |
2011 |
2010 |
2009 |
|
|
|
|
|
|
|
LIQUIDITY RATIO |
|
|
|
|
|
CURRENT RATIO |
TIMES |
0.59 |
0.57 |
0.30 |
|
QUICK RATIO |
TIMES |
0.21 |
0.24 |
0.12 |
|
|
|
|
|
|
|
ACTIVITY RATIO |
|
|
|
|
|
FIXED ASSETS TURNOVER |
TIMES |
1.99 |
1.87 |
0.80 |
|
TOTAL ASSETS TURNOVER |
TIMES |
1.01 |
0.97 |
0.55 |
|
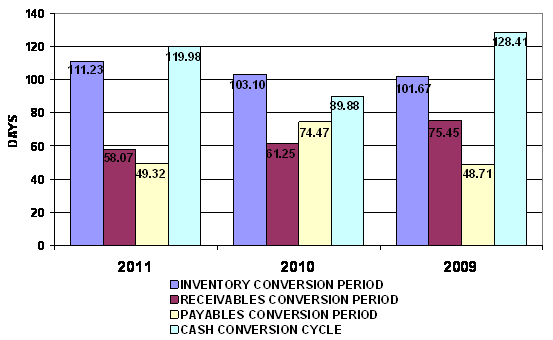
INVENTORY CONVERSION PERIOD |
DAYS |
111.23 |
103.10 |
101.67 |
|
INVENTORY TURNOVER |
TIMES |
3.28 |
3.54 |
3.59 |
|
RECEIVABLES CONVERSION PERIOD |
DAYS |
58.07 |
61.25 |
75.45 |
|
RECEIVABLES TURNOVER |
TIMES |
6.29 |
5.96 |
4.84 |
|
PAYABLES CONVERSION PERIOD |
DAYS |
49.32 |
74.47 |
48.71 |
|
CASH CONVERSION CYCLE |
DAYS |
119.98 |
89.88 |
128.41 |
|
|
|
|
|
|
|
PROFITABILITY RATIO |
|
|
|
|
|
COST OF GOODS SOLD |
% |
93.82 |
93.02 |
104.99 |
|
SELLING & ADMINISTRATION |
% |
5.97 |
6.28 |
6.83 |
|
INTEREST |
% |
5.37 |
6.91 |
10.60 |
|
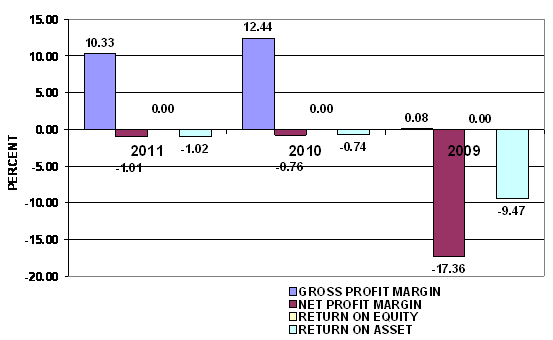
GROSS PROFIT MARGIN |
% |
10.33 |
12.44 |
0.08 |
|
NET PROFIT MARGIN BEFORE EX. ITEM |
% |
4.36 |
6.15 |
(6.75) |
|
NET PROFIT MARGIN |
% |
(1.01) |
(0.76) |
(17.36) |
|
RETURN ON EQUITY |
% |
- |
- |
- |
|
RETURN ON ASSET |
% |
(1.02) |
(0.74) |
(9.47) |
|
EARNING PER SHARE |
BAHT |
(54.70) |
(44.39) |
(669.16) |
|
|
|
|
|
|
|
LEVERAGE RATIO |
|
|
|
|
|
DEBT RATIO |
TIMES |
1.35 |
1.36 |
1.08 |
|
DEBT TO EQUITY RATIO |
TIMES |
(3.88) |
(3.79) |
(13.39) |
|
TIME INTEREST EARNED |
TIMES |
0.81 |
0.89 |
(0.64) |
|
|
|
|
|
|
|
ANNUAL GROWTH |
|
|
|
|
|
SALES GROWTH |
% |
0.13 |
50.86 |
|
|
OPERATING PROFIT |
% |
(29.05) |
(237.46) |
|
|
NET PROFIT |
% |
(32.73) |
93.37 |
|
|
FIXED ASSETS |
% |
(6.31) |
(35.67) |
|
|
TOTAL ASSETS |
% |
(3.43) |
(15.49) |
|
ANNUAL GROWTH : RISKY
An annual sales growth is 0.13%. Turnover has increased from THB
PROFITABILITY : ACCEPTABLE
PROFITABILITY RATIO
|
Gross Profit Margin |
10.33 |
Impressive |
Industrial Average |
8.04 |
|
Net Profit Margin |
(1.01) |
Deteriorated |
Industrial Average |
2.21 |
|
Return on Assets |
(1.02) |
Deteriorated |
Industrial Average |
2.63 |
|
Return on Equity |
- |
|
Industrial Average |
6.19 |
Gross Profit Margin used to assess a firm's financial health by
revealing the proportion of money left over from revenues after accounting for
the cost of goods sold. Gross profit margin serves as the source for paying
additional expenses and future savings. The company’s figure is 10.33%. When compared with the industry
average, the ratio of the company was higher, indicated that company was more
profitable than the same industry.
Net Profit Margin is the indicator of the company's efficiency in that
net profit takes into consideration all expenses of the company. A low profit
margin indicates a low margin of safety, higher risk that a decline in sales
will erase profits and result in a net loss. The company's figure is -1.01%.
When compared with the industry average, the ratio of the company was lower.
Return on Assets measures how efficiently profits are being generated
from the assets employed in the business when compared with the ratios of firms
in a similar business. A low ratio in comparison with industry averages
indicates an inefficient use of business assets. When compared with the
industry average, it was lower, the company's figure is -1.02%.
Trend of the average competitors in the same industry for last 5 years
Return on Assets Uptrend
Return on Equity Uptrend
LIQUIDITY : RISKY
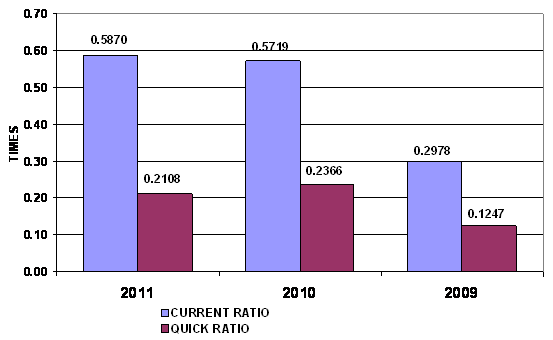
LIQUIDITY RATIO
|
Current Ratio |
0.59 |
Risky |
Industrial Average |
1.18 |
|
Quick Ratio |
0.21 |
|
|
|
|
Cash Conversion Cycle |
119.98 |
|
|
|
The Current Ratio is to ascertain whether a company's short-term assets
are readily available to pay off its short-term liabilities. The company's
figure is 0.59 times in 2011, increased from 0.57 times, then the company may
not be efficiently using its current assets. When compared with the industry
average, the ratio of the company was lower.
The Quick Ratio is a liquidity indicator that further refines the
current ratio by measuring the amount of the most liquid current assets there
are to cover current liabilities. The company's figure is 0.21 times in 2011,
decreased from 0.24 times, then the company has not enough current assets that
presumably can be quickly converted to cash for pay financial obligations.
The Cash Conversion Cycle measures the number of days a company's cash
is tied up in the production and sales process of its operations and the
benefit from payment terms from its creditors. It meant the company could
survive when no cash inflow was received from sale for 120 days.
Trend of the average competitors in the same industry for last 5 years
Current Ratio Uptrend
LEVERAGE : RISKY
LEVERAGE RATIO
|
Debt Ratio |
1.35 |
Risky |
Industrial Average |
0.57 |
|
Debt to Equity Ratio |
(3.88) |
Risky |
Industrial Average |
1.28 |
|
Times Interest Earned |
0.81 |
Risky |
Industrial Average |
2.97 |
Debt to Equity Ratio a measurement of how much suppliers, lenders,
creditors and obligors have committed to the company versus what the
shareholders have committed. A lower the percentage means that the company is
using less leverage and has a stronger equity position.
Times Interest Earned measuring a company's ability to meet its debt
obligations. Ratio is 0.82 lower than 1, so the company is not generating
enough cash from EBIT to meet its interest obligations.
Debt Ratio shows the proportion of a company's assets which are financed
through debt. The company's figure is 1.35 greater than 0.5, most of the company's assets are
financed through debt.
Trend of the average competitors in the same industry for last 5 years
Debt Ratio Uptrend
Times Interest Earned Uptrend
ACTIVITY : IMPRESSIVE
ACTIVITY RATIO
|
Fixed Assets Turnover |
1.99 |
Impressive |
Industrial Average |
1.67 |
|
Total Assets Turnover |
1.01 |
Satisfactory |
Industrial Average |
1.11 |
|
Inventory Conversion Period |
111.23 |
|
|
|
|
Inventory Turnover |
3.28 |
Acceptable |
Industrial Average |
6.34 |
|
Receivables Conversion Period |
58.07 |
|
|
|
|
Receivables Turnover |
6.29 |
Impressive |
Industrial Average |
6.00 |
|
Payables Conversion Period |
49.32 |
|
|
|
The company's Account Receivable Ratio is calculated as 6.29 and
Inventory Turnover in Days Ratio indicates the liquidity of inventory.
It estimates the number of days that it will take to sell the current
inventory. Inventory is particularly sensitive to change in business
activities. The inventory turnover in days has increased from 103 days at the
end of 2010 to 111 days at the end of 2011. This represents a negative trend.
And Inventory turnover has decreased from 3.54 times in year 2010 to 3.28 times
in year 2011.
The company's Total Asset Turnover is calculated as 1.01 times and 0.97
times in 2011 and 2010 respectively. This ratio is determined by dividing total
assets into total sales turnover. The ratio measures the activity of the assets
and the ability of the firm to generate sales through the use of the assets.
Trend of the average competitors in the same industry for last 5 years
Fixed Assets Turnover Uptrend
Total Assets Turnover Uptrend
Inventory Turnover Uptrend
Receivables Turnover Uptrend
FOREIGN EXCHANGE RATES
|
Currency |
Unit
|
Indian Rupees |
|
US Dollar |
1 |
Rs.54.54 |
|
UK Pound |
1 |
Rs.88.05 |
|
Euro |
1 |
Rs.72.29 |
INFORMATION DETAILS
|
Report Prepared
by : |
SDA |
RATING EXPLANATIONS
|
RATING |
STATUS |
PROPOSED CREDIT LINE |
|
|
>86 |
Aaa |
Possesses an extremely sound financial base with the strongest
capability for timely payment of interest and principal sums |
Unlimited |
|
71-85 |
Aa |
Possesses adequate working capital. No caution needed for credit
transaction. It has above average (strong) capability for payment of interest
and principal sums |
Large |
|
56-70 |
A |
Financial & operational base are regarded healthy. General
unfavourable factors will not cause fatal effect. Satisfactory capability for
payment of interest and principal sums |
Fairly Large |
|
41-55 |
Ba |
Overall operation is considered normal. Capable to meet normal
commitments. |
Satisfactory |
|
26-40 |
B |
Capability to overcome financial difficulties seems comparatively
below average. |
Small |
|
11-25 |
Ca |
Adverse factors are apparent. Repayment of interest and principal sums
in default or expected to be in default upon maturity |
Limited with
full security |
|
<10 |
C |
Absolute credit risk exists. Caution needed to be exercised |
Credit not
recommended |
|
---- |
NB |
New Business |
---- |
This score serves as a reference to assess SC’s credit risk
and to set the amount of credit to be extended. It is calculated from a
composite of weighted scores obtained from each of the major sections of this
report. The assessed factors and their relative weights (as indicated through
%) are as follows:
Financial
condition (40%) Ownership
background (20%) Payment
record (10%)
Credit history
(10%) Market trend
(10%) Operational
size (10%)
This report is issued at your request without any
risk and responsibility on the part of MIRA INFORM PRIVATE LIMITED (MIPL)
or its officials.